1121 Clayberg Rd #108 · Greenwich, OH
Flood risk No data
- FEMA flood zone
- —
- Chance of flooding over 30 yrs
- —
- Est. flood insurance / yr
- —
Fire risk No data
- Est. fire insurance / yr
- —
Heat risk No data
- Hot days now (above threshold)
- —
- Hot days in 30 yrs
- —
Wind risk No data
- Chance of severe wind over 30 yrs
- —
Air-quality risk No data
- Unhealthy air days now
- —
- Unhealthy air days in 30 yrs
- —
Risk factors via First Street. Map © Google.
Why this score? — see what drove the C- grade
The composite is a weighted blend of 9 inputs, each scored 0–100. Each bar is that input's sub-score; the figure is the points it added to the 100-point composite (weight × sub-score).
- Cash flow +15.0/30.0
- ARV discount +15.0/15.0
- 1% rule +5.0/10.0
- DSCR +5.0/10.0
- Schools +5.0/10.0
- Livability +3.4/5.0
- Rent growth +2.5/5.0
- Condition / age +2.5/5.0
- Appreciation +0.0/10.0
$17,500
🖨 Deal sheet 📄 Offer letter ✓ Due diligence
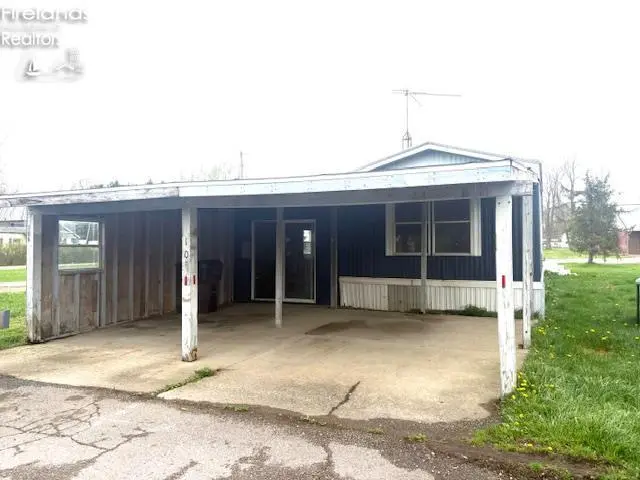
Listing remarks
This 3-bedroom, 1-bath Commodore home offers 1,008 square feet of well-utilized living space with a layout designed for everyday functionality. Built in 1996, the home features a spacious living area that flows into a centrally located kitchen, providing ample cabinet space and flexibility with both propane and electric stove hookups. The split-bedroom design allows for separation between the primary bedroom and additional bedrooms, offering added privacy. An enclosed porch extends the living space and provides a great area for relaxing, storage, or seasonal use. The home is equipped with propane heat and an electric hot water heater, delivering a practical and efficient setup. With its str
Key facts
- Spacious living area
- Ample cabinet space
- Split-bedroom design
Tags
Neighborhood map
What this means for you Summary
Snapshot
- This is a 3-bed/1.0-bath manufactured listed at $18k.
Deal economics
- At list price, monthly cash flow is $325 ($4k/yr) — positive.
- The deal already cash-flows at list — no discount required.
- Meets the 1% rule at list price ($1k rent vs $18k).
Location & tenants
- Location reads 67/100 on livability (#615 in OH) — a middle-class / working-renter tenant base. Strengths: crime A+, cost of living A+, housing A+; Watch: employment D, amenities F, commute F.
- Market conditions: 12 active listings in the ZIP; 145 units permitted in Richland County in 2024 (0 in 5+ unit buildings).
- This rent is only 18% of the median local income ($70k/yr) — well below the 30% rent-burden line; pricing power to push rent on renewal without tenant pushback.
Forward outlook
- Local home prices are declining (-3.0%/yr); year-one equity from $121 of loan paydown is wiped out by about $525 of value loss. Plan a longer hold.
- Richland County population projected at -18% by 2050 — secular population decline; favor cash flow + early exit over multi-decade hold.
- At projected returns (-3.0% appreciation + 3.0% rent growth), your $5k cash investment doubles in ~2 years — after that, you're playing with house money.
Negotiation context
- Only 7 days on market — expect competitive offers; lowballing is unlikely to land.
Risks & watch-outs
- Watch-outs: HOA is 35% of rent.
Questions for the listing agent
- What does the HOA fee cover, when was the last increase, and are there any pending special assessments or reserve-fund shortfalls?
- Is there a deadline driving the sale (1031 exchange, divorce, estate, relocation)? That informs how much negotiation room exists.
- What's the average days-on-market for RENTAL listings here right now (not sales)? A rising rental-DOM trend means longer vacancies and softer asking-rent achievability than the comps imply.
- What's the recent tenant-quality profile in this submarket — average credit score on applications, eviction rate, late-payment / NSF rate, and stable-employment percentage? A property-management company in the area should have these aggregated.
- How much new for-sale + rental construction is in the pipeline within 1–3 miles? Heavy new supply typically softens prices + rents 12–24 months out; constrained supply supports both.
Investment metrics
- 1% rule
- 5.83% ✓
- Cap rate
- 28.57%
- Cash-on-cash
- 79.56%
- DSCR
- 4.54
- GRM
- 1.4
CMA / ARV
- ARV (on-the-fly)
- $21,168
- Comps found
- 9
Show comp detail 9 sales within ~0.75 mi
| Address | Dist | Beds/Ba | Sqft | Sold | Price | $/sf | Match |
|---|---|---|---|---|---|---|---|
| 1121 Clayberg Rd #108 | 0.00mi | 3/1.0 | 1,008 (0%) | 1mo | $19,000 | $19 | 99 |
| 1121 Clayberg Rd Rd #58 | 0.00mi | 3/1.0 | 980 (-3%) | 1mo | $16,000 | $16 | 94 |
| 1121 Clayberg Ave #79 | 0.00mi | 3/2.0 | 1,008 (0%) | 5mo | $27,500 | $27 | 92 |
| 1211 Clayberg Rd #51 | 0.26mi | 3/2.0 | 1,008 (0%) | 3mo | $26,000 | $26 | 81 |
| 1121 Clayberg Rd #81 | 0.00mi | 3/2.0 | 1,088 (+8%) | 4mo | $29,000 | $27 | 80 |
| 1121 Clayberg Rd #75 | 0.00mi | 2/1.0 (-1) | 910 (-10%) | 2mo | $9,900 | $11 | 78 |
| 1121 Clayberg Rd #4 | 0.00mi | 2/2.0 (-1) | 938 (-7%) | 8mo | $20,000 | $21 | 72 |
| 1121 Clayberg Rd #26 | 0.00mi | 2/1.0 (-1) | 858 (-15%) | 3mo | $10,000 | $12 | 68 |
| 1121 Clayberg Rd #91 | 0.00mi | 4/2.0 (+1) | 1,125 (+12%) | 4mo | $25,300 | $22 | 68 |
Match score weights: distance 35% · size 25% · config 20% · recency 20%. Top-matched comps best support the ARV.
Projected returns pro-forma
-3.0% appreciation · 3.0% rent growth · sell at horizon
- IRR
- 80.2%
- Equity multiple
- 4.69×
- Total profit
- $18,093
- Equity at exit
- $2,609
- IRR
- 83.7%
- Equity multiple
- 9.85×
- Total profit
- $43,361
- Equity at exit
- $1,513
Cash invested: $4,900 (down + closing). Projections, not guarantees.
Landlord ↔ Tenant lean methodology
- Overall (STATE)
- 73 Landlord-Friendly
- State Ohio
- 73 Landlord-Friendly · R+6
- County
- — inherits STATE
- City
- — inherits STATE
ZIP-level market 44837
- Home prices YoY
- -5.6%
- Active inventory
- 12
- Price-to-rent
- 1.4×
Monthly cashflow live
- Estimated rent
- $1,020 medium interval (Pro) →
- Mortgage (P&I)
- −$92
- Tax est. 1.5%
- −$22 /mo · $262/yr
- Insurance
- −$7
- HOA
- −$360
- Vacancy / Maint / Mgmt
- −$214
- Net cashflow
- $325
Break-even live
UW: 25.0% down · 7.5% · 30yr · 1.5% tax · 5.0% vac · 8.0% maint · 8.0% mgmt
Financing live
Cash to close
- Down payment
- $4,375
- Closing costs
- $525
- Reserves months
- —
- Total cash needed
- —
Loan-product check · same deal, 3 products live
Conventional
25% down · 7.5% · 30yr
- Down + closing
- —
- Monthly P&I
- —
- Monthly cashflow
- —
- DSCR
- —
- Eligible?
- —
Personal DTI + credit; lowest rate.
DSCR
20% down · 8.5% · 30yr
- Down + closing
- —
- Monthly P&I
- —
- Monthly cashflow
- —
- DSCR
- —
- Eligible?
- —
No personal income docs; deal must DSCR.
Hard money
10% down · 12.0% · 12mo
- Down + closing
- —
- Monthly P&I
- —
- Monthly cashflow
- —
- DSCR
- —
- Eligible?
- —
Short-term bridge; refi at stabilization.
HOA detail
- Monthly dues
- $360 · $4,320/yr
- Likely covers
- waterelectric
Listing history 2 events
-
2026-04-27status Pending
-
2026-04-20$17,500 Active
ⓘ Source: listings_history table (triggers on properties + properties_extension) + one-shot
backfill from property_details.listing_events for pre-trigger history.
Nearby sold comps map
Loading sold comps map…
Walkable amenities ~0.75 mi
Loading nearby amenities…
Taxation est. · year 1
- Rental income
- $12,240
- − Mortgage interest
- −$980
- − Property taxes
- −$262
- − Insurance
- −$88
- − Repairs & maintenance
- −$979
- − Management
- −$979
- − HOA
- −$4,320
- − Depreciation
- −$509
- Taxable income
- $4,123
- Est. tax owed @ 24.0%
- −$989
- After-tax cash flow
- $2,909/yr
For passive investors: Depreciation is non-cash, so a rental often shows a tax loss while cash-flowing — sheltering income. Rental losses are passive: they offset passive income freely, and up to $25,000/yr can offset ordinary (W-2) income if you actively participate and your MAGI is under $100k (phasing out to $0 by $150k); unused losses carry forward. On sale, claimed depreciation is recaptured at up to 25%, and gains may owe capital-gains tax (a 1031 exchange can defer both). Figures are a year-1 estimate at your 24.0% rate — not tax advice; consult a CPA.
Schools (NCES district)
No district data.
Livability — Greenwich
- Score
- 67/100
- State rank
- #615
- US rank
- #10621
Category grades
Schools grade is shown separately in the Schools card above.
Census & demographics
- County
- Huron · 56,496 people
- Population (ZIP)
- 4,514
- Household income
- $69,513
- Rent vs Own
- Severe rent burden
- 11.5
Population outlook (Richland County) Hauer SSP2
- Today (2025)
- 115,577 people
- By 2030
- 111,669 · -3.4%
- By 2040
- 103,323 · -10.6%
- By 2050
- 95,135 · -17.7%
- By 2075
- 76,719 · -33.6%
- By 2100
- 57,188 · -50.5%
Race, ethnicity, and origin ACS 2023
- Neighborhood character
- Predominantly White (94%)
- Race & ethnicity
- White 94% Two or more races 6%
- Common ancestry
- Hungarian 3% Polish 2% Serbian 2%
- Foreign-born
- 1% · Vietnam
- Languages at home
- 90% English-only · German/W. Germanic 10%
Political lean MEDSL · Richland
- 2024 margin
- Solid R (+42.3) · D 28.4% · R 70.8%
- 2008→2024 swing
- -28.8pp toward R · 2008: -13.6pp · 2024: -42.3pp
- All cycles
- 2024: R+42.3 2020: R+39.7 2016: R+37.5 2012: R+20.1 2008: R+13.6
Not yet ingested
- Civics
- —
Market trends
- HPI YoY
- ▼ -15.77%
- Current HPI
- 265.9942
- Rent YoY
- —
- Metro
- —
- State GDP YoY
- ▲ 1.98%
- F500 in state
- 48
Industry mix (Fortune 500 HQ in OH)
| Industry | F500 HQs | Revenue |
|---|---|---|
| Insurance | 3 | $145B |
|
||
| Industrial Machinery | 3 | $49B |
|
||
| Financial Services | 3 | $24B |
|
||
| Consumer Goods | 2 | $93B |
|
||
| Aerospace / Defense | 2 | $47B |
|
||
| Utilities | 2 | $33B |
|
||
Price history
2 events — show timeline
- 2026-04-27 Pending — FAOR
- 2026-04-20 Listed $17,500 FAOR
Cash-flow waterfall
monthlySold comps — $/sqft
last 12 mo · ≤1 miLoading sold comps…