5433 Brookswood Way #806 · Pine Hills, FL
Flood risk 1/10 · Minimal
- FEMA flood zone
- X (unshaded)
- Chance of flooding over 30 yrs
- 0.0%
- Est. flood insurance / yr
- $507 – $1,088
Fire risk 1/10 · Minimal
- Est. fire insurance / yr
- $947 – $1,759
Heat risk 9/10 · Severe
- Hot days now (above 108°F)
- 7 days/yr
- Hot days in 30 yrs
- 23 days/yr
Wind risk 9/10 · Severe
- Chance of severe wind over 30 yrs
- 99.0%
Air-quality risk 1/10 · Minimal
- Unhealthy air days now
- 0 days/yr
- Unhealthy air days in 30 yrs
- 0 days/yr
Risk factors via First Street. Map © Google.
Why this score? — see what drove the C grade
The composite is a weighted blend of 9 inputs, each scored 0–100. Each bar is that input's sub-score; the figure is the points it added to the 100-point composite (weight × sub-score).
- Cash flow +21.6/30.0
- 1% rule +10.0/10.0
- ARV discount +7.5/15.0
- DSCR +6.9/10.0
- Schools +4.1/10.0
- Livability +3.7/5.0
- Condition / age +2.5/5.0
- Rent growth +2.4/5.0
- Appreciation +0.0/10.0
$105,000
🖨 Deal sheet 📄 Offer letter ✓ Due diligence
Listing remarks
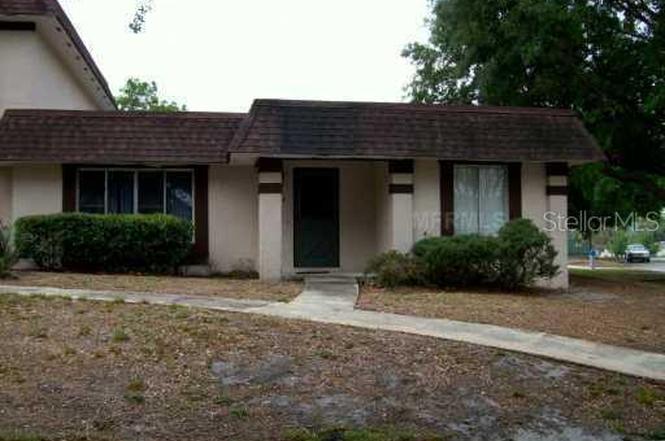
Don’t miss this rare opportunity to own a first-floor, corner/end unit in a well-maintained, small community in West Orlando! This spacious 2-bedroom, 2-bath condo features large rooms, laundry room, a HUGE 33x12 rear patio with storage, and no upstairs neighbors for added peace and privacy. Enjoy a big eat-in kitchen and breakfast bar — perfect for everyday living or entertaining. The open-concept layout includes a large great room with neutral carpet and tile. 2 car covered car port with This unit is ideal for first-time buyers, downsizers, or investors looking for a solid rental property in a prime location. Walk to nearby shopping and enjoy easy access to major highways,
Key facts
- Laundry room
- First floor
- Corner unit
Tags
Property features AI
Finance
- Other: No lease restrictions indicated; Condo land included
- Financial info: Total monthly fees: $520.44; Total annual fees: $6,245.28
- HOA & community: HOA managed by ODIN PROPERTY MANAGEMENT; Monthly association fee of $520.44 (includes pool, building maintenance, grounds maintenance, trash); Community pool; Pets allowed
Exterior
- Parking: Carport with 2 spaces
- Security: Smoke detector(s)
- Utilities: Public water; Public sewer; Cable connected; Electricity connected; Irrigation equipment
- Home design: Condominium; Residential property; Single-story; Faces north; Entry level: 1
- Construction: Block construction; Built-up roof; Shingle roof; Slab foundation; Built in 1 story
- Exterior features: Patio; Porch; Other patio/porch features; Near public transit; Paved lot; Asphalt road
Interior
- Kitchen: Dishwasher; Disposal; Range; Range hood; Refrigerator; Electric water heater
- Bedrooms: 2 bedrooms (Floor 1)
- Flooring: Carpet; Vinyl
- Bathrooms: 2 full bathrooms
- Heating & cooling: Central heating; Central air conditioning
- Interior features: Eat-in kitchen; Blinds; Attic; Great room; Inside utility; Smoke detectors
- Laundry & utility: Laundry inside
Neighborhood map
What this means for you Summary
Snapshot
- This is a 2-bed/2.0-bath condo listed at $105k.
Deal economics
- At list price, monthly cash flow is $160 ($2k/yr) — positive.
- The deal already cash-flows at list — no discount required.
- Meets the 1% rule at list price ($2k rent vs $105k).
- Recommended offer: $92k (12.0% below list) — sets the bar for market timing.
- Cap rate 8.1% vs local median 4.9% in Pine Hills — top-decile yield for the area; either an underpriced asset or a hidden risk that comps aren't pricing in. Stress-test before assuming the spread holds.
Location & tenants
- Location reads 73/100 on livability (#317 in FL) — a middle-class / working-renter tenant base. Strengths: commute A+, cost of living A+, housing A+; Watch: crime D+, employment D, amenities F.
- Orange (suburban): math 46% / reading 51% proficiency, ranked #43 of 73 in FL (top 59%) — families likely to look elsewhere, expect single-tenant / working-renter base with shorter leases.
- Market conditions: Rents soft (-0.3%/yr); 246 active listings in the ZIP; 33 comparable units currently listed for rent nearby; rentals at typical pace (median 24d on market — plan ~3-4 weeks tenant-placement turnaround); 8,053 units permitted in Orange County in 2024 (3,133 in 5+ unit buildings).
- This rent runs 40% of the median local income ($50k/yr) — at the standard rent-burdened threshold; future hikes will face affordability resistance.
Forward outlook
- Local home prices are declining (-3.0%/yr); year-one equity from $726 of loan paydown is wiped out by about $3k of value loss. Plan a longer hold.
- Orange County population projected at +52% by 2050 — long-run rental-demand tailwind backs the buy-and-hold thesis.
Negotiation context
- It's been on market 178 days — a 12% lower offer ($92k) is reasonable based on typical stale-listing flexibility.
- 8 sale attempts since 20y ago with the ask held roughly flat each time — persistent listings suggest the price (not the market) is what's stuck; bring a comps-based counter.
- Current owner paid $91k; 15% above their basis — modest negotiation headroom, anchor on the comps not their cost.
Risks & watch-outs
- Watch-outs: HOA is 31% of rent.
- Climate carrying-cost: severe wind risk, 99% chance of damaging wind over 30y; extreme-heat days projected 7→23/yr by 2055 (HVAC capex compounding) — expect insurance premiums to compound above CPI over the hold.
Questions for the listing agent
- It's been on market 178 days. Have you received any prior offers? Is the seller open to a 12% concession, seller financing, or rate buy-down credit?
- Built in 1972 — when were the roof, HVAC, electrical panel, plumbing, and water heater last replaced?
- What does the HOA fee cover, when was the last increase, and are there any pending special assessments or reserve-fund shortfalls?
- Any open or pending special assessments — roof, HVAC, plumbing, elevator, façade? What's the per-unit balance and payoff schedule, and is the seller paying it off at close or rolling it to the buyer?
- Why hasn't it sold? Are there any deal-killer items the seller is aware of (foundation, flood, title, zoning, code violations)?
- Is there a deadline driving the sale (1031 exchange, divorce, estate, relocation)? That informs how much negotiation room exists.
- Schools are B-rated — typically a magnet for longer-tenancy family renters. What's the average tenant stay here, and is there a school-zone premium baked into asking?
- Crime grade is D in this area — have there been break-ins, vandalism, or insurance claims at this property in the last 3 years? What carrier currently insures it and at what premium?
- What's the average days-on-market for RENTAL listings here right now (not sales)? A rising rental-DOM trend means longer vacancies and softer asking-rent achievability than the comps imply.
- What's the recent tenant-quality profile in this submarket — average credit score on applications, eviction rate, late-payment / NSF rate, and stable-employment percentage? A property-management company in the area should have these aggregated.
- How much new apartment / multifamily construction is in the pipeline within 1–3 miles? Heavy new supply (>2% of stock underway) typically softens rents 12–24 months out; light construction supports rent growth.
Investment metrics
- 1% rule
- 1.58% ✓
- Cap rate
- 8.12%
- Cash-on-cash
- 6.51%
- DSCR
- 1.29
- GRM
- 5.3
CMA / ARV
No comps found within radius.
Projected returns pro-forma
-3.0% appreciation · 0.0% rent growth · sell at horizon
- IRR
- -11.2%
- Equity multiple
- 0.61×
- Total profit
- $-11,419
- Equity at exit
- $15,656
- IRR
- -10.1%
- Equity multiple
- 0.51×
- Total profit
- $-14,447
- Equity at exit
- $9,078
Cash invested: $29,400 (down + closing). Projections, not guarantees.
Landlord ↔ Tenant lean methodology
- Overall (STATE)
- 87 Strongly Landlord-Friendly
- State Florida
- 87 Strongly Landlord-Friendly · R+3
- County
- — inherits STATE
- City
- — inherits STATE
ZIP-level market 32808
- Home prices YoY
- -22.6%
- Rents YoY
- -0.3%
- Active inventory
- 246
- Price-to-rent
- 5.3×
Monthly cashflow live
- Estimated rent
- $1,655 high interval (Pro) →
- Mortgage (P&I)
- −$551
- Tax from tax record
- −$33 /mo · $400/yr
- Insurance
- −$44
- HOA
- −$520
- Vacancy / Maint / Mgmt
- −$347
- Net cashflow
- $160
Break-even live
UW: 25.0% down · 7.5% · 30yr · 1.5% tax · 5.0% vac · 8.0% maint · 8.0% mgmt
Financing live
Cash to close
- Down payment
- $26,250
- Closing costs
- $3,150
- Reserves months
- —
- Total cash needed
- —
Loan-product check · same deal, 3 products live
Conventional
25% down · 7.5% · 30yr
- Down + closing
- —
- Monthly P&I
- —
- Monthly cashflow
- —
- DSCR
- —
- Eligible?
- —
Personal DTI + credit; lowest rate.
DSCR
20% down · 8.5% · 30yr
- Down + closing
- —
- Monthly P&I
- —
- Monthly cashflow
- —
- DSCR
- —
- Eligible?
- —
No personal income docs; deal must DSCR.
Hard money
10% down · 12.0% · 12mo
- Down + closing
- —
- Monthly P&I
- —
- Monthly cashflow
- —
- DSCR
- —
- Eligible?
- —
Short-term bridge; refi at stabilization.
Rent comps 33 comps
| Address | Beds | Baths | Sqft | Rent | $/sqft | DOM | Units | Dist |
|---|---|---|---|---|---|---|---|---|
| 5402 Pine Chase Dr Orlando, FL | 2.0–3.0 | 2.0 | 1133 | $1,449 | $1.28 | 1d | 4 | 0.05mi |
| 2222 Silver Pines Pl #902 Orlando, FL | 3.0 | 2.5 | 1472 | $1,500 | $1.02 | 7d | 1 | 0.08mi |
| 2203 Silver Pines Pl #601 Orlando, FL | 2.0 | 1.0 | 962 | $1,500 | $1.56 | 23d | 1 | 0.11mi |
| 5600 Silver Star Rd Orlando, FL | 1.0–3.0 | 1.0–2.0 | 850 | $1,310 | $1.54 | 14d | 6 | 0.17mi |
| 1537 Ridge Pointe Dr Orlando, FL | 3.0 | 2.0 | 1108 | $2,200 | $1.99 | 23d | 1 | 0.24mi |
| 1529 Ridge Pointe Dr Orlando, FL | 3.0 | 2.0 | 1108 | $1,995 | $1.80 | 7d | 1 | 0.26mi |
| 5505 Hernandes Dr #113 Orlando, FL | 2.0 | 1.0 | 728 | $1,175 | $1.61 | 23d | 1 | 0.37mi |
| 1214 N Pine Hills Rd Unit 2 Orlando, FL | 1.0 | 1.0 | 868 | $2,100 | $2.42 | 20d | 1 | 0.83mi |
| 5249 Champagne Cir Orlando, FL | 2.0 | 2.0 | 980 | $1,795 | $1.83 | 23d | 1 | 0.86mi |
| 2429 Sandy Ln Orlando, FL | 3.0 | 2.0 | 1418 | $2,490 | $1.76 | 21d | 1 | 0.86mi |
| 4757 Silver Star Rd Orlando, FL | 1.0 | 1.0 | 728 | $1,189 | $1.63 | 23d | 1 | 0.86mi |
| 4697 Rose Coral Dr Orlando, FL | 2.0 | 1.0 | 576 | $1,437 | $2.49 | 1d | 15 | 0.87mi |
| 4919 Erleen Pl Orlando, FL | 1.0 | 1.0 | 965 | $800 | $0.83 | 23d | 1 | 0.88mi |
| 4705 Almond Willow Dr Orlando, FL | 2.0 | 2.0 | 864 | $1,600 | $1.85 | 23d | 1 | 0.88mi |
| 2637 Healy Dr Orlando, FL | 3.0 | 1.5 | 1300 | $1,900 | $1.46 | 4d | 1 | 0.89mi |
| 3043 Willow Bend Blvd Orlando, FL | 2.0 | 2.0 | 900 | $1,450 | $1.61 | 23d | 1 | 0.89mi |
| 2920 Eastern Willow Ave Orlando, FL | 2.0 | 2.0 | 868 | $1,500 | $1.73 | 23d | 1 | 0.90mi |
| 3071 Willow Bend Blvd Orlando, FL | 2.0 | 2.0 | 900 | $1,525 | $1.69 | 23d | 1 | 0.92mi |
| 3024 N Powers Dr Orlando, FL | 1.0–2.0 | 1.0–2.0 | 915 | $1,470 | $1.61 | 16d | 80 | 0.96mi |
| 3285 Split Willow Dr Orlando, FL | 2.0 | 1.0 | 845 | $1,400 | $1.66 | 23d | 1 | 0.96mi |
| 1407 Sunridge Rd Orlando, FL | 3.0 | 2.0 | 1124 | $1,945 | $1.73 | 7d | 1 | 0.97mi |
| 4566 Chateau Rd Orlando, FL | 3.0 | 1.5 | 1377 | $1,800 | $1.31 | 23d | 1 | 0.97mi |
| 1020 barnett villas Dr Orlando, FL | 1.0–3.0 | 1.0–2.0 | 934 | $1,439 | $1.54 | 23d | 1 | 1.00mi |
| 6408 Sunshine St Orlando, FL | 3.0 | 1.5 | 1000 | $1,900 | $1.90 | 4d | 1 | 1.03mi |
| 4500 Silver Star Rd Orlando, FL | 2.0 | 2.0 | 1000 | $1,309 | $1.31 | 23d | 1 | 1.05mi |
| 6872 Alta Westgate Dr Orlando, FL | 2.0–3.0 | 2.0 | 1190 | $1,466 | $1.23 | 7d | 1 | 1.07mi |
| 6033 Balboa Dr Orlando, FL | 3.0 | 2.0 | 1269 | $2,300 | $1.81 | 21d | 1 | 1.10mi |
| 520 Hacienda Ct Pine Hills, FL | 3.0 | 1.0 | 825 | $1,850 | $2.24 | 23d | 1 | 1.24mi |
| 4306 Silver Star Rd Orlando, FL | 3.0 | 2.0 | 1080 | $1,800 | $1.67 | 23d | 1 | 1.24mi |
| 6521 Garden Spring Ct Orlando, FL | 3.0 | 2.0 | 1131 | $2,200 | $1.95 | 11d | 1 | 1.42mi |
| 6508 Spring Glade Ct Orlando, FL | 3.0 | 2.0 | 1032 | $1,325 | $1.28 | 21d | 1 | 1.43mi |
| 6517 Spring Glade Ct Orlando, FL | 3.0 | 2.0 | 1425 | $1,320 | $0.93 | 23d | 1 | 1.46mi |
| 3723 Narroline Dr Orlando, FL | 3.0 | 2.0 | 1370 | $2,000 | $1.46 | 7d | 1 | 1.48mi |
HOA detail condo
- Monthly dues
- $520 · $6,240/yr
- Assessments
- None detected in remarks — confirm with the listing agent.
Listing history 25 events
-
2026-06-04days on market $105,000 Active 178 DOM
-
2026-06-03days on market $105,000 Active 177 DOM
-
2026-06-02days on market $105,000 Active 176 DOM
-
2026-06-02days on market $105,000 Active 175 DOM
-
2026-05-31days on market $105,000 Active 174 DOM
-
2026-05-12status Active
-
2026-04-08price $105,000
-
2026-01-27status Active
-
2025-12-31historical
-
2025-10-23$110,000 Active
-
2018-10-16status Pending
-
2018-10-16historical
-
2018-10-09$45,000 Active
-
2017-05-17status Pending
-
2017-05-17historical
-
2017-05-11$45,000 Active
-
2017-02-06historical
-
2016-12-17$45,000 Active
-
2006-11-14soldstatus $91,000
-
2006-09-29soldstatus $91,000
-
2006-07-11$96,500
-
2006-07-11historical
-
2006-04-18$96,500
-
2004-07-23soldstatus $63,900
-
1976-06-01soldstatus $24,700
ⓘ Source: listings_history table (triggers on properties + properties_extension) + one-shot
backfill from property_details.listing_events for pre-trigger history.
Tax reassessment forecast FL · Resets to sale price
- Current annual tax
- $400 · $33/mo
- Projected year-2 tax
- $872 · $73/mo
- Expected delta
- +$472/yr (+$39/mo · 117.9%)
ⓘ Screening estimate from a state-policy table — verify with the county assessor before closing.
Climate risk First Street
- Flood 1/10 Low FEMA zone X (unshaded) · 0% chance over 30 yrs
- Wildfire 1/10 Low
- Heat 9/10 Extreme 7 d/yr ≥108°F today · 23 d/yr by 30 yrs out
- Wind 9/10 Extreme 99% chance of damaging wind over 30 yrs
- Air quality 1/10 Low 0 unhealthy d/yr today · 0 by 30 yrs out
Nearby sold comps map
Loading sold comps map…
Walkable amenities ~0.75 mi
Loading nearby amenities…
Taxation est. · year 1
- Rental income
- $19,857
- − Mortgage interest
- −$5,882
- − Property taxes
- −$400
- − Insurance
- −$525
- − Repairs & maintenance
- −$1,589
- − Management
- −$1,589
- − HOA
- −$6,240
- − Depreciation
- −$3,055
- Taxable income
- $579
- Est. tax owed @ 24.0%
- −$139
- After-tax cash flow
- $1,775/yr
For passive investors: Depreciation is non-cash, so a rental often shows a tax loss while cash-flowing — sheltering income. Rental losses are passive: they offset passive income freely, and up to $25,000/yr can offset ordinary (W-2) income if you actively participate and your MAGI is under $100k (phasing out to $0 by $150k); unused losses carry forward. On sale, claimed depreciation is recaptured at up to 25%, and gains may owe capital-gains tax (a 1031 exchange can defer both). Figures are a year-1 estimate at your 24.0% rate — not tax advice; consult a CPA.
Schools (NCES district)
- District
- Orange
- NCES district ID
- 1201440
- Math proficiency
- 46% ▼ -9.00%
- Reading proficiency
- 51% ▼ -2.00%
- Median HH income
- $49,350
- Composite
- 41.47/100
- National rank
- #3461
- State rank
- #43 of 73 in FL
Livability — Pine Hills
- Score
- 73/100
- State rank
- #317
- US rank
- #5362
Category grades
Schools grade is shown separately in the Schools card above.
Census & demographics
- Census place
- Pine Hills, FL
- County
- Orange County · 1,471,359 people
- City population
- 60,203
- Metro
- Orlando-Kissimmee-Sanford, FL
- Population (ZIP)
- 60,203
- Household income
- $49,700
- Rent vs Own
- Severe rent burden
- 4039.0
Population outlook (Orange County) Hauer SSP2
- Today (2025)
- 1,618,226 people
- By 2030
- 1,787,404 · +10.5%
- By 2040
- 2,125,621 · +31.4%
- By 2050
- 2,454,016 · +51.6%
- By 2075
- 3,173,711 · +96.1%
- By 2100
- 3,607,781 · +122.9%
Race, ethnicity, and origin ACS 2023
- Neighborhood character
- Predominantly Black (71%)
- Race & ethnicity
- Black 71% Hispanic / Latino 13% White 10% Two or more races 7% Asian 1%
- Hispanic origin (detail)
- Mexican 2% Puerto Rican 5% Dominican 2%
- Common ancestry
- Hispanic 20% Lithuanian 1% Scandinavian 0%
- Foreign-born
- 25% · Canada, Vietnam, Jamaica
- Languages at home
- 69% English-only · French/Haitian/Cajun 18% Spanish 11% Other Indo-European 1%
Political lean MEDSL · Orange
- 2024 margin
- D (+13.6) · D 56.1% · R 42.5% · Other 1.3%
- 2008→2024 swing
- -5.0pp toward R · 2008: 18.6pp · 2024: 13.6pp
- All cycles
- 2024: D+13.6 2020: D+23.1 2016: D+24.6 2012: D+18.2 2008: D+18.6
Not yet ingested
- Civics
- —
Market trends
- HPI YoY
- ▼ -110.15%
- Current HPI
- 376.3801
- Rent YoY
- ▼ -0.27%
- Metro
- Orlando-Kissimmee-Sanford, FL
- State GDP YoY
- ▲ 3.28%
- F500 in state
- 36
Industry mix (Fortune 500 HQ in FL)
| Industry | F500 HQs | Revenue |
|---|---|---|
| Industrial Technology | 2 | $29B |
|
||
| Insurance | 2 | $17B |
|
||
| Retail | 1 | $60B |
|
||
| Technology Distribution | 1 | $58B |
|
||
| Homebuilding | 1 | $35B |
|
||
| Technology Manufacturing | 1 | $35B |
|
||
Price history
+325.1% since first listed20 events — show timeline
- 2026-05-12 Relisted — Stellar MLS as Distributed by MLS Grid
- 2026-04-08 Price Changed $105,000 Stellar MLS as Distributed by MLS Grid
- 2026-01-27 Relisted — Stellar MLS as Distributed by MLS Grid
- 2025-12-31 Listing Removed — Stellar MLS as Distributed by MLS Grid
- 2025-10-23 Listed $110,000 Stellar MLS as Distributed by MLS Grid
- 2018-10-16 Pending — Stellar MLS as Distributed by MLS Grid
- 2018-10-16 Listing Removed — Stellar MLS as Distributed by MLS Grid
- 2018-10-09 Listed $45,000 Stellar MLS as Distributed by MLS Grid
- 2017-05-17 Pending — Stellar MLS as Distributed by MLS Grid
- 2017-05-17 Listing Removed — Stellar MLS as Distributed by MLS Grid
- 2017-05-11 Listed $45,000 Stellar MLS as Distributed by MLS Grid
- 2017-02-06 Listing Removed — Stellar MLS as Distributed by MLS Grid
- 2016-12-17 Listed $45,000 Stellar MLS as Distributed by MLS Grid
- 2006-11-14 Sold (Public Records) $91,000 Public Records
- 2006-09-29 Sold (MLS) $91,000 Stellar MLS as Distributed by MLS Grid
- 2006-07-11 Listing Removed — Stellar MLS as Distributed by MLS Grid
- 2006-07-11 Listed $96,500 Stellar MLS as Distributed by MLS Grid
- 2006-04-18 Listed $96,500 Stellar MLS as Distributed by MLS Grid
- 2004-07-23 Sold (Public Records) $63,900 Public Records
- 1976-06-01 Sold (Public Records) $24,700 Public Records
Property tax history
+4.2%/yrLatest (2025): $400 · +33.3% YoY. Source: county tax records.
Cash-flow waterfall
monthlySold comps — $/sqft
last 12 mo · ≤1 miLoading sold comps…