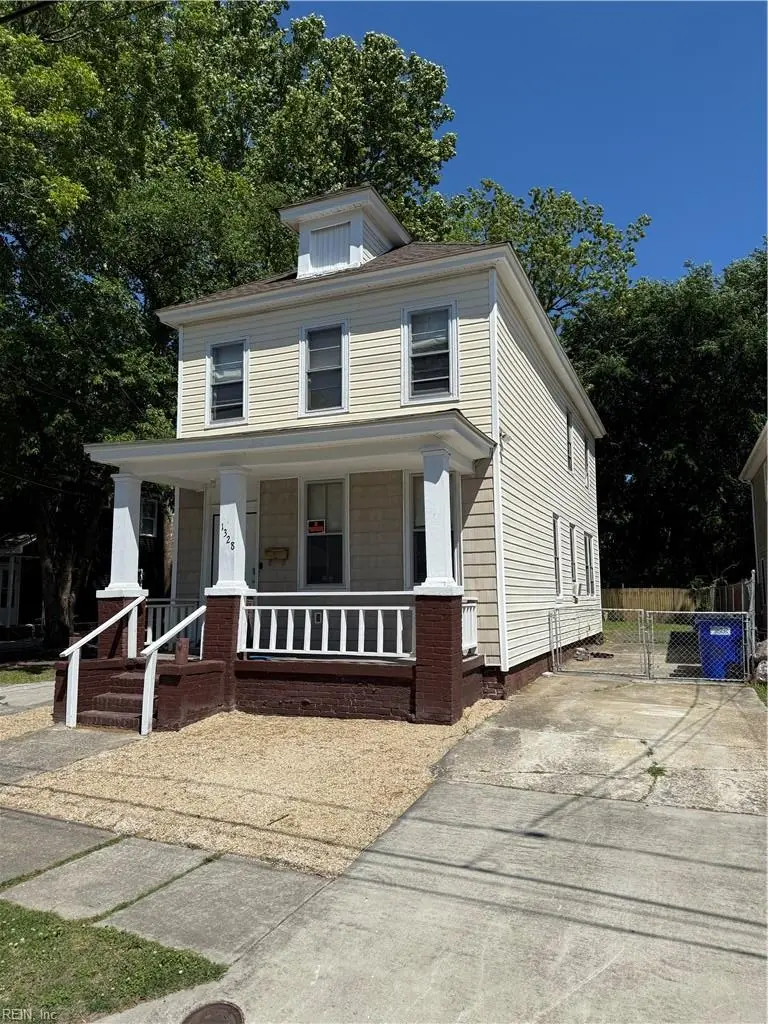
1328 Bolton St · Norfolk, VA
Flood risk 3/10 · Minor
- FEMA flood zone
- X (unshaded)
- Chance of flooding over 30 yrs
- 0.12%
- Est. flood insurance / yr
- $507 – $1,088
Fire risk 1/10 · Minimal
- Est. fire insurance / yr
- $666 – $1,236
Heat risk 9/10 · Severe
- Hot days now (above 106°F)
- 7 days/yr
- Hot days in 30 yrs
- 16 days/yr
Wind risk 8/10 · Major
- Chance of severe wind over 30 yrs
- 80.0%
Air-quality risk 3/10 · Minor
- Unhealthy air days now
- 2 days/yr
- Unhealthy air days in 30 yrs
- 5 days/yr
Risk factors via First Street. Map © Google.
Why this score? — see what drove the B+ grade
The composite is a weighted blend of 9 inputs, each scored 0–100. Each bar is that input's sub-score; the figure is the points it added to the 100-point composite (weight × sub-score).
- Cash flow +28.9/30.0
- ARV discount +15.0/15.0
- DSCR +10.0/10.0
- 1% rule +7.8/10.0
- Livability +4.2/5.0
- Rent growth +4.0/5.0
- Schools +3.5/10.0
- Condition / age +2.5/5.0
- Appreciation +0.0/10.0
$169,000
🖨 Deal sheet 📄 Offer letter ✓ Due diligence
Listing remarks
Some homes are move-in ready. Others are ready to make you money. This 4-bedroom, 2-bathroom, 2-story home in Norfolk falls firmly in the second category — and the right buyer will recognize exactly what that means. The space is there, the layout works, and with the right touch, this property has every reason to shine. Norfolk remains a strong market, and homes like this — priced for what they are today, not what they could be tomorrow — don't come around often. Come take a look with fresh eyes and an open mind. What you'll find is a home full of possibility in a city that's only moving forward. Cash or renovation loan only. Sold as-is.
Key facts
- 4,356 sq ft lot
- Built 1909
- Listed 33 days
Property features AI
Finance
- Other: Fixer upper
- HOA & community: No HOA
Exterior
- Parking: Multiple off-street parking spaces; Driveway parking
- Utilities: City/county water; City/county sewer; Electric water heater
- Home design: Detached traditional home; 2 stories; 2 living levels; Crawl foundation
- Construction: Vinyl and wood siding; Asphalt shingle roof
- Exterior features: Deck; Back chain-link fence; Has fence
Interior
- Kitchen: Gas range; Refrigerator
- Bedrooms: Master bedroom; Additional bedroom; Bedroom and full bathroom on first floor
- Flooring: Carpet; Laminate; Vinyl; Wood
- Bathrooms: 2 full bathrooms
- Heating & cooling: Floor furnace heating; Other heating; Window/wall cooling
- Interior features: Decorative fireplace; Ceiling fan; Scuttle access
- Laundry & utility: Washer hookup; Dryer hookup; Utility room
Neighborhood map
What this means for you Summary
Snapshot
- This is a 4-bed/2.0-bath single-family listed at $169k.
Deal economics
- At list price, monthly cash flow is $571 ($7k/yr) — positive.
- The deal already cash-flows at list — no discount required.
- Meets the 1% rule at list price ($2k rent vs $169k).
- Recommended offer: $164k (3.0% below list) — sets the bar for market timing.
- Cap rate 10.3% vs local median 4.0% in Norfolk — top-decile yield for the area; either an underpriced asset or a hidden risk that comps aren't pricing in. Stress-test before assuming the spread holds.
Location & tenants
- Location reads 83/100 on livability (#43 in VA, #1,026 nationally) — a professional / high-income tenant draw. Strengths: amenities A+, commute A+, health & safety A+; Watch: employment C-, crime F.
- Norfolk City Public School District (urban): math 27% / reading 56% proficiency, ranked #118 of 131 in VA (top 90%) — families likely to look elsewhere, expect single-tenant / working-renter base with shorter leases.
- Zoned schools: Jacox Elementary (math 5% / reading 20%, grade F, #1,107 of 1,108 statewide, top 100%, 568 students, 99% FRL); Booker T Washington High (math 26% / reading 70%, grade D, #303 of 319 statewide, top 95%, 947 students, 94% FRL) — zoned schools average 97% FRL vs 59% district-wide (38 pts higher); higher-poverty schools than district average — tighter screening recommended.
- Market conditions: Rents rising fast (+6.1%/yr); 120 active listings in the ZIP; 40 comparable units currently listed for rent nearby; rentals at typical pace (median 24d on market — plan ~3-4 weeks tenant-placement turnaround); lower-income renter base — watch delinquency; 438 units permitted in Norfolk city in 2024 (273 in 5+ unit buildings).
- At $2,165/mo this rent would consume 58% of the median local household income ($45k/yr) (locally 1531% of renters already pay >50% of income on rent) — very limited rent-growth headroom before tenants either downsize or default.
Forward outlook
- Local home prices are declining (-3.0%/yr); year-one equity from $1k of loan paydown is wiped out by about $5k of value loss. Plan a longer hold.
- At projected returns (-3.0% appreciation + 6.1% rent growth), your $47k cash investment doubles in ~7 years — after that, you're playing with house money.
Negotiation context
- It's been on market 33 days — a 3% lower offer ($164k) is reasonable based on typical stale-listing flexibility.
- Current owner paid $75k; list at $169k implies a 125% gain — meaningful room to come down on a strong offer.
Risks & watch-outs
- Watch-outs: built in 1909 — expect roof / HVAC / electrical / plumbing capex.
- Climate carrying-cost: severe wind risk, 80% chance of damaging wind over 30y; extreme-heat days projected 7→16/yr by 2055 (HVAC capex compounding) — expect insurance premiums to compound above CPI over the hold.
Questions for the listing agent
- It's been on market 33 days. Have you received any prior offers? Is the seller open to a 3% concession, seller financing, or rate buy-down credit?
- Built in 1909 — when were the roof, HVAC, electrical panel, plumbing, and water heater last replaced?
- Is there a deadline driving the sale (1031 exchange, divorce, estate, relocation)? That informs how much negotiation room exists.
- Schools are A-rated — typically a magnet for longer-tenancy family renters. What's the average tenant stay here, and is there a school-zone premium baked into asking?
- Crime grade is F in this area — have there been break-ins, vandalism, or insurance claims at this property in the last 3 years? What carrier currently insures it and at what premium?
- What's the average days-on-market for RENTAL listings here right now (not sales)? A rising rental-DOM trend means longer vacancies and softer asking-rent achievability than the comps imply.
- What's the recent tenant-quality profile in this submarket — average credit score on applications, eviction rate, late-payment / NSF rate, and stable-employment percentage? A property-management company in the area should have these aggregated.
- How much new for-sale + rental construction is in the pipeline within 1–3 miles? Heavy new supply typically softens prices + rents 12–24 months out; constrained supply supports both.
Investment metrics
- 1% rule
- 1.28% ✓
- Cap rate
- 10.35%
- Cash-on-cash
- 14.47%
- DSCR
- 1.64
- GRM
- 6.5
CMA / ARV
- ARV (on-the-fly)
- $304,554
- Comps found
- 12
Show comp detail 12 sales within ~0.75 mi
| Address | Dist | Beds/Ba | Sqft | Sold | Price | $/sf | Match |
|---|---|---|---|---|---|---|---|
| 823 Lexington St | 0.38mi | 4/2.5 | 1,616 (+2%) | 2mo | $300,000 | $186 | 75 |
| 942 Sutton St | 0.42mi | 4/3.0 | 1,552 (-2%) | 3mo | $299,000 | $193 | 71 |
| 896 A Ave | 0.44mi | 3/2.5 (-1) | 1,589 (+1%) | 4mo | $266,500 | $168 | 68 |
| 1815 Tidewater Dr | 0.31mi | 3/2.5 (-1) | 1,666 (+6%) | 1mo | $285,000 | $171 | 68 |
| 2216 Courtney Ave | 0.29mi | 3/2.5 (-1) | 1,500 (-5%) | 4mo | $340,000 | $227 | 68 |
| 1891 Barre St | 0.54mi | 4/3.0 | 1,520 (-4%) | 1mo | $325,000 | $214 | 64 |
| 1019 Tunstall Ave | 0.57mi | 4/2.5 | 1,518 (-4%) | 2mo | $186,000 | $123 | 63 |
| 714 Fremont St | 0.51mi | 3/2.5 (-1) | 1,520 (-4%) | 2mo | $295,000 | $194 | 61 |
| 912 Lindenwood Ave | 0.66mi | 3/2.5 (-1) | 1,628 (+3%) | 2mo | $301,500 | $185 | 55 |
| 822 Pollard St | 0.67mi | 3/2.0 (-1) | 1,494 (-5%) | 0mo | $290,600 | $195 | 54 |
| 738 Fremont St | 0.49mi | 3/2.5 (-1) | 1,780 (+13%) | 0mo | $315,000 | $177 | 49 |
| 1020 Mapole Ave | 0.69mi | 3/3.0 (-1) | 1,431 (-9%) | 1mo | $295,000 | $206 | 42 |
Match score weights: distance 35% · size 25% · config 20% · recency 20%. Top-matched comps best support the ARV.
Projected returns pro-forma
-3.0% appreciation · 6.12% rent growth · sell at horizon
- IRR
- 8.3%
- Equity multiple
- 1.34×
- Total profit
- $15,990
- Equity at exit
- $25,198
- IRR
- 20.0%
- Equity multiple
- 2.93×
- Total profit
- $91,455
- Equity at exit
- $14,612
Cash invested: $47,320 (down + closing). Projections, not guarantees.
Landlord ↔ Tenant lean methodology
- Overall (STATE)
- 55 Moderately Landlord-Leaning
- State Virginia
- 55 Moderately Landlord-Leaning · D+2
- County
- — inherits STATE
- City
- — inherits STATE
ZIP-level market 23504
- Home prices YoY
- -6.2%
- Rents YoY
- 6.1%
- Active inventory
- 120
- Price-to-rent
- 6.5×
Monthly cashflow live
- Estimated rent
- $2,165 high interval (Pro) →
- Mortgage (P&I)
- −$886
- Tax from tax record
- −$183 /mo · $2,192/yr
- Insurance
- −$70
- HOA
- −$0
- Vacancy / Maint / Mgmt
- −$455
- Net cashflow
- $571
Break-even live
UW: 25.0% down · 7.5% · 30yr · 1.5% tax · 5.0% vac · 8.0% maint · 8.0% mgmt
Financing live
Cash to close
- Down payment
- $42,250
- Closing costs
- $5,070
- Reserves months
- —
- Total cash needed
- —
Loan-product check · same deal, 3 products live
Conventional
25% down · 7.5% · 30yr
- Down + closing
- —
- Monthly P&I
- —
- Monthly cashflow
- —
- DSCR
- —
- Eligible?
- —
Personal DTI + credit; lowest rate.
DSCR
20% down · 8.5% · 30yr
- Down + closing
- —
- Monthly P&I
- —
- Monthly cashflow
- —
- DSCR
- —
- Eligible?
- —
No personal income docs; deal must DSCR.
Hard money
10% down · 12.0% · 12mo
- Down + closing
- —
- Monthly P&I
- —
- Monthly cashflow
- —
- DSCR
- —
- Eligible?
- —
Short-term bridge; refi at stabilization.
Rent comps 40 comps
| Address | Beds | Baths | Sqft | Rent | $/sqft | DOM | Units | Dist |
|---|---|---|---|---|---|---|---|---|
| 1449 Proescher St Norfolk, VA | 3.0 | 1.5 | 1400 | $1,550 | $1.11 | 23d | 1 | 0.22mi |
| 830 Lexington St Norfolk, VA | 3.0 | 2.5 | 1804 | $1,950 | $1.08 | 43d | 1 | 0.36mi |
| 1403 Lead St Norfolk, VA | 4.0 | 2.5 | 1854 | $2,550 | $1.38 | 43d | 1 | 0.42mi |
| 766 A Ave Norfolk, VA | 5.0 | 2.0 | 1544 | $1,400 | $0.91 | 43d | 1 | 0.46mi |
| 764 B Ave Norfolk, VA | 3.0 | 2.5 | 1380 | $1,795 | $1.30 | 20d | 1 | 0.51mi |
| 907 Rugby St Norfolk, VA | 3.0 | 2.0 | 1515 | $2,200 | $1.45 | 43d | 1 | 0.58mi |
| 881 Rugby St Norfolk, VA | 3.0 | 2.0 | 1600 | $2,650 | $1.66 | 23d | 1 | 0.61mi |
| 2529 Tidewater Dr Norfolk, VA | 3.0 | 2.5 | 2025 | $2,370 | $1.17 | 23d | 1 | 0.61mi |
| 820 Maltby Cres Norfolk, VA | 3.0 | 2.5 | 1850 | $2,395 | $1.29 | 23d | 1 | 0.61mi |
| 645 Church St Norfolk, VA | 1.0–3.0 | 1.0–2.0 | 881 | $1,845 | $2.09 | 7d | 1 | 0.69mi |
| 1022 Kenton Ave Norfolk, VA | 3.0 | 2.0 | 1400 | $2,400 | $1.71 | 10d | 1 | 0.75mi |
| 2605 Bapaume Ave Norfolk, VA | 3.0 | 2.0 | 2004 | $2,295 | $1.15 | 43d | 1 | 0.76mi |
| 2660 Chesapeake Blvd Norfolk, VA | 3.0 | 2.0 | 1375 | $2,100 | $1.53 | 17d | 1 | 0.89mi |
| 2729 Somme Ave Norfolk, VA | 3.0 | 2.5 | 1524 | $2,295 | $1.51 | 14d | 1 | 0.90mi |
| 2700 Myrtle Ave Norfolk, VA | 3.0 | 3.0 | 1888 | $2,600 | $1.38 | 43d | 1 | 0.91mi |
| 2914 Peronne Ave Norfolk, VA | 4.0 | 2.0 | 1764 | $2,495 | $1.41 | 23d | 1 | 1.11mi |
| 1801 Saint Denis Ave Unit 3 Norfolk, VA | 4.0 | 2.0 | 1500 | $2,400 | $1.60 | 23d | 1 | 1.13mi |
| 2531 Vincent Ave Norfolk, VA | 3.0 | 2.0 | 1600 | $2,195 | $1.37 | 43d | 1 | 1.15mi |
| 720 Forbes St Norfolk, VA | 3.0 | 2.0 | 1056 | $2,195 | $2.08 | 14d | 1 | 1.19mi |
| 720 Forbes St Norfolk, VA | 3.0 | 2.0 | 1056 | $2,250 | $2.13 | 43d | 1 | 1.19mi |
| 2815 Keller Ave Norfolk, VA | 3.0 | 2.0 | 1210 | $2,250 | $1.86 | 4d | 1 | 1.26mi |
| 1714 Bellevue Ave Norfolk, VA | 3.0 | 1.5 | 1500 | $1,799 | $1.20 | 43d | 1 | 1.27mi |
| 817 Botetourt Gdns Norfolk, VA | 3.0 | 2.5 | 1900 | $3,150 | $1.66 | 14d | 1 | 1.28mi |
| 200 College Pl Norfolk, VA | 1.0–3.0 | 1.0–2.0 | 1047 | $2,533 | $2.42 | 2d | 12 | 1.32mi |
| 2808 Westminster Ave Norfolk, VA | 4.0 | 2.0 | 1988 | $2,295 | $1.15 | 23d | 1 | 1.33mi |
| 1009 Colonial Ave #3 Norfolk, VA | 3.0 | 2.0 | 1276 | $2,400 | $1.88 | 23d | 1 | 1.35mi |
| 819 Colonial Ave Norfolk, VA | 1.0–3.0 | 1.0–2.0 | 1092 | $2,450 | $2.24 | 2d | 11 | 1.37mi |
| 2624 Chesterfield Blvd Norfolk, VA | 4.0 | 1.5 | 1512 | $2,000 | $1.32 | 43d | 1 | 1.37mi |
| 321 E Main St Norfolk, VA | 3.0 | 1.0–2.0 | 1147 | $4,929 | $4.30 | 2d | 15 | 1.39mi |
| 1801 Lasalle Ave Norfolk, VA | 3.0 | 1.0 | 1102 | $1,880 | $1.71 | 44d | 1 | 1.39mi |
| 417 W 27th St Unit F Norfolk, VA | 3.0 | 2.0 | 1200 | $1,600 | $1.33 | 14d | 1 | 1.39mi |
| 417 W 27th St Unit F Norfolk, VA | 3.0 | 2.0 | 1200 | $1,600 | $1.33 | 21d | 1 | 1.39mi |
| 3126 Marne Ave Norfolk, VA | 5.0 | 2.0 | 1943 | $3,000 | $1.54 | 43d | 1 | 1.41mi |
| 2841 Earlscourt Ave Norfolk, VA | 4.0 | 2.0 | 1404 | $2,000 | $1.42 | 2d | 1 | 1.41mi |
| 2841 Earlscourt Ave Norfolk, VA | 4.0 | 2.0 | 1404 | $2,000 | $1.42 | 3d | 1 | 1.41mi |
| 1751 Fontainebleau Cres Norfolk, VA | 3.0 | 2.0 | 1231 | $2,350 | $1.91 | 43d | 1 | 1.44mi |
| 2806 Kimball Ter Norfolk, VA | 3.0 | 2.5 | 1700 | $2,100 | $1.24 | 44d | 1 | 1.44mi |
| 325 W 31st St Unit 6 Norfolk, VA | 3.0 | 1.0 | 1400 | $1,750 | $1.25 | 23d | 1 | 1.44mi |
| 410 W 29th St Norfolk, VA | 4.0 | 2.0 | 2001 | $2,500 | $1.25 | 14d | 1 | 1.44mi |
| 400 W 30th St Norfolk, VA | 3.0 | 1.5 | 1120 | $1,985 | $1.77 | 43d | 1 | 1.44mi |
Listing history 14 events
-
2026-06-18days on market $169,000 Active 33 DOM
-
2026-06-17days on market $169,000 Active 32 DOM
-
2026-06-16days on market $169,000 Active 31 DOM
-
2026-06-15days on market $169,000 Active 30 DOM
-
2026-06-13days on market $169,000 Active 28 DOM
-
2026-06-09days on market $169,000 Active 24 DOM
-
2026-06-08days on market $169,000 Active 23 DOM
-
2026-06-07days on market $169,000 Active 22 DOM
-
2026-06-03days on market $169,000 Active 18 DOM
-
2026-06-02days on market $169,000 Active 17 DOM
-
2026-06-01days on market $169,000 Active 16 DOM
-
2026-05-31days on market $169,000 Active 15 DOM
-
2026-05-16$169,000 Active
-
2023-02-15soldstatus $75,000
ⓘ Source: listings_history table (triggers on properties + properties_extension) + one-shot
backfill from property_details.listing_events for pre-trigger history.
Tax reassessment forecast VA · Resets to sale price
- Current annual tax
- $2,192 · $183/mo
- Projected year-2 tax
- $2,192 · $183/mo
- Expected delta
- $0/yr ($0/mo · 0.0%)
ⓘ Screening estimate from a state-policy table — verify with the county assessor before closing.
Climate risk First Street
- Flood 3/10 Moderate FEMA zone X (unshaded) · 12% chance over 30 yrs
- Wildfire 1/10 Low
- Heat 9/10 Extreme 7 d/yr ≥106°F today · 16 d/yr by 30 yrs out
- Wind 8/10 Severe 80% chance of damaging wind over 30 yrs
- Air quality 3/10 Moderate 2 unhealthy d/yr today · 5 by 30 yrs out
Nearby sold comps map
Loading sold comps map…
Walkable amenities ~0.75 mi
Loading nearby amenities…
Taxation est. · year 1
- Rental income
- $25,976
- − Mortgage interest
- −$9,467
- − Property taxes
- −$2,192
- − Insurance
- −$845
- − Repairs & maintenance
- −$2,078
- − Management
- −$2,078
- − Depreciation
- −$4,916
- Taxable income
- $4,400
- Est. tax owed @ 24.0%
- −$1,056
- After-tax cash flow
- $5,793/yr
For passive investors: Depreciation is non-cash, so a rental often shows a tax loss while cash-flowing — sheltering income. Rental losses are passive: they offset passive income freely, and up to $25,000/yr can offset ordinary (W-2) income if you actively participate and your MAGI is under $100k (phasing out to $0 by $150k); unused losses carry forward. On sale, claimed depreciation is recaptured at up to 25%, and gains may owe capital-gains tax (a 1031 exchange can defer both). Figures are a year-1 estimate at your 24.0% rate — not tax advice; consult a CPA.
Schools (NCES district)
- District
- Norfolk City Public School District
- NCES district ID
- 5102670
- Math proficiency
- 27% ▼ -44.00%
- Reading proficiency
- 56% ▼ -10.00%
- Median HH income
- $44,358
- Composite
- 35.08/100
- National rank
- #5026
- State rank
- #118 of 131 in VA
Livability — Norfolk
- Score
- 83/100
- State rank
- #43
- US rank
- #1026
Category grades
Schools grade is shown separately in the Schools card above.
Census & demographics
- Census place
- Norfolk, VA
- County
- Norfolk City · 214,042 people
- City population
- 214,042
- Metro
- Virginia Beach-Norfolk-Newport News, VA-NC
- Population (ZIP)
- 23,502
- Household income
- $44,659
- Rent vs Own
- Severe rent burden
- 1531.0
Population outlook (Norfolk County) Hauer SSP2
- Today (2025)
- 249,032 people
- By 2030
- 252,347 · +1.3%
- By 2040
- 253,644 · +1.9%
- By 2050
- 251,913 · +1.2%
- By 2075
- 245,281 · -1.5%
- By 2100
- 219,548 · -11.8%
Race, ethnicity, and origin ACS 2023
- Neighborhood character
- Predominantly Black (78%)
- Race & ethnicity
- Black 78% White 12% Two or more races 5% Hispanic / Latino 3%
- Common ancestry
- Lithuanian 1% Slovak 1%
- Foreign-born
- 3% · Canada
- Languages at home
- 94% English-only · Spanish 4% French/Haitian/Cajun 1%
Political lean MEDSL · Norfolk
- 2024 margin
- Solid D (+41.5) · D 70.0% · R 28.5% · Other 1.6%
- 2008→2024 swing
- -1.4pp toward R · 2008: 43.0pp · 2024: 41.5pp
- All cycles
- 2024: D+41.5 2020: D+45.6 2016: D+42.0 2012: D+44.0 2008: D+43.0
Not yet ingested
- Civics
- —
Market trends
- HPI YoY
- ▼ -21.60%
- Current HPI
- 327.2374
- Rent YoY
- ▲ 6.12%
- Metro
- Virginia Beach-Norfolk-Newport News, VA-NC
- State GDP YoY
- ▲ 2.40%
- F500 in state
- 50
Industry mix (Fortune 500 HQ in VA)
| Industry | F500 HQs | Revenue |
|---|---|---|
| Aerospace / Defense | 4 | $236B |
|
||
| Technology / Defense | 3 | $32B |
|
||
| Financial Services | 2 | $176B |
|
||
| Utilities | 2 | $27B |
|
||
| Insurance | 2 | $25B |
|
||
| Technology | 2 | $15B |
|
||
Price history
+125.3% since first listed2 events — show timeline
- 2026-05-16 Listed $169,000 REINMLS
- 2023-02-15 Sold (Public Records) $75,000 Public Records
Property tax history
+6.4%/yrLatest (2025): $2,192 · +6.1% YoY. Source: county tax records.
Cash-flow waterfall
monthlySold comps — $/sqft
last 12 mo · ≤1 miLoading sold comps…