131 Silver Ln · Brookfield, MO
Flood risk 1/10 · Minimal
- FEMA flood zone
- X (unshaded)
- Chance of flooding over 30 yrs
- 0.0%
- Est. flood insurance / yr
- $507 – $1,088
Fire risk 3/10 · Minor
- Est. fire insurance / yr
- $1,054 – $1,958
Heat risk 3/10 · Minor
- Hot days now (above 106°F)
- 7 days/yr
- Hot days in 30 yrs
- 16 days/yr
Wind risk 2/10 · Minimal
- Chance of severe wind over 30 yrs
- —
Air-quality risk 1/10 · Minimal
- Unhealthy air days now
- 0 days/yr
- Unhealthy air days in 30 yrs
- 0 days/yr
Risk factors via First Street. Map © Google.
Why this score? — see what drove the D grade
The composite is a weighted blend of 9 inputs, each scored 0–100. Each bar is that input's sub-score; the figure is the points it added to the 100-point composite (weight × sub-score).
- Cash flow +9.8/30.0
- ARV discount +7.5/15.0
- Appreciation +6.5/10.0
- Schools +4.2/10.0
- Livability +3.2/5.0
- DSCR +2.8/10.0
- Rent growth +2.5/5.0
- Condition / age +2.5/5.0
- 1% rule +1.8/10.0
$149,500
🖨 Deal sheet (PDF) 📄 Offer letter ✓ Due diligence
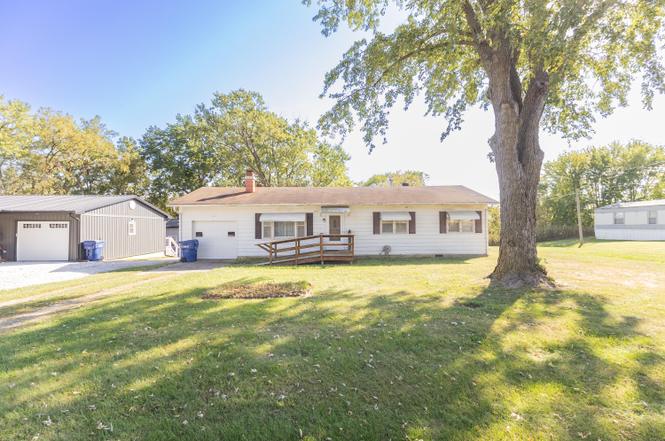
Listing remarks
Welcome to this charming one-owner home in Brookfield, MO! This 3-bedroom, 1-bath residence sits on a beautiful . 51-acre lot that gives you the peaceful feel of the country--right in town. The spacious backyard is perfect for relaxing, entertaining, or enjoying the quiet outdoors. A 26x24 two-car detached garage with workbenches offers plenty of space for projects and storage, and there's also a small storage shed for your lawn tools or seasonal items. Well cared for and full of potential, this property is ready for its next chapter.
Key facts
- Spacious backyard
- Small storage shed
- 0.52 acre lot
Tags
Neighborhood map
What this means for you Summary
Snapshot
- This is a 3-bed/1.0-bath single-family listed at $150k.
Deal economics
- At list price, monthly cash flow is $-95 ($-1k/yr) — negative.
- To cash-flow at today's rent, offer at most $133k (11.2% below list).
- To meet the 1% rule (rent ≥ 1% of price), the offer needs to be $102k (32.1% below list).
- Recommended offer: $102k (32.1% below list) — sets the bar for 1% rule.
Location & tenants
- Location reads 65/100 on livability (#278 in MO) — a middle-class / working-renter tenant base. Strengths: crime A+, cost of living A+, housing A+; Watch: employment D+, schools D, amenities F.
- Brookfield R-III (rural): math 46% / reading 55% proficiency, ranked #45 of 324 in MO (top 14%) — acceptable for families but not a draw, mixed tenant base, ~2y average lease.
- Market conditions: 42 active listings in the ZIP; 4 units permitted in Linn County in 2024 (0 in 5+ unit buildings).
Forward outlook
- In year one you build about $5k of equity ($1k loan paydown + $4k appreciation (2.9% local appreciation)).
- Linn County population projected at -21% by 2050 — secular population decline; favor cash flow + early exit over multi-decade hold.
- By year 7, paydown + projected appreciation supports a ~$34k cash-out refi (75% LTV) — recoverable capital for the next deal without selling this one.
Negotiation context
- It's been on market 174 days — a 12% lower offer ($132k) is reasonable based on typical stale-listing flexibility.
- 2 sale attempts; this cycle's ask has dropped $10k (7%) from the opening price — seller is motivated, your offer sets the floor, not the list.
Questions for the listing agent
- What do current leases actually rent for vs. the listed asking? Can we see a recent rent roll and the last 12 months of T-12 income?
- It's been on market 174 days. Have you received any prior offers? Is the seller open to a 32% concession, seller financing, or rate buy-down credit?
- Built in 1960 — when were the roof, HVAC, electrical panel, plumbing, and water heater last replaced?
- Why hasn't it sold? Are there any deal-killer items the seller is aware of (foundation, flood, title, zoning, code violations)?
- Is there a deadline driving the sale (1031 exchange, divorce, estate, relocation)? That informs how much negotiation room exists.
- Schools are D-rated, which usually means shorter tenancies and higher turnover. Who's the typical renter profile here, and what's been the actual vacancy rate?
- The area grade is low — what's the realistic commute time and amenity access for the typical tenant pool here? Any planned neighborhood developments (good or bad) we should know about?
- What's the average days-on-market for RENTAL listings here right now (not sales)? A rising rental-DOM trend means longer vacancies and softer asking-rent achievability than the comps imply.
- What's the recent tenant-quality profile in this submarket — average credit score on applications, eviction rate, late-payment / NSF rate, and stable-employment percentage? A property-management company in the area should have these aggregated.
- How much new for-sale + rental construction is in the pipeline within 1–3 miles? Heavy new supply typically softens prices + rents 12–24 months out; constrained supply supports both.
Investment metrics
- 1% rule
- 0.68% ✗
- Cap rate
- 5.53%
- Cash-on-cash
- -2.73%
- DSCR
- 0.88
- GRM
- 12.3
CMA / ARV
- ARV (on-the-fly)
- $40,062
- Comps found
- 1
Show comp detail 1 sale within ~0.75 mi
| Address | Dist | Beds/Ba | Sqft | Sold | Price | $/sf | Match |
|---|---|---|---|---|---|---|---|
| 215 Market St | 0.53mi | 2/1.0 (-1) | 1,067 (-12%) | 10mo | $34,900 | $33 | 42 |
Match score weights: distance 35% · size 25% · config 20% · recency 20%. Top-matched comps best support the ARV.
Projected returns pro-forma
2.91% appreciation · 3.0% rent growth · sell at horizon
- IRR
- 4.7%
- Equity multiple
- 1.27×
- Total profit
- $11,139
- Equity at exit
- $66,427
- IRR
- 7.8%
- Equity multiple
- 2.17×
- Total profit
- $49,001
- Equity at exit
- $101,759
Cash invested: $41,860 (down + closing). Projections, not guarantees.
Landlord ↔ Tenant lean methodology
- Overall (STATE)
- 81 Strongly Landlord-Friendly
- State Missouri
- 81 Strongly Landlord-Friendly · R+10
- County
- — inherits STATE
- City
- — inherits STATE
ZIP-level market 64628
- Home prices YoY
- 1.3%
- Active inventory
- 42
- Price-to-rent
- 12.3×
Monthly cashflow live
- Estimated rent
- $1,015 medium interval (Pro) →
- Mortgage (P&I)
- −$784
- Tax from tax record
- −$51 /mo · $612/yr
- Insurance
- −$62
- HOA
- −$0
- Vacancy / Maint / Mgmt
- −$213
- Net cashflow
- $-95
Break-even live
Sensitivity live
| Price | -10% $-10 | -5% $-53 | +0% $-95 | +5% $-137 | +10% $-180 |
|---|---|---|---|---|---|
| Rent | -10% $-175 | -5% $-135 | +0% $-95 | +5% $-55 | +10% $-15 |
| Rate | -1.0pp $-20 | -0.5pp $-57 | base $-95 | +0.5pp $-134 | +1.0pp $-173 |
UW: 25.0% down · 7.5% · 30yr · 1.5% tax · 5.0% vac · 8.0% maint · 8.0% mgmt
Financing live
Cash to close
- Down payment
- $37,375
- Closing costs
- $4,485
- Reserves months
- —
- Total cash needed
- —
Loan-product check · same deal, 3 products live
Conventional
25% down · 7.5% · 30yr
- Down + closing
- —
- Monthly P&I
- —
- Monthly cashflow
- —
- DSCR
- —
- Eligible?
- —
Personal DTI + credit; lowest rate.
DSCR
20% down · 8.5% · 30yr
- Down + closing
- —
- Monthly P&I
- —
- Monthly cashflow
- —
- DSCR
- —
- Eligible?
- —
No personal income docs; deal must DSCR.
Hard money
10% down · 12.0% · 12mo
- Down + closing
- —
- Monthly P&I
- —
- Monthly cashflow
- —
- DSCR
- —
- Eligible?
- —
Short-term bridge; refi at stabilization.
Listing history 6 events
-
2026-04-27status Pending
-
2026-01-12status Active
-
2025-11-10price $149,500
-
2025-10-09$160,000 Active
-
2001-07-23soldstatus
-
1959-08-27soldstatus
ⓘ Source: listings_history table (triggers on properties + properties_extension) + one-shot
backfill from property_details.listing_events for pre-trigger history.
Tax reassessment forecast MO · Resets to sale price
- Current annual tax
- $612 · $51/mo
- Projected year-2 tax
- $1,450 · $121/mo
- Expected delta
- +$838/yr (+$70/mo · 136.8%)
ⓘ Screening estimate from a state-policy table — verify with the county assessor before closing.
Climate risk First Street
- Flood 1/10 Low FEMA zone X (unshaded) · 0% chance over 30 yrs
- Wildfire 3/10 Moderate
- Heat 3/10 Moderate 7 d/yr ≥106°F today · 16 d/yr by 30 yrs out
- Wind 2/10 Low
- Air quality 1/10 Low 0 unhealthy d/yr today · 0 by 30 yrs out
Nearby sold comps map
Loading sold comps map…
Walkable amenities ~0.75 mi
Loading nearby amenities…
Taxation est. · year 1
- Rental income
- $12,186
- − Mortgage interest
- −$8,374
- − Property taxes
- −$612
- − Insurance
- −$748
- − Repairs & maintenance
- −$975
- − Management
- −$975
- − Depreciation
- −$4,349
- Taxable loss
- −$3,847
- Est. tax savings @ 24.0%
- +$923
- After-tax cash flow
- $-218/yr
For passive investors: Depreciation is non-cash, so a rental often shows a tax loss while cash-flowing — sheltering income. Rental losses are passive: they offset passive income freely, and up to $25,000/yr can offset ordinary (W-2) income if you actively participate and your MAGI is under $100k (phasing out to $0 by $150k); unused losses carry forward. On sale, claimed depreciation is recaptured at up to 25%, and gains may owe capital-gains tax (a 1031 exchange can defer both). Figures are a year-1 estimate at your 24.0% rate — not tax advice; consult a CPA.
Schools (NCES district)
- District
- Brookfield R-III
- NCES district ID
- 2905940
- Math proficiency
- 46% ▼ -1.00%
- Reading proficiency
- 55% ▲ 4.00%
- Median HH income
- $37,022
- Composite
- 41.93/100
- National rank
- #3355
- State rank
- #45 of 324 in MO
Livability — Brookfield
- Score
- 65/100
- State rank
- #278
- US rank
- #13057
Category grades
Schools grade is shown separately in the Schools card above.
Census & demographics
- Census place
- Brookfield, MO
- Population (ZIP)
- 5,602
Population outlook (Linn County) Hauer SSP2
- Today (2025)
- 11,437 people
- By 2030
- 10,946 · -4.3%
- By 2040
- 9,969 · -12.8%
- By 2050
- 9,056 · -20.8%
- By 2075
- 7,342 · -35.8%
- By 2100
- 5,656 · -50.5%
Race, ethnicity, and origin ACS 2023
- Neighborhood character
- Predominantly White (93%)
- Race & ethnicity
- White 93% Two or more races 4% Hispanic / Latino 3%
- Common ancestry
- Lithuanian 2% Serbian 1% Italian 1%
- Foreign-born
- 1% · Canada
Political lean MEDSL · Linn
- 2024 margin
- Solid R (+57.2) · D 20.8% · R 78.1% · Other 1.1%
- 2008→2024 swing
- -48.8pp toward R · 2008: -8.5pp · 2024: -57.2pp
- All cycles
- 2024: R+57.2 2020: R+53.9 2016: R+51.1 2012: R+23.5 2008: R+8.5
Not yet ingested
- Civics
- —
Market trends
- HPI YoY
- ▲ 2.91%
- Current HPI
- 219.7856
- Rent YoY
- —
- Metro
- —
- State GDP YoY
- ▲ 1.84%
- F500 in state
- 20
Industry mix (Fortune 500 HQ in MO)
| Industry | F500 HQs | Revenue |
|---|---|---|
| Healthcare | 1 | $163B |
|
||
| Insurance | 1 | $21B |
|
||
| Industrial Technology | 1 | $17B |
|
||
| Retail | 1 | $16B |
|
||
| Industrial Distribution | 1 | $10B |
|
||
| Utilities | 1 | $9B |
|
||
Price history
-6.6% since first listed6 events — show timeline
- 2026-04-27 Pending — RCBR
- 2026-01-12 Relisted — RCBR
- 2025-11-10 Price Changed $149,500 RCBR
- 2025-10-09 Listed $160,000 RCBR
- 2001-07-23 Sold (Public Records) — Public Records
- 1959-08-27 Sold (Public Records) — Public Records
Property tax history
+1.0%/yrLatest (2025): $612 · +4.4% YoY. Source: county tax records.
Cash-flow waterfall
monthlySold comps — $/sqft
last 12 mo · ≤1 miLoading sold comps…