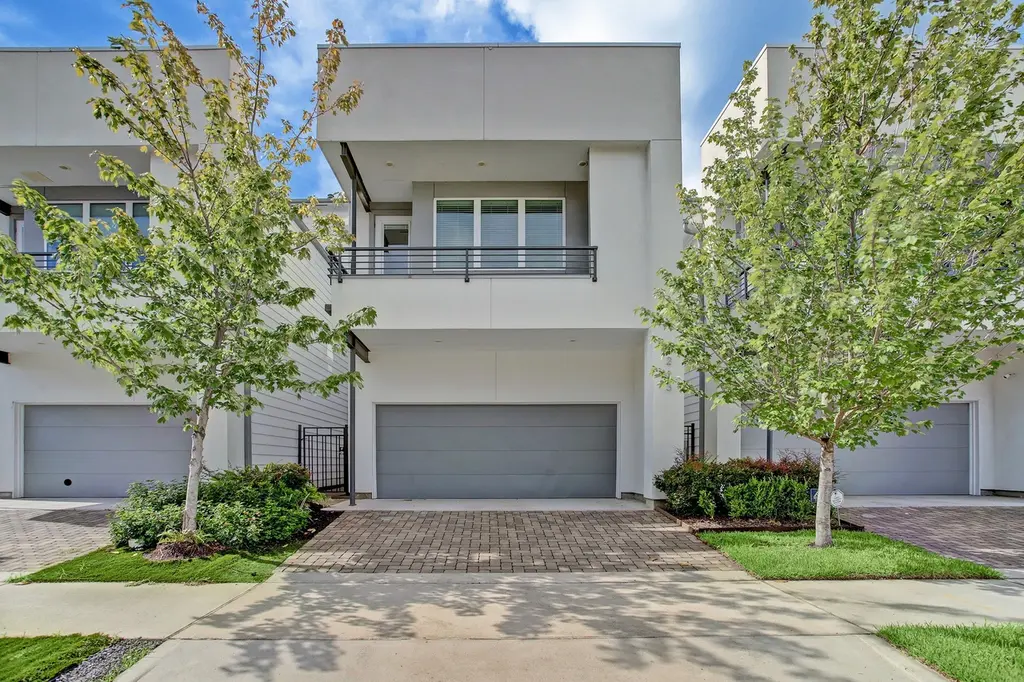
1213 Crockett St · Houston, TX
Flood risk 5/10 · Moderate
- FEMA flood zone
- X (shaded)
- Chance of flooding over 30 yrs
- 0.24%
- Est. flood insurance / yr
- $507 – $1,088
Fire risk 1/10 · Minimal
- Est. fire insurance / yr
- $1,222 – $2,270
Heat risk 9/10 · Severe
- Hot days now (above 109°F)
- 7 days/yr
- Hot days in 30 yrs
- 23 days/yr
Wind risk 9/10 · Severe
- Chance of severe wind over 30 yrs
- 99.0%
Air-quality risk 3/10 · Minor
- Unhealthy air days now
- 2 days/yr
- Unhealthy air days in 30 yrs
- 3 days/yr
Risk factors via First Street. Map © Google.
Why this score? — see what drove the D+ grade
The composite is a weighted blend of 9 inputs, each scored 0–100. Each bar is that input's sub-score; the figure is the points it added to the 100-point composite (weight × sub-score).
- Cash flow +19.8/30.0
- 1% rule +6.4/10.0
- DSCR +6.3/10.0
- ARV discount +4.1/15.0
- Livability +3.7/5.0
- Schools +2.7/10.0
- Condition / age +2.5/5.0
- Rent growth +2.3/5.0
- Appreciation +0.0/10.0
$549,000
🖨 Deal sheet (PDF) 📄 Offer letter ✓ Due diligence
Listing remarks
PRICED BELOW MARKET VALUE- PRICED TO SELL! Welcome to 1213 Crockett Street, a modern style 4 bedroom, 4.5 bath home in the heart of Houston’s historic First Ward, offering the highly sought after convenience of first floor living. JUST updated with fresh interior paint, brand new carpet, and a newly installed HVAC system this home is truly move in ready. The functional layout features spacious living areas filled with natural light, making it ideal for both everyday living and entertaining. Step outside to enjoy a generous backyard, a rare find in this area, perfect for outdoor dining, pets, or future enhancements. A private driveway provides off-street parking and added privacy, enha
Key facts
- Private driveway
- Prime urban location
- First floor living
Tags
Property features AI
Exterior
- Parking: Attached 2-car garage; Driveway access; Garage with door opener
- Security: Owned security system; Smoke detectors
- Utilities: Public water; Public sewer
- Home design: Residential property; Entry level: Slab foundation
- Construction: Built in 2017; Cement siding and stucco exterior; Composition roof; Slab foundation
- Exterior features: Fenced backyard; Sprinkler / irrigation system; Back yard fencing
Interior
- Kitchen: Dishwasher; Electric oven; Gas range; Microwave; Refrigerator; Garbage disposal; Kitchen island
- Bedrooms: Primary bedroom (Second floor); Three additional bedrooms (Second floor)
- Flooring: Carpet; Tile; Wood
- Bathrooms: Three full bathrooms; One half bathroom; Double vanities in baths
- Heating & cooling: Central heating (gas); Central air conditioning (electric); Has heating; Has cooling
- Interior features: Balcony; Double vanity in bathrooms; High ceilings; Kitchen island; Kitchen open to family room; Primary bedroom with attached bath; Soaking tub; Separate shower; Wired for sound; Window treatments; Ceiling fans; Programmable thermostat; Low emissivity windows
- Laundry & utility: Washer hookup; Electric dryer hookup; Gas dryer hookup
Neighborhood map
What this means for you Summary
Snapshot
- This is a 4-bed/3.5-bath single-family listed at $549k.
Deal economics
- At list price, monthly cash flow is $651 ($8k/yr) — positive.
- The deal already cash-flows at list — no discount required.
- Meets the 1% rule at list price ($6k rent vs $549k).
- Recommended offer: $541k (1.5% below list) — sets the bar for market timing.
- Cap rate 7.7% vs local median 3.2% in Houston — top-decile yield for the area; either an underpriced asset or a hidden risk that comps aren't pricing in. Stress-test before assuming the spread holds.
Location & tenants
- Location reads 74/100 on livability (#184 in TX, #4,771 nationally) — a middle-class / working-renter tenant base. Strengths: amenities A+, cost of living A+, housing A+; Watch: crime F.
- Houston ISD (urban): math 27% / reading 35% proficiency, ranked #593 of 826 in TX (top 72%) — families likely to look elsewhere, expect single-tenant / working-renter base with shorter leases; 71% free/reduced lunch — lower-income household profile, screen leases tightly.
- Zoned schools: Hogg Middle (math 44% / reading 48%, grade D+, #462 of 1,662 statewide, top 28%, 1,120 students, 52% FRL); Heights H S (math 27% / reading 57%, grade F, #730 of 1,632 statewide, top 47%, 2,476 students, 65% FRL).
- Zoned-school proficiency averages 44% at this address vs 31% district-wide (+13 pts) — the actual schools serving this property are materially stronger than the Houston ISD average implies; a family-tenant draw the district grade alone would hide.
- Market conditions: Rents soft (-0.8%/yr); 651 active listings in the ZIP; 12 comparable units currently listed for rent nearby; rentals at typical pace (median 20d on market — plan ~3-4 weeks tenant-placement turnaround); 42% of comp listings sitting > 30 days — soft ceiling on asking rent; high-income renter base; 29,883 units permitted in Harris County in 2024 (8,621 in 5+ unit buildings).
- At $6,286/mo this rent would consume 52% of the median local household income ($145k/yr) (locally 1812% of renters already pay >50% of income on rent) — very limited rent-growth headroom before tenants either downsize or default.
Forward outlook
- Local home prices are declining (-3.0%/yr); year-one equity from $4k of loan paydown is wiped out by about $16k of value loss. Plan a longer hold.
- Harris County population projected at +47% by 2050 — long-run rental-demand tailwind backs the buy-and-hold thesis.
Negotiation context
- It's been on market 18 days — a 2% lower offer ($541k) is reasonable based on typical stale-listing flexibility.
- 10 sale attempts since 9y ago with the ask held roughly flat each time — persistent listings suggest the price (not the market) is what's stuck; bring a comps-based counter.
Risks & watch-outs
- Watch-outs: property tax is 2.6% of price.
- Climate carrying-cost: moderate flood risk; severe wind risk, 99% chance of damaging wind over 30y; extreme-heat days projected 7→23/yr by 2055 (HVAC capex compounding) — expect insurance premiums to compound above CPI over the hold.
Questions for the listing agent
- Property tax is high relative to price — has the assessment been appealed recently, and will the sale trigger a re-assessment?
- Is there a deadline driving the sale (1031 exchange, divorce, estate, relocation)? That informs how much negotiation room exists.
- Schools are D-rated, which usually means shorter tenancies and higher turnover. Who's the typical renter profile here, and what's been the actual vacancy rate?
- Crime grade is F in this area — have there been break-ins, vandalism, or insurance claims at this property in the last 3 years? What carrier currently insures it and at what premium?
- The area grade is low — what's the realistic commute time and amenity access for the typical tenant pool here? Any planned neighborhood developments (good or bad) we should know about?
- What's the average days-on-market for RENTAL listings here right now (not sales)? A rising rental-DOM trend means longer vacancies and softer asking-rent achievability than the comps imply.
- What's the recent tenant-quality profile in this submarket — average credit score on applications, eviction rate, late-payment / NSF rate, and stable-employment percentage? A property-management company in the area should have these aggregated.
- How much new for-sale + rental construction is in the pipeline within 1–3 miles? Heavy new supply typically softens prices + rents 12–24 months out; constrained supply supports both.
Investment metrics
- 1% rule
- 1.14% ✓
- Cap rate
- 7.71%
- Cash-on-cash
- 5.08%
- DSCR
- 1.23
- GRM
- 7.3
CMA / ARV
- ARV (median comp)
- $510,504
- List price
- $549,000
- Delta
- 11.46%
- Verdict
- OVERPRICED
- Comps
- 20 within 1.0 mi
Show comp detail 12 sales within ~0.75 mi
| Address | Dist | Beds/Ba | Sqft | Sold | Price | $/sf | Match |
|---|---|---|---|---|---|---|---|
| 1511 Crockett St Unit A | 0.20mi | 4/3.5 | 2,991 (-0%) | 4mo | $599,000 | $200 | 86 |
| 1518 Houston Ave | 0.17mi | 4/3.5 | 2,868 (-4%) | 7mo | $675,000 | $235 | 78 |
| 1411 Beachton St | 0.19mi | 3/4.5 (-1) | 2,988 (-0%) | 4mo | $559,000 | $187 | 78 |
| 1308 Edwards Unit B | 0.18mi | 4/4.5 | 2,840 (-5%) | 3mo | $799,900 | $282 | 76 |
| 1511 Crockett St Unit B | 0.20mi | 4/3.5 | 3,330 (+11%) | 5mo | $599,000 | $180 | 68 |
| 2713 Beauchamp St | 0.73mi | 4/3.5 | 3,002 (-0%) | 1mo | $1,059,900 | $353 | 65 |
| 2715 Beauchamp St | 0.73mi | 4/3.5 | 3,002 (-0%) | 2mo | $1,059,900 | $353 | 64 |
| 1509 Colorado St | 0.35mi | 3/3.5 (-1) | 2,780 (-7%) | 8mo | $650,000 | $234 | 59 |
| 1104 Dart St | 0.24mi | 3/2.5 (-1) | 2,580 (-14%) | 3mo | $599,900 | $233 | 54 |
| 1108 Dart St | 0.24mi | 3/2.5 (-1) | 2,572 (-14%) | 9mo | $624,900 | $243 | 48 |
| 2708 Morrison St | 0.68mi | 4/3.5 | 3,388 (+13%) | 7mo | $1,649,000 | $487 | 41 |
| 1730 White Oak Dr | 0.67mi | 3/2.5 (-1) | 3,388 (+13%) | 4mo | $1,425,000 | $421 | 35 |
Match score weights: distance 35% · size 25% · config 20% · recency 20%. Top-matched comps best support the ARV.
Projected returns pro-forma
-3.0% appreciation · 0.0% rent growth · sell at horizon
- IRR
- -12.2%
- Equity multiple
- 0.57×
- Total profit
- $-65,535
- Equity at exit
- $81,858
- IRR
- -9.1%
- Equity multiple
- 0.52×
- Total profit
- $-73,220
- Equity at exit
- $47,467
Cash invested: $153,720 (down + closing). Projections, not guarantees.
Landlord ↔ Tenant lean methodology
- Overall (STATE)
- 87 Strongly Landlord-Friendly
- State Texas
- 87 Strongly Landlord-Friendly · R+5
- County
- — inherits STATE
- City
- — inherits STATE
ZIP-level market 77007
- Rents YoY
- -0.8%
- Active inventory
- 651
- Price-to-rent
- 7.3×
Monthly cashflow live
- Estimated rent
- $6,286 high interval (Pro) →
- Mortgage (P&I)
- −$2,879
- Tax from tax record
- −$1,207 /mo · $14,489/yr
- Insurance
- −$229
- HOA
- −$0
- Vacancy / Maint / Mgmt
- −$1,320
- Net cashflow
- $651
Break-even live
Sensitivity live
| Price | -10% $961 | -5% $806 | +0% $651 | +5% $495 | +10% $340 |
|---|---|---|---|---|---|
| Rent | -10% $154 | -5% $402 | +0% $651 | +5% $899 | +10% $1,147 |
| Rate | -1.0pp $927 | -0.5pp $790 | base $651 | +0.5pp $508 | +1.0pp $364 |
UW: 25.0% down · 7.5% · 30yr · 1.5% tax · 5.0% vac · 8.0% maint · 8.0% mgmt
Financing live
Cash to close
- Down payment
- $137,250
- Closing costs
- $16,470
- Reserves months
- —
- Total cash needed
- —
Loan-product check · same deal, 3 products live
Conventional
25% down · 7.5% · 30yr
- Down + closing
- —
- Monthly P&I
- —
- Monthly cashflow
- —
- DSCR
- —
- Eligible?
- —
Personal DTI + credit; lowest rate.
DSCR
20% down · 8.5% · 30yr
- Down + closing
- —
- Monthly P&I
- —
- Monthly cashflow
- —
- DSCR
- —
- Eligible?
- —
No personal income docs; deal must DSCR.
Hard money
10% down · 12.0% · 12mo
- Down + closing
- —
- Monthly P&I
- —
- Monthly cashflow
- —
- DSCR
- —
- Eligible?
- —
Short-term bridge; refi at stabilization.
Rent comps 12 comps
| Address | Beds | Baths | Sqft | Rent | $/sqft | DOM | Units | Dist |
|---|---|---|---|---|---|---|---|---|
| 2114 Sabine St Unit 1257735P Houston, TX | 3.0 | 3.5 | 2594 | $6,588 | $2.54 | 45d | 1 | 0.38mi |
| 2018 Crockett St Unit 1029793P Houston, TX | 3.0 | 3.5 | 2507 | $6,482 | $2.59 | 6d | 1 | 0.54mi |
| 2018 Crockett St Unit 2018 Houston, TX | 3.0 | 3.5 | 2514 | $8,000 | $3.18 | 45d | 1 | 0.54mi |
| 414 Milam St Unit 3165 Houston, TX | 3.0 | 2.0 | 2421 | $8,951 | $3.70 | 0d | 1 | 0.89mi |
| 414 Milam St Unit 447 Houston, TX | 3.0 | 2.0 | 2421 | $8,973 | $3.71 | 45d | 1 | 0.89mi |
| 414 Milam St Unit 510 Houston, TX | 3.0 | 2.0 | 2421 | $9,230 | $3.81 | 15d | 1 | 0.89mi |
| 414 Milam St Unit 447 Houston, TX | 3.0 | 2.0 | 2421 | $8,991 | $3.71 | 12d | 1 | 0.89mi |
| 915 Texas Ave Unit 420 Houston, TX | 3.0 | 2.0 | 2366 | $4,655 | $1.97 | 45d | 1 | 1.04mi |
| 915 Texas Ave Unit 420 Houston, TX | 3.0 | 2.0 | 2366 | $4,655 | $1.97 | 20d | 1 | 1.04mi |
| 1116 Woodland St Houston, TX | 3.0 | 2.0 | 2400 | $4,000 | $1.67 | 45d | 1 | 1.29mi |
| 401 Walton St Houston, TX | 3.0 | 2.0 | 2112 | $2,500 | $1.18 | 16d | 1 | 1.45mi |
| 808 Crawford St Houston, TX | 1.0–3.0 | 1.0–3.5 | 1740 | $12,645 | $7.27 | 0d | 27 | 1.46mi |
Listing history 42 events
-
2026-06-21days on market $549,000 Active 18 DOM
-
2026-06-18days on market $549,000 Active 15 DOM
-
2026-06-17days on market $549,000 Active 14 DOM
-
2026-06-16days on market $549,000 Active 13 DOM
-
2026-06-15days on market $549,000 Active 12 DOM
-
2026-06-13days on market $549,000 Active 10 DOM
-
2026-06-09days on market $549,000 Active 6 DOM
-
2026-06-08days on market $549,000 Active 5 DOM
-
2026-06-07days on market $549,000 Active 4 DOM
-
2026-06-04pricedays on market $549,000 Active 1 DOM
-
2026-06-01days on market $569,000 Active 33 DOM
-
2026-05-31days on market $569,000 Active 32 DOM
-
2026-04-29$569,000 Active 941-char remark
-
2026-04-29historical $569,000 941-char remark
-
2026-04-29historical
-
2026-04-09$585,000 Active
-
2026-04-08historical
-
2026-03-20price $599,900
-
2026-02-18$635,000 Active
-
2020-09-02soldstatus
-
2020-08-31soldstatus Sold
-
2020-08-04status Pending
-
2020-07-24status Option Pending
-
2020-07-14price $515,000
-
2020-06-28status Active
-
2020-06-27price $524,990
-
2020-06-27historical
-
2020-06-24$525,000 Active
-
2020-06-21historical
-
2020-05-28price $544,000
-
2020-05-07price $578,500
-
2020-04-24$588,500 Active
-
2018-05-24soldstatus Sold
-
2018-04-28status Pending
-
2018-04-21price $537,715
-
2018-04-21price $527,715
-
2018-04-17price $537,715
-
2017-11-03$535,990 Active
-
2017-11-03$529,990
-
2017-11-03historical
-
2017-11-02historical
-
2017-05-18$529,990 Active
ⓘ Source: listings_history table (triggers on properties + properties_extension) + one-shot
backfill from property_details.listing_events for pre-trigger history.
Tax reassessment forecast TX · Resets to sale price
- Current annual tax
- $14,489 · $1,207/mo
- Projected year-2 tax
- $14,489 · $1,207/mo
- Expected delta
- $0/yr ($0/mo · 0.0%)
ⓘ Screening estimate from a state-policy table — verify with the county assessor before closing.
Climate risk First Street
- Flood 5/10 Major FEMA zone X (shaded) · 24% chance over 30 yrs
- Wildfire 1/10 Low
- Heat 9/10 Extreme 7 d/yr ≥109°F today · 23 d/yr by 30 yrs out
- Wind 9/10 Extreme 99% chance of damaging wind over 30 yrs
- Air quality 3/10 Moderate 2 unhealthy d/yr today · 3 by 30 yrs out
Nearby sold comps map
Loading sold comps map…
Walkable amenities ~0.75 mi
Loading nearby amenities…
Taxation est. · year 1
- Rental income
- $75,428
- − Mortgage interest
- −$30,753
- − Property taxes
- −$14,489
- − Insurance
- −$2,745
- − Repairs & maintenance
- −$6,034
- − Management
- −$6,034
- − Depreciation
- −$15,971
- Taxable loss
- −$598
- Est. tax savings @ 24.0%
- +$143
- After-tax cash flow
- $7,950/yr
For passive investors: Depreciation is non-cash, so a rental often shows a tax loss while cash-flowing — sheltering income. Rental losses are passive: they offset passive income freely, and up to $25,000/yr can offset ordinary (W-2) income if you actively participate and your MAGI is under $100k (phasing out to $0 by $150k); unused losses carry forward. On sale, claimed depreciation is recaptured at up to 25%, and gains may owe capital-gains tax (a 1031 exchange can defer both). Figures are a year-1 estimate at your 24.0% rate — not tax advice; consult a CPA.
Schools (NCES district)
- District
- Houston ISD
- NCES district ID
- 4823640
- Math proficiency
- 27% ▼ -18.00%
- Reading proficiency
- 35% ▼ -6.00%
- Median HH income
- $46,054
- Composite
- 26.63/100
- National rank
- #7173
- State rank
- #593 of 826 in TX
Livability — Houston
- Score
- 74/100
- State rank
- #184
- US rank
- #4771
Category grades
Schools grade is shown separately in the Schools card above.
Census & demographics
- Census place
- Houston, TX
- County
- Harris County · 4,702,590 people
- City population
- 3,226,434
- Metro
- Houston-The Woodlands-Sugar Land, TX
- Population (ZIP)
- 47,808
- Household income
- $144,911
- Rent vs Own
- Severe rent burden
- 1812.0
Population outlook (Harris County) Hauer SSP2
- Today (2025)
- 5,571,493 people
- By 2030
- 6,089,821 · +9.3%
- By 2040
- 7,142,806 · +28.2%
- By 2050
- 8,185,864 · +46.9%
- By 2075
- 10,574,329 · +89.8%
- By 2100
- 12,109,958 · +117.4%
Race, ethnicity, and origin ACS 2023
- Neighborhood character
- Diverse neighborhood (Simpson 0.63)
- Race & ethnicity
- White 57% Hispanic / Latino 17% Two or more races 13% Asian 11% Black 9%
- Hispanic origin (detail)
- Mexican 12%
- Common ancestry
- Slovak 3% Romanian 3% Italian 3%
- Foreign-born
- 19% · Canada, China, South Korea
- Languages at home
- 75% English-only · Spanish 12% Other Indo-European 4% Chinese 2%
Political lean MEDSL · Harris
- 2024 margin
- Lean D (+5.5) · D 52.0% · R 46.4% · Other 1.6%
- 2008→2024 swing
- +3.9pp toward D · 2008: 1.6pp · 2024: 5.5pp
- All cycles
- 2024: D+5.5 2020: D+13.3 2016: D+12.4 2012: D+0.1 2008: D+1.6
Not yet ingested
- Civics
- —
Market trends
- HPI YoY
- ▼ -219.42%
- Current HPI
- 159.8157
- Rent YoY
- ▼ -0.83%
- Metro
- Houston-The Woodlands-Sugar Land, TX
- State GDP YoY
- ▲ 3.95%
- F500 in state
- 110
Industry mix (Fortune 500 HQ in TX)
| Industry | F500 HQs | Revenue |
|---|---|---|
| Energy | 16 | $1,198B |
|
||
| Technology | 5 | $198B |
|
||
| Engineering / Construction | 4 | $72B |
|
||
| Energy Services | 3 | $60B |
|
||
| Utilities | 3 | $41B |
|
||
| Healthcare | 2 | $330B |
|
||
Price history
+3.6% since first listed32 events — show timeline
- 2026-06-03 Listed $549,000 HARMLS
- 2026-06-03 Listing Removed — HARMLS
- 2026-04-29 Listed $569,000 HARMLS
- 2026-04-29 Coming Soon — HARMLS
- 2026-04-29 Listing Removed — HARMLS
- 2026-04-09 Listed $585,000 HARMLS
- 2026-04-08 Listing Removed — HARMLS
- 2026-03-20 Price Changed $599,900 HARMLS
- 2026-02-18 Listed $635,000 HARMLS
- 2020-09-02 Sold (Public Records) — Public Records
- 2020-08-31 Sold (MLS) — HARMLS
- 2020-08-04 Pending — HARMLS
- 2020-07-24 Pending — HARMLS
- 2020-07-14 Price Changed $515,000 HARMLS
- 2020-06-28 Relisted — HARMLS
- 2020-06-27 Price Changed $524,990 HARMLS
- 2020-06-27 Listing Removed — HARMLS
- 2020-06-24 Listed $525,000 HARMLS
- 2020-06-21 Listing Removed — HARMLS
- 2020-05-28 Price Changed $544,000 HARMLS
- 2020-05-07 Price Changed $578,500 HARMLS
- 2020-04-24 Listed $588,500 HARMLS
- 2018-05-24 Sold (MLS) — HARMLS
- 2018-04-28 Pending — HARMLS
- 2018-04-21 Price Changed $537,715 HARMLS
- 2018-04-21 Price Changed $527,715 HARMLS
- 2018-04-17 Price Changed $537,715 HARMLS
- 2017-11-03 Listed $535,990 HARMLS
- 2017-11-03 Listing Removed — HARMLS
- 2017-11-03 Listed $529,990 HARMLS
- 2017-11-02 Listing Removed — HARMLS
- 2017-05-18 Listed $529,990 HARMLS
Property tax history
+23.0%/yrLatest (2025): $14,489 · +8.6% YoY. Source: county tax records.
Cash-flow waterfall
monthlySold comps — $/sqft
last 12 mo · ≤1 miLoading sold comps…