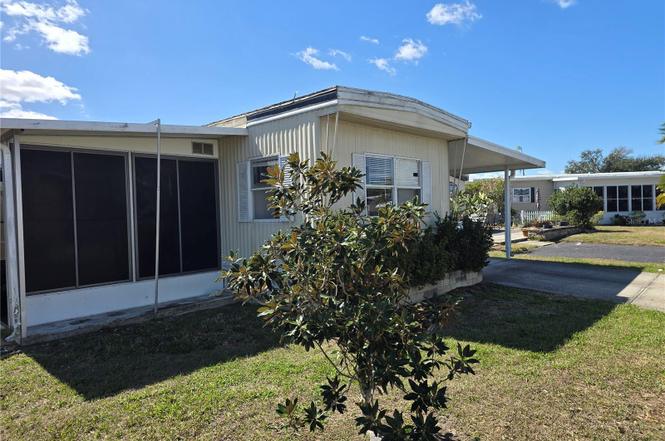
5316 53rd Ave E Unit E3 · Bradenton, FL
Flood risk 4/10 · Minor
- FEMA flood zone
- X (unshaded)
- Chance of flooding over 30 yrs
- 0.22%
- Est. flood insurance / yr
- $507 – $1,088
Fire risk 1/10 · Minimal
- Est. fire insurance / yr
- $947 – $1,759
Heat risk 10/10 · Severe
- Hot days now (above 108°F)
- 7 days/yr
- Hot days in 30 yrs
- 30 days/yr
Wind risk 10/10 · Severe
- Chance of severe wind over 30 yrs
- 99.0%
Air-quality risk 2/10 · Minimal
- Unhealthy air days now
- 1 days/yr
- Unhealthy air days in 30 yrs
- 1 days/yr
Risk factors via First Street. Map © Google.
Why this score? — see what drove the B+ grade
The composite is a weighted blend of 9 inputs, each scored 0–100. Each bar is that input's sub-score; the figure is the points it added to the 100-point composite (weight × sub-score).
- Cash flow +30.0/30.0
- ARV discount +15.0/15.0
- 1% rule +10.0/10.0
- DSCR +10.0/10.0
- Schools +4.4/10.0
- Livability +4.0/5.0
- Condition / age +2.5/5.0
- Rent growth +2.3/5.0
- Appreciation +0.0/10.0
$50,000
🖨 Deal sheet 📄 Offer letter ✓ Due diligence
Listing remarks
Property needs repairs and is priced accordingly. Owner is motivated.
Key facts
- 3,354 sq ft lot
- Parking
- Community pool
Property features AI
Finance
- Other: Living area approx. 672 sq ft (public records); Lot approx. 0.08 acres (0.08 acre / ~312 m²); Direction faces north
- Financial info: Total annual association fees $3,984; Lease restrictions apply
- HOA & community: Part of Lou Paul association with required approval; Monthly association fee $332; Association amenities include cable TV, clubhouse, laundry, pool, recreation facilities, shuffleboard court, and maintained private road; Association fee covers cable TV, pool, internet, grounds maintenance, management, private road, recreational facilities, sewer, trash and water; Community features: buyer approval required, clubhouse, community mailbox, deed restrictions, pool; Senior community; Cats and dogs allowed; Partially furnished
Exterior
- Parking: Has carport (1 space)
- Utilities: Public water; Public sewer; Electricity connected; Cable connected; Sewer connected; Water connected
- Home design: Residential mobile home (single wide); One story; Faces north
- Construction: Vinyl siding with frame construction; Metal roof; 120.4 m2 building area total (per records)
- Exterior features: Private maintained road; Asphalt/paved road
Interior
- Kitchen: Range; Refrigerator
- Bedrooms: 2 bedrooms
- Flooring: Laminate
- Bathrooms: 1 full bathroom
- Heating & cooling: Central heating (electric); Central air conditioning
- Interior features: Living room/dining room combo; Window treatments
- Laundry & utility: Laundry located outside; Electric water heater
Neighborhood map
What this means for you Summary
Snapshot
- This is a 2-bed/1.0-bath manufactured listed at $50k.
Deal economics
- At list price, monthly cash flow is $762 ($9k/yr) — positive.
- The deal already cash-flows at list — no discount required.
- Meets the 1% rule at list price ($2k rent vs $50k).
- Recommended offer: $46k (9.0% below list) — sets the bar for market timing.
- Cap rate 24.6% vs local median 3.6% in Bradenton — top-decile yield for the area; either an underpriced asset or a hidden risk that comps aren't pricing in. Stress-test before assuming the spread holds.
Location & tenants
- Location reads 81/100 on livability (#101 in FL, #1,528 nationally) — a professional / high-income tenant draw. Strengths: commute A+, cost of living A+, housing A+; Watch: employment D+, crime D, amenities F.
- Manatee (suburban): math 54% / reading 50% proficiency, ranked #26 of 73 in FL (top 36%) — acceptable for families but not a draw, mixed tenant base, ~2y average lease.
- Market conditions: Rents soft (-1.0%/yr); 384 active listings in the ZIP; 7,472 units permitted in Manatee County in 2024 (1,782 in 5+ unit buildings).
- This rent runs 31% of the median local income ($71k/yr) — at the standard rent-burdened threshold; future hikes will face affordability resistance.
Forward outlook
- Local home prices are declining (-3.0%/yr); year-one equity from $346 of loan paydown is wiped out by about $2k of value loss. Plan a longer hold.
- Manatee County population projected at +43% by 2050 — long-run rental-demand tailwind backs the buy-and-hold thesis.
- At projected returns (-3.0% appreciation + 0.0% rent growth), your $14k cash investment doubles in ~2 years — after that, you're playing with house money.
Negotiation context
- It's been on market 111 days — a 9% lower offer ($46k) is reasonable based on typical stale-listing flexibility.
Risks & watch-outs
- Climate carrying-cost: severe wind risk, 99% chance of damaging wind over 30y; extreme-heat days projected 7→30/yr by 2055 (HVAC capex compounding) — expect insurance premiums to compound above CPI over the hold.
Questions for the listing agent
- It's been on market 111 days. Have you received any prior offers? Is the seller open to a 9% concession, seller financing, or rate buy-down credit?
- Built in 1972 — when were the roof, HVAC, electrical panel, plumbing, and water heater last replaced?
- What does the HOA fee cover, when was the last increase, and are there any pending special assessments or reserve-fund shortfalls?
- Why hasn't it sold? Are there any deal-killer items the seller is aware of (foundation, flood, title, zoning, code violations)?
- Is there a deadline driving the sale (1031 exchange, divorce, estate, relocation)? That informs how much negotiation room exists.
- Crime grade is D in this area — have there been break-ins, vandalism, or insurance claims at this property in the last 3 years? What carrier currently insures it and at what premium?
- What's the average days-on-market for RENTAL listings here right now (not sales)? A rising rental-DOM trend means longer vacancies and softer asking-rent achievability than the comps imply.
- What's the recent tenant-quality profile in this submarket — average credit score on applications, eviction rate, late-payment / NSF rate, and stable-employment percentage? A property-management company in the area should have these aggregated.
- How much new for-sale + rental construction is in the pipeline within 1–3 miles? Heavy new supply typically softens prices + rents 12–24 months out; constrained supply supports both.
Investment metrics
- 1% rule
- 3.69% ✓
- Cap rate
- 24.57%
- Cash-on-cash
- 65.29%
- DSCR
- 3.90
- GRM
- 2.3
CMA / ARV
- ARV (on-the-fly)
- $82,656
- Comps found
- 10
Show comp detail 10 sales within ~0.75 mi
| Address | Dist | Beds/Ba | Sqft | Sold | Price | $/sf | Match |
|---|---|---|---|---|---|---|---|
| 5316 53rd Ave E Unit B6 | 0.11mi | 2/1.0 | 672 (0%) | 10mo | $50,000 | $74 | 86 |
| 5316 53rd Ave E Unit M4 | 0.26mi | 2/1.0 | 672 (0%) | 3mo | $73,000 | $109 | 86 |
| 5316 53 Ave E Unit I5 | 0.23mi | 2/1.0 | 690 (+3%) | 3mo | $84,900 | $123 | 83 |
| 5316 53rd Ave E Unit Q6 | 0.23mi | 2/1.0 | 672 (0%) | 10mo | $80,000 | $119 | 81 |
| 5316 53rd Ave E Unit E2 | 0.01mi | 2/2.0 | 736 (+10%) | 1mo | $75,000 | $102 | 79 |
| 5316 53rd Ave E Unit Q8 | 0.25mi | 2/1.0 | 672 (0%) | 12mo | $99,000 | $147 | 78 |
| 5316 53rd Ave E Unit K29 | 0.26mi | 2/2.0 | 672 (0%) | 10mo | $111,000 | $165 | 76 |
| 5316 53rd Ave E Unit I10 | 0.26mi | 2/1.5 | 744 (+11%) | 8mo | $98,000 | $132 | 61 |
| 5316 53rd Ave E Unit A3 | 0.06mi | 2/2.0 | 768 (+14%) | 12mo | $65,000 | $85 | 59 |
| 5707 45th St E #81 | 0.69mi | 2/2.0 | 736 (+10%) | 6mo | $105,000 | $143 | 43 |
Match score weights: distance 35% · size 25% · config 20% · recency 20%. Top-matched comps best support the ARV.
Projected returns pro-forma
-3.0% appreciation · 0.0% rent growth · sell at horizon
- IRR
- 60.1%
- Equity multiple
- 3.52×
- Total profit
- $35,244
- Equity at exit
- $7,455
- IRR
- 63.4%
- Equity multiple
- 6.23×
- Total profit
- $73,240
- Equity at exit
- $4,323
Cash invested: $14,000 (down + closing). Projections, not guarantees.
Landlord ↔ Tenant lean methodology
- Overall (STATE)
- 87 Strongly Landlord-Friendly
- State Florida
- 87 Strongly Landlord-Friendly · R+3
- County
- — inherits STATE
- City
- — inherits STATE
ZIP-level market 34203
- Home prices YoY
- -24.5%
- Rents YoY
- -1.0%
- Active inventory
- 384
- Price-to-rent
- 2.3×
Monthly cashflow live
- Estimated rent
- $1,846 medium interval (Pro) →
- Mortgage (P&I)
- −$262
- Tax from tax record
- −$82 /mo · $981/yr
- Insurance
- −$21
- HOA
- −$332
- Vacancy / Maint / Mgmt
- −$388
- Net cashflow
- $762
Break-even live
UW: 25.0% down · 7.5% · 30yr · 1.5% tax · 5.0% vac · 8.0% maint · 8.0% mgmt
Financing live
Cash to close
- Down payment
- $12,500
- Closing costs
- $1,500
- Reserves months
- —
- Total cash needed
- —
Loan-product check · same deal, 3 products live
Conventional
25% down · 7.5% · 30yr
- Down + closing
- —
- Monthly P&I
- —
- Monthly cashflow
- —
- DSCR
- —
- Eligible?
- —
Personal DTI + credit; lowest rate.
DSCR
20% down · 8.5% · 30yr
- Down + closing
- —
- Monthly P&I
- —
- Monthly cashflow
- —
- DSCR
- —
- Eligible?
- —
No personal income docs; deal must DSCR.
Hard money
10% down · 12.0% · 12mo
- Down + closing
- —
- Monthly P&I
- —
- Monthly cashflow
- —
- DSCR
- —
- Eligible?
- —
Short-term bridge; refi at stabilization.
HOA detail
- Monthly dues
- $332 · $3,984/yr
Listing history 16 events
-
2026-06-18days on market $50,000 Active 111 DOM
-
2026-06-17days on market $50,000 Active 110 DOM
-
2026-06-16days on market $50,000 Active 109 DOM
-
2026-06-15days on market $50,000 Active 108 DOM
-
2026-06-13days on market $50,000 Active 106 DOM
-
2026-06-13days on market $50,000 Active 105 DOM
-
2026-06-10days on market $50,000 Active 103 DOM
-
2026-06-09days on market $50,000 Active 102 DOM
-
2026-06-08days on market $50,000 Active 101 DOM
-
2026-06-08days on market $50,000 Active 100 DOM
-
2026-06-03days on market $50,000 Active 96 DOM
-
2026-06-02days on market $50,000 Active 95 DOM
-
2026-06-01days on market $50,000 Active 94 DOM
-
2026-05-31days on market $50,000 Active 93 DOM
-
2026-04-20price $50,000
-
2026-02-27$60,000 Active
ⓘ Source: listings_history table (triggers on properties + properties_extension) + one-shot
backfill from property_details.listing_events for pre-trigger history.
Tax reassessment forecast FL · Resets to sale price
- Current annual tax
- $981 · $82/mo
- Projected year-2 tax
- $981 · $82/mo
- Expected delta
- $0/yr ($0/mo · 0.0%)
ⓘ Screening estimate from a state-policy table — verify with the county assessor before closing.
Climate risk First Street
- Flood 4/10 Moderate FEMA zone X (unshaded) · 22% chance over 30 yrs
- Wildfire 1/10 Low
- Heat 10/10 Extreme 7 d/yr ≥108°F today · 30 d/yr by 30 yrs out
- Wind 10/10 Extreme 99% chance of damaging wind over 30 yrs
- Air quality 2/10 Low 1 unhealthy d/yr today · 1 by 30 yrs out
Nearby sold comps map
Loading sold comps map…
Walkable amenities ~0.75 mi
Loading nearby amenities…
Taxation est. · year 1
- Rental income
- $22,154
- − Mortgage interest
- −$2,801
- − Property taxes
- −$981
- − Insurance
- −$250
- − Repairs & maintenance
- −$1,772
- − Management
- −$1,772
- − HOA
- −$3,984
- − Depreciation
- −$1,455
- Taxable income
- $9,139
- Est. tax owed @ 24.0%
- −$2,193
- After-tax cash flow
- $6,947/yr
For passive investors: Depreciation is non-cash, so a rental often shows a tax loss while cash-flowing — sheltering income. Rental losses are passive: they offset passive income freely, and up to $25,000/yr can offset ordinary (W-2) income if you actively participate and your MAGI is under $100k (phasing out to $0 by $150k); unused losses carry forward. On sale, claimed depreciation is recaptured at up to 25%, and gains may owe capital-gains tax (a 1031 exchange can defer both). Figures are a year-1 estimate at your 24.0% rate — not tax advice; consult a CPA.
Schools (NCES district)
- District
- Manatee
- NCES district ID
- 1201230
- Math proficiency
- 54% ▼ -6.00%
- Reading proficiency
- 50% ▼ -2.00%
- Median HH income
- $49,607
- Composite
- 44.43/100
- National rank
- #2806
- State rank
- #26 of 73 in FL
Livability — Bradenton
- Score
- 81/100
- State rank
- #101
- US rank
- #1528
Category grades
Schools grade is shown separately in the Schools card above.
Census & demographics
- County
- Manatee County · 416,364 people
- City population
- 227,091
- Metro
- North Port-Sarasota-Bradenton, FL
- Population (ZIP)
- 40,618
- Household income
- $70,761
- Rent vs Own
- Severe rent burden
- 1469.0
Population outlook (Manatee County) Hauer SSP2
- Today (2025)
- 447,342 people
- By 2030
- 488,911 · +9.3%
- By 2040
- 567,934 · +27.0%
- By 2050
- 637,995 · +42.6%
- By 2075
- 781,970 · +74.8%
- By 2100
- 848,272 · +89.6%
Race, ethnicity, and origin ACS 2023
- Neighborhood character
- Predominantly White (65%)
- Race & ethnicity
- White 65% Hispanic / Latino 19% Two or more races 12% Black 9% Asian 5%
- Hispanic origin (detail)
- Mexican 9% Puerto Rican 3% Cuban 2% Dominican 1%
- Common ancestry
- Lithuanian 3% Romanian 3% Slovak 2%
- Foreign-born
- 17% · Canada, Vietnam, Dominican Republic
- Languages at home
- 76% English-only · Spanish 16% Vietnamese 2% Other Indo-European 1%
Political lean MEDSL · Manatee
- 2024 margin
- Strong R (+23.5) · D 37.9% · R 61.4%
- 2008→2024 swing
- -16.5pp toward R · 2008: -7.0pp · 2024: -23.5pp
- All cycles
- 2024: R+23.5 2020: R+16.1 2016: R+17.1 2012: R+12.5 2008: R+7.0
Not yet ingested
- Civics
- —
Market trends
- HPI YoY
- ▼ -95.87%
- Current HPI
- 295.8871
- Rent YoY
- ▼ -0.97%
- Metro
- North Port-Sarasota-Bradenton, FL
- State GDP YoY
- ▲ 3.28%
- F500 in state
- 36
Industry mix (Fortune 500 HQ in FL)
| Industry | F500 HQs | Revenue |
|---|---|---|
| Industrial Technology | 2 | $29B |
|
||
| Insurance | 2 | $17B |
|
||
| Retail | 1 | $60B |
|
||
| Technology Distribution | 1 | $58B |
|
||
| Homebuilding | 1 | $35B |
|
||
| Technology Manufacturing | 1 | $35B |
|
||
Price history
-16.7% since first listed2 events — show timeline
- 2026-04-20 Price Changed $50,000 Stellar MLS as Distributed by MLS Grid
- 2026-02-27 Listed $60,000 Stellar MLS as Distributed by MLS Grid
Property tax history
+4.9%/yrLatest (2025): $981 · -0.1% YoY. Source: county tax records.
Cash-flow waterfall
monthlySold comps — $/sqft
last 12 mo · ≤1 miLoading sold comps…