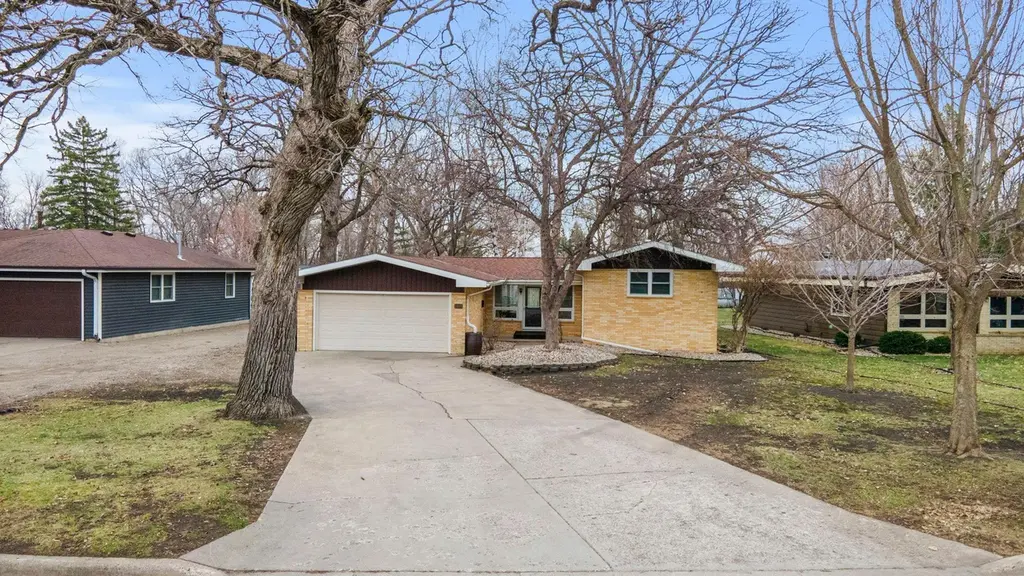
1045 Jorgenson St SE · Hutchinson, MN
Flood risk 1/10 · Minimal
- FEMA flood zone
- X (unshaded)
- Chance of flooding over 30 yrs
- 0.0%
- Est. flood insurance / yr
- $473 – $860
Fire risk 1/10 · Minimal
- Est. fire insurance / yr
- $888 – $1,650
Heat risk 2/10 · Minimal
- Hot days now (above 99°F)
- 7 days/yr
- Hot days in 30 yrs
- 14 days/yr
Wind risk 2/10 · Minimal
- Chance of severe wind over 30 yrs
- —
Air-quality risk 2/10 · Minimal
- Unhealthy air days now
- 2 days/yr
- Unhealthy air days in 30 yrs
- 2 days/yr
Risk factors via First Street. Map © Google.
Why this score? — see what drove the F grade
The composite is a weighted blend of 9 inputs, each scored 0–100. Each bar is that input's sub-score; the figure is the points it added to the 100-point composite (weight × sub-score).
- ARV discount +7.5/15.0
- Cash flow +7.4/30.0
- Schools +4.8/10.0
- Livability +4.0/5.0
- Rent growth +2.5/5.0
- Condition / age +2.5/5.0
- 1% rule +1.6/10.0
- DSCR +1.5/10.0
- Appreciation +0.0/10.0
$299,000
🖨 Deal sheet (PDF) 📄 Offer letter ✓ Due diligence
Listing remarks MLS
Tri-Level Home offers formal dining room, hardwood floors, ceramic tile, cove ceiling over living room, lower level family room, office, patio, mature treed lot and more.
Key facts
- Newer roof
- Newer windows
- Updated kitchen
Tags
Property features AI
Exterior
- Parking: Attached insulated garage with garage door opener; Concrete driveway; 2-car garage (approximately 20x23)
- Utilities: City water connected; City sewer connected; Natural gas service; 100 amp electrical service with circuit breakers
- Home design: Residential property; Three-level split layout; Main entry on main level; Above-ground and below-ground finished living areas
- Construction: Block foundation; Asphalt roof (age 8 years or less)
- Exterior features: Deck; Patio; Stone and wood exterior accents; Chain link fencing; Storage shed; Medium tree coverage; Irregular lot shape; City street frontage
Interior
- Kitchen: Range; Microwave; Dishwasher; Refrigerator; Stainless steel appliances
- Bedrooms: 4 bedrooms (three bedrooms on the upper level; one bedroom on the lower level)
- Bathrooms: One full bathroom on the upper level; Half bathroom on the main floor; Double sink
- Heating & cooling: Forced air heating; Central air conditioning
- Interior features: Finished lower level; Partial finished basement with crawl space and sump pump; Separate/formal dining room; Kitchen window; Water softener (owned)
- Laundry & utility: Washer and dryer (hookup in unit); Laundry in basement with utility sink; Gas water heater
Neighborhood map
What this means for you Summary
Snapshot
- This is a 3-bed/2.0-bath single-family listed at $299k.
Deal economics
- At list price, monthly cash flow is $-391 ($-5k/yr) — negative.
- To cash-flow at today's rent, offer at most $230k (23.1% below list).
- To meet the 1% rule (rent ≥ 1% of price), the offer needs to be $198k (33.6% below list).
- Recommended offer: $198k (33.6% below list) — sets the bar for 1% rule.
- Cap rate 4.7% vs local median 3.1% in Hutchinson — top-decile yield for the area; either an underpriced asset or a hidden risk that comps aren't pricing in. Stress-test before assuming the spread holds.
Location & tenants
- Location reads 80/100 on livability (#72 in MN, #1,744 nationally) — a professional / high-income tenant draw. Strengths: cost of living A+, housing A+, health & safety A+; Watch: commute F.
- Hutchinson Public School District (town): math 56% / reading 56% proficiency, ranked #62 of 301 in MN (top 21%) — acceptable for families but not a draw, mixed tenant base, ~2y average lease.
- Zoned schools: Hutchinson West Elementary (426 students, 42% FRL); Hutchinson Middle (math 53% / reading 59%, grade B-, #41 of 258 statewide, top 16%, 565 students, 37% FRL); Hutchinson Senior High (math 52% / reading 62%, grade C, #64 of 471 statewide, top 16%, 908 students, 31% FRL).
- Market conditions: 115 active listings in the ZIP; 3 comparable units currently listed for rent nearby; rentals lingering (median 46d on market — plan ~5-8 weeks vacancy on turnover, expect pricing pressure); 100% of comp listings sitting > 30 days — soft ceiling on asking rent; 57 units permitted in McLeod County in 2024 (0 in 5+ unit buildings).
Forward outlook
- Local home prices are declining (-3.0%/yr); year-one equity from $2k of loan paydown is wiped out by about $9k of value loss. Plan a longer hold.
- McLeod County population projected at -20% by 2050 — secular population decline; favor cash flow + early exit over multi-decade hold.
Negotiation context
- It's been on market 22 days — a 2% lower offer ($295k) is reasonable based on typical stale-listing flexibility.
- 3 sale attempts since 23y ago with the ask held roughly flat each time — persistent listings suggest the price (not the market) is what's stuck; bring a comps-based counter.
- Current owner paid $133k; list at $299k implies a 125% gain — meaningful room to come down on a strong offer.
Questions for the listing agent
- What do current leases actually rent for vs. the listed asking? Can we see a recent rent roll and the last 12 months of T-12 income?
- Built in 1960 — when were the roof, HVAC, electrical panel, plumbing, and water heater last replaced?
- Is there a deadline driving the sale (1031 exchange, divorce, estate, relocation)? That informs how much negotiation room exists.
- Schools are B-rated — typically a magnet for longer-tenancy family renters. What's the average tenant stay here, and is there a school-zone premium baked into asking?
- The area grade is low — what's the realistic commute time and amenity access for the typical tenant pool here? Any planned neighborhood developments (good or bad) we should know about?
- What's the average days-on-market for RENTAL listings here right now (not sales)? A rising rental-DOM trend means longer vacancies and softer asking-rent achievability than the comps imply.
- What's the recent tenant-quality profile in this submarket — average credit score on applications, eviction rate, late-payment / NSF rate, and stable-employment percentage? A property-management company in the area should have these aggregated.
- How much new for-sale + rental construction is in the pipeline within 1–3 miles? Heavy new supply typically softens prices + rents 12–24 months out; constrained supply supports both.
Investment metrics
- 1% rule
- 0.66% ✗
- Cap rate
- 4.72%
- Cash-on-cash
- -5.60%
- DSCR
- 0.75
- GRM
- 12.6
CMA / ARV
No comps found within radius.
Projected returns pro-forma
-3.0% appreciation · 3.0% rent growth · sell at horizon
- IRR
- -25.9%
- Equity multiple
- 0.12×
- Total profit
- $-73,376
- Equity at exit
- $44,582
- IRR
- -22.6%
- Equity multiple
- -0.15×
- Total profit
- $-96,091
- Equity at exit
- $25,852
Cash invested: $83,720 (down + closing). Projections, not guarantees.
Landlord ↔ Tenant lean methodology
- Overall (STATE)
- 46 Balanced
- State Minnesota
- 46 Balanced · D+2
- County
- — inherits STATE
- City
- — inherits STATE
ZIP-level market 55350
- Home prices YoY
- -30.6%
- Active inventory
- 115
- Price-to-rent
- 12.6×
Monthly cashflow live
- Estimated rent
- $1,984 medium interval (Pro) →
- Mortgage (P&I)
- −$1,568
- Tax from tax record
- −$266 /mo · $3,188/yr
- Insurance
- −$125
- HOA
- −$0
- Vacancy / Maint / Mgmt
- −$417
- Net cashflow
- $-391
Break-even live
Sensitivity live
| Price | -10% $-222 | -5% $-306 | +0% $-391 | +5% $-475 | +10% $-560 |
|---|---|---|---|---|---|
| Rent | -10% $-548 | -5% $-469 | +0% $-391 | +5% $-312 | +10% $-234 |
| Rate | -1.0pp $-240 | -0.5pp $-315 | base $-391 | +0.5pp $-468 | +1.0pp $-547 |
UW: 25.0% down · 7.5% · 30yr · 1.5% tax · 5.0% vac · 8.0% maint · 8.0% mgmt
Financing live
Cash to close
- Down payment
- $74,750
- Closing costs
- $8,970
- Reserves months
- —
- Total cash needed
- —
Loan-product check · same deal, 3 products live
Conventional
25% down · 7.5% · 30yr
- Down + closing
- —
- Monthly P&I
- —
- Monthly cashflow
- —
- DSCR
- —
- Eligible?
- —
Personal DTI + credit; lowest rate.
DSCR
20% down · 8.5% · 30yr
- Down + closing
- —
- Monthly P&I
- —
- Monthly cashflow
- —
- DSCR
- —
- Eligible?
- —
No personal income docs; deal must DSCR.
Hard money
10% down · 12.0% · 12mo
- Down + closing
- —
- Monthly P&I
- —
- Monthly cashflow
- —
- DSCR
- —
- Eligible?
- —
Short-term bridge; refi at stabilization.
Rent comps 3 comps
| Address | Beds | Baths | Sqft | Rent | $/sqft | DOM | Units | Dist |
|---|---|---|---|---|---|---|---|---|
| 1220 Sunset St SW Hutchinson, MN | 2.0 | 2.0 | 1230 | $1,675 | $1.36 | 45d | 1 | 0.86mi |
| 550 Lincoln Ave SW Hutchinson, MN | 2.0 | 2.0 | 1800 | $1,875 | $1.04 | 45d | 1 | 1.16mi |
| 1120 Lewis Ave SW Hutchinson, MN | 3.0 | 3.0 | 2224 | $2,495 | $1.12 | 45d | 1 | 1.49mi |
Listing history 9 events
-
2026-05-01status Pending
-
2026-04-27historical Contingent - Inspection
-
2026-04-09$299,000 Active
-
2010-06-30soldstatus $132,650 170-char remark
Show marketing remark (170 chars)
Tri-Level Home offers formal dining room, hardwood floors, ceramic tile, cove ceiling over living room, lower level family room, office, patio, mature treed lot and more.
-
2010-05-13historical 170-char remark
Show marketing remark (170 chars)
Tri-Level Home offers formal dining room, hardwood floors, ceramic tile, cove ceiling over living room, lower level family room, office, patio, mature treed lot and more.
-
2010-04-14$129,900 170-char remark
Show marketing remark (170 chars)
Tri-Level Home offers formal dining room, hardwood floors, ceramic tile, cove ceiling over living room, lower level family room, office, patio, mature treed lot and more.
-
2004-03-01soldstatus $135,000 209-char remark
Show marketing remark (209 chars)
THREE LEVEL HOME WITH HARDWOOD FLOORS, FRENCH DOORS TO PATIO, BUILT IN STORAGE/CLOSETS IN HALL. ALL APPLIANCES STAY. NEW ROOF IN 2002. HOME WARRANTY PLAN INCLUDED. NICE LOCATION CLOSE TO SHOPPING AND HOSPITAL.
-
2003-09-22$139,900 209-char remark
Show marketing remark (209 chars)
THREE LEVEL HOME WITH HARDWOOD FLOORS, FRENCH DOORS TO PATIO, BUILT IN STORAGE/CLOSETS IN HALL. ALL APPLIANCES STAY. NEW ROOF IN 2002. HOME WARRANTY PLAN INCLUDED. NICE LOCATION CLOSE TO SHOPPING AND HOSPITAL.
-
2003-01-21historical 209-char remark
Show marketing remark (209 chars)
THREE LEVEL HOME WITH HARDWOOD FLOORS, FRENCH DOORS TO PATIO, BUILT IN STORAGE/CLOSETS IN HALL. ALL APPLIANCES STAY. NEW ROOF IN 2002. HOME WARRANTY PLAN INCLUDED. NICE LOCATION CLOSE TO SHOPPING AND HOSPITAL.
ⓘ Source: listings_history table (triggers on properties + properties_extension) + one-shot
backfill from property_details.listing_events for pre-trigger history.
Tax reassessment forecast MN · Partial reset (capped growth)
- Current annual tax
- $3,188 · $266/mo
- Projected year-2 tax
- $3,268 · $272/mo
- Expected delta
- +$80/yr (+$7/mo · 2.5%)
ⓘ Screening estimate from a state-policy table — verify with the county assessor before closing.
Climate risk First Street
- Flood 1/10 Low FEMA zone X (unshaded) · 0% chance over 30 yrs
- Wildfire 1/10 Low
- Heat 2/10 Low 7 d/yr ≥99°F today · 14 d/yr by 30 yrs out
- Wind 2/10 Low
- Air quality 2/10 Low 2 unhealthy d/yr today · 2 by 30 yrs out
Nearby sold comps map
Loading sold comps map…
Walkable amenities ~0.75 mi
Loading nearby amenities…
Taxation est. · year 1
- Rental income
- $23,810
- − Mortgage interest
- −$16,749
- − Property taxes
- −$3,188
- − Insurance
- −$1,495
- − Repairs & maintenance
- −$1,905
- − Management
- −$1,905
- − Depreciation
- −$8,698
- Taxable loss
- −$10,130
- Est. tax savings @ 24.0%
- +$2,431
- After-tax cash flow
- $-2,258/yr
For passive investors: Depreciation is non-cash, so a rental often shows a tax loss while cash-flowing — sheltering income. Rental losses are passive: they offset passive income freely, and up to $25,000/yr can offset ordinary (W-2) income if you actively participate and your MAGI is under $100k (phasing out to $0 by $150k); unused losses carry forward. On sale, claimed depreciation is recaptured at up to 25%, and gains may owe capital-gains tax (a 1031 exchange can defer both). Figures are a year-1 estimate at your 24.0% rate — not tax advice; consult a CPA.
Schools (NCES district)
- District
- Hutchinson Public School District
- NCES district ID
- 2714970
- Math proficiency
- 56% ▼ -9.00%
- Reading proficiency
- 56% ▼ -10.00%
- Median HH income
- $56,261
- Composite
- 48.36/100
- National rank
- #2143
- State rank
- #62 of 301 in MN
Livability — Hutchinson
- Score
- 80/100
- State rank
- #72
- US rank
- #1744
Category grades
Schools grade is shown separately in the Schools card above.
Census & demographics
- Census place
- Hutchinson, MN
- City population
- 18,567
- Population (ZIP)
- 18,567
Population outlook (McLeod County) Hauer SSP2
- Today (2025)
- 34,517 people
- By 2030
- 33,442 · -3.1%
- By 2040
- 30,815 · -10.7%
- By 2050
- 27,695 · -19.8%
- By 2075
- 21,923 · -36.5%
- By 2100
- 17,237 · -50.1%
Race, ethnicity, and origin ACS 2023
- Neighborhood character
- Predominantly White (91%)
- Race & ethnicity
- White 91% Hispanic / Latino 4% Two or more races 3%
- Common ancestry
- Portuguese 13% Romanian 4% Lithuanian 2%
- Foreign-born
- 3% · Canada, China
- Languages at home
- 96% English-only · Spanish 2% Chinese 1%
Political lean MEDSL · McLeod
- 2024 margin
- Solid R (+38.0) · D 30.2% · R 68.1% · Other 1.7%
- 2008→2024 swing
- -19.6pp toward R · 2008: -18.3pp · 2024: -38.0pp
- All cycles
- 2024: R+38.0 2020: R+36.2 2016: R+38.4 2012: R+22.2 2008: R+18.3
Not yet ingested
- Civics
- —
Market trends
- HPI YoY
- ▼ -89.48%
- Current HPI
- 203.0298
- Rent YoY
- —
- Metro
- —
- State GDP YoY
- ▲ 2.41%
- F500 in state
- 34
Industry mix (Fortune 500 HQ in MN)
| Industry | F500 HQs | Revenue |
|---|---|---|
| Healthcare | 2 | $407B |
|
||
| Retail | 2 | $150B |
|
||
| Consumer Goods | 2 | $32B |
|
||
| Industrial Machinery | 2 | $6B |
|
||
| Agriculture | 1 | $40B |
|
||
| Healthcare / Medical Devices | 1 | $32B |
|
||
Price history
+113.7% since first listed9 events — show timeline
- 2026-05-01 Pending — NORTHSTARMLS as Distributed by MLS Grid
- 2026-04-27 Contingent — NORTHSTARMLS as Distributed by MLS Grid
- 2026-04-09 Listed $299,000 NORTHSTARMLS as Distributed by MLS Grid
- 2010-06-30 Sold (MLS) $132,650 NORTHSTARMLS as Distributed by MLS Grid
- 2010-05-13 Listing Removed — NORTHSTARMLS as Distributed by MLS Grid
- 2010-04-14 Listed $129,900 NORTHSTARMLS as Distributed by MLS Grid
- 2004-03-01 Sold (MLS) $135,000 NORTHSTARMLS as Distributed by MLS Grid
- 2003-09-22 Listed $139,900 NORTHSTARMLS as Distributed by MLS Grid
- 2003-01-21 Listing Removed — NORTHSTARMLS as Distributed by MLS Grid
Property tax history
+5.4%/yrLatest (2025): $3,188 · +0.6% YoY. Source: county tax records.
Cash-flow waterfall
monthlySold comps — $/sqft
last 12 mo · ≤1 miLoading sold comps…