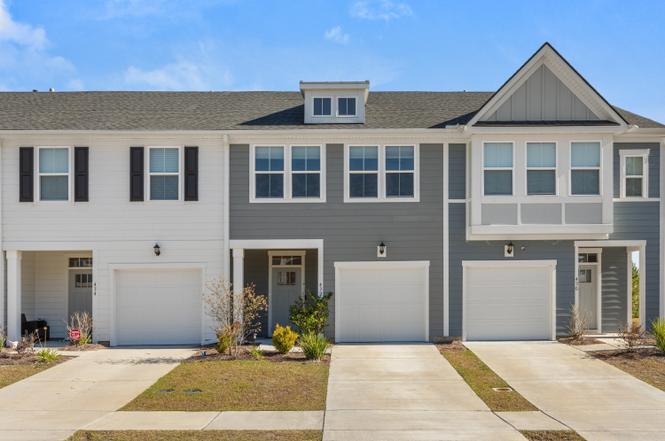
432 Trotters Ln · Moncks Corner, SC
Flood risk No data
- FEMA flood zone
- —
- Chance of flooding over 30 yrs
- —
- Est. flood insurance / yr
- —
Fire risk No data
- Est. fire insurance / yr
- —
Heat risk No data
- Hot days now (above threshold)
- —
- Hot days in 30 yrs
- —
Wind risk No data
- Chance of severe wind over 30 yrs
- —
Air-quality risk No data
- Unhealthy air days now
- —
- Unhealthy air days in 30 yrs
- —
Risk factors via First Street. Map © Google.
Why this score? — see what drove the D+ grade
The composite is a weighted blend of 9 inputs, each scored 0–100. Each bar is that input's sub-score; the figure is the points it added to the 100-point composite (weight × sub-score).
- ARV discount +15.0/15.0
- Cash flow +13.2/30.0
- DSCR +4.0/10.0
- 1% rule +3.9/10.0
- Schools +3.6/10.0
- Livability +3.4/5.0
- Rent growth +3.2/5.0
- Condition / age +2.5/5.0
- Appreciation +0.0/10.0
$279,000
🖨 Deal sheet (PDF) 📄 Offer letter ✓ Due diligence
Listing remarks
Welcome to 432 Trotters Lane in the sought-after Foxbank Plantation community! If you've been looking for a better than new, still smells new, affordable, low-maintenance home that doesn't sacrifice comfort, convenience, or lifestyle, this is the one. Overlooking a peaceful pond, this move-in, ready townhome offers the perfect blend of modern living and everyday ease. The open floor plan provides comfortable living and entertaining space, while the low-maintenance lifestyle allows you to spend more time enjoying your home and less time working on it. Whether you're a first-time homebuyer, downsizing, or simply looking for an alternative to renting, this home presents an incredible opportuni
Key facts
- Swimming pools
- Wooded landscapes
- Tranquil lakes
Tags
Property features AI
Finance
- HOA & community: Monthly association fee of $220; Community amenities: park, pool
Exterior
- Parking: Attached 1-car garage
- Utilities: Public sewer; Irrigation equipment
- Home design: Single family attached (townhouse); Two stories; Townhouse structure
- Construction: Architectural roof
- Exterior features: Lawn irrigation; Pond on the property
Interior
- Kitchen: Dishwasher; Garbage disposal; Gas range; Microwave; Refrigerator; Kitchen island; Eat-in kitchen
- Bedrooms: 3 bedrooms; Primary bedroom on upper level with ceiling fan
- Flooring: Carpet; Ceramic tile; Luxury vinyl
- Bathrooms: 2.5 bathrooms
- Heating & cooling: Central air conditioning; Natural gas heating
- Interior features: Smooth ceilings; High ceilings; Kitchen island; Walk-in closet(s); Ceiling fan(s); Eat-in kitchen; Family room; Formal living room
- Laundry & utility: Washer hookup; Electric dryer hookup
Neighborhood map
What this means for you Summary
Snapshot
- This is a 3-bed/2.5-bath single-family listed at $279k.
Deal economics
- At list price, monthly cash flow is $-5 ($-59/yr) — negative.
- To cash-flow at today's rent, offer at most $278k (0.3% below list).
- To meet the 1% rule (rent ≥ 1% of price), the offer needs to be $247k (11.5% below list).
- Recommended offer: $246k (12.0% below list) — sets the bar for market timing.
- Cap rate 6.3% vs local median 4.6% in Moncks Corner — top-decile yield for the area; either an underpriced asset or a hidden risk that comps aren't pricing in. Stress-test before assuming the spread holds.
Location & tenants
- Location reads 67/100 on livability (#99 in SC) — a middle-class / working-renter tenant base. Strengths: housing A+, health & safety A+, cost of living A; Watch: crime C-, amenities F, commute F.
- Berkeley 01 (suburban): math 35% / reading 48% proficiency, ranked #30 of 80 in SC (top 38%) — families likely to look elsewhere, expect single-tenant / working-renter base with shorter leases.
- Zoned schools: Foxbank Elementary (math 36% / reading 36%, grade F, #332 of 597 statewide, top 56%, 1,028 students, 40% FRL); Berkeley Middle (math 19% / reading 32%, grade F, #162 of 229 statewide, top 71%, 1,403 students, 57% FRL); Berkeley High (math 36% / reading 83%, grade C+, #110 of 196 statewide, top 58%, 1,776 students, 50% FRL) — zoned schools at 49% FRL track the district average.
- Market conditions: Rents rising (+2.8%/yr); 642 active listings in the ZIP; 9 comparable units currently listed for rent nearby; rentals leasing fast (median 5d on market — plan ~1-2 weeks tenant-placement turnaround); solid renter incomes; 3,183 units permitted in Berkeley County in 2024 (580 in 5+ unit buildings).
- This rent runs 36% of the median local income ($83k/yr) — at the standard rent-burdened threshold; future hikes will face affordability resistance.
Forward outlook
- Local home prices are declining (-3.0%/yr); year-one equity from $2k of loan paydown is wiped out by about $8k of value loss. Plan a longer hold.
- Berkeley County population projected at +48% by 2050 — long-run rental-demand tailwind backs the buy-and-hold thesis.
Negotiation context
- It's been on market 213 days — a 12% lower offer ($246k) is reasonable based on typical stale-listing flexibility.
Questions for the listing agent
- What do current leases actually rent for vs. the listed asking? Can we see a recent rent roll and the last 12 months of T-12 income?
- It's been on market 213 days. Have you received any prior offers? Is the seller open to a 12% concession, seller financing, or rate buy-down credit?
- What does the HOA fee cover, when was the last increase, and are there any pending special assessments or reserve-fund shortfalls?
- Why hasn't it sold? Are there any deal-killer items the seller is aware of (foundation, flood, title, zoning, code violations)?
- Is there a deadline driving the sale (1031 exchange, divorce, estate, relocation)? That informs how much negotiation room exists.
- Schools are D-rated, which usually means shorter tenancies and higher turnover. Who's the typical renter profile here, and what's been the actual vacancy rate?
- The area grade is low — what's the realistic commute time and amenity access for the typical tenant pool here? Any planned neighborhood developments (good or bad) we should know about?
- What's the average days-on-market for RENTAL listings here right now (not sales)? A rising rental-DOM trend means longer vacancies and softer asking-rent achievability than the comps imply.
- What's the recent tenant-quality profile in this submarket — average credit score on applications, eviction rate, late-payment / NSF rate, and stable-employment percentage? A property-management company in the area should have these aggregated.
- How much new for-sale + rental construction is in the pipeline within 1–3 miles? Heavy new supply typically softens prices + rents 12–24 months out; constrained supply supports both.
Investment metrics
- 1% rule
- 0.89% ✗
- Cap rate
- 6.27%
- Cash-on-cash
- -0.08%
- DSCR
- 1.00
- GRM
- 9.4
CMA / ARV
- ARV (on-the-fly)
- $353,184
- Comps found
- 12
Show comp detail 12 sales within ~0.75 mi
| Address | Dist | Beds/Ba | Sqft | Sold | Price | $/sf | Match |
|---|---|---|---|---|---|---|---|
| 129 Yorkshire Dr | 0.23mi | 3/2.5 | 1,854 (+9%) | 2mo | $370,000 | $200 | 72 |
| 125 Yorkshire Dr | 0.22mi | 3/2.5 | 1,854 (+9%) | 5mo | $350,000 | $189 | 70 |
| 135 Long Trail Way | 0.61mi | 3/2.0 | 1,742 (+3%) | 2mo | $363,000 | $208 | 64 |
| 149 Waccamaw Cir | 0.23mi | 3/2.0 | 1,919 (+13%) | 6mo | $345,000 | $180 | 60 |
| 309 Harriswood Ln | 0.41mi | 3/2.5 | 1,504 (-11%) | 6mo | $330,000 | $219 | 57 |
| 406 American Goldfinch Way | 0.63mi | 4/2.0 (+1) | 1,790 (+5%) | 1mo | $345,500 | $193 | 54 |
| 143 Red Leaf Blvd | 0.52mi | 3/2.5 | 1,920 (+13%) | 2mo | $330,000 | $172 | 53 |
| 161 Kimberton Ave | 0.71mi | 3/2.5 | 1,564 (-8%) | 4mo | $365,500 | $234 | 50 |
| 169 Kimberton Ave | 0.73mi | 3/2.5 | 1,820 (+7%) | 6mo | $299,000 | $164 | 49 |
| 202 Killarney Trl | 0.49mi | 3/2.0 | 1,449 (-15%) | 3mo | $315,000 | $217 | 48 |
| 151 Kimberton Ave | 0.70mi | 3/2.0 | 1,483 (-13%) | 0mo | $325,000 | $219 | 44 |
| 139 Kimberton Ave | 0.72mi | 3/2.0 | 1,449 (-15%) | 4mo | $320,000 | $221 | 37 |
Match score weights: distance 35% · size 25% · config 20% · recency 20%. Top-matched comps best support the ARV.
Projected returns pro-forma
-3.0% appreciation · 2.77% rent growth · sell at horizon
- IRR
- -16.7%
- Equity multiple
- 0.41×
- Total profit
- $-46,039
- Equity at exit
- $41,600
- IRR
- -8.9%
- Equity multiple
- 0.45×
- Total profit
- $-42,602
- Equity at exit
- $24,123
Cash invested: $78,120 (down + closing). Projections, not guarantees.
Landlord ↔ Tenant lean methodology
- Overall (STATE)
- 90 Strongly Landlord-Friendly
- State South Carolina
- 90 Strongly Landlord-Friendly · R+6
- County
- — inherits STATE
- City
- — inherits STATE
ZIP-level market 29461
- Home prices YoY
- -13.9%
- Rents YoY
- 2.8%
- Active inventory
- 642
- Price-to-rent
- 9.4×
Monthly cashflow live
- Estimated rent
- $2,469 high interval (Pro) →
- Mortgage (P&I)
- −$1,463
- Tax from tax record
- −$156 /mo · $1,875/yr
- Insurance
- −$116
- HOA
- −$220
- Vacancy / Maint / Mgmt
- −$519
- Net cashflow
- $-5
Break-even live
Sensitivity live
| Price | -10% $153 | -5% $74 | +0% $-5 | +5% $-84 | +10% $-163 |
|---|---|---|---|---|---|
| Rent | -10% $-200 | -5% $-102 | +0% $-5 | +5% $93 | +10% $190 |
| Rate | -1.0pp $136 | -0.5pp $66 | base $-5 | +0.5pp $-77 | +1.0pp $-151 |
UW: 25.0% down · 7.5% · 30yr · 1.5% tax · 5.0% vac · 8.0% maint · 8.0% mgmt
Financing live
Cash to close
- Down payment
- $69,750
- Closing costs
- $8,370
- Reserves months
- —
- Total cash needed
- —
Loan-product check · same deal, 3 products live
Conventional
25% down · 7.5% · 30yr
- Down + closing
- —
- Monthly P&I
- —
- Monthly cashflow
- —
- DSCR
- —
- Eligible?
- —
Personal DTI + credit; lowest rate.
DSCR
20% down · 8.5% · 30yr
- Down + closing
- —
- Monthly P&I
- —
- Monthly cashflow
- —
- DSCR
- —
- Eligible?
- —
No personal income docs; deal must DSCR.
Hard money
10% down · 12.0% · 12mo
- Down + closing
- —
- Monthly P&I
- —
- Monthly cashflow
- —
- DSCR
- —
- Eligible?
- —
Short-term bridge; refi at stabilization.
Rent comps 9 comps
| Address | Beds | Baths | Sqft | Rent | $/sqft | DOM | Units | Dist |
|---|---|---|---|---|---|---|---|---|
| 419 Trotters Ln Moncks Corner, SC | 3.0 | 2.5 | 1594 | $2,350 | $1.47 | 5d | 1 | 0.05mi |
| 500 Trotters Ln Moncks Corner, SC | 3.0 | 2.5 | 1698 | $2,150 | $1.27 | 25d | 1 | 0.14mi |
| 534 Alderly Dr Moncks Corner, SC | 3.0 | 2.5 | 1594 | $2,900 | $1.82 | 5d | 1 | 0.20mi |
| 609 Trotters Ln Moncks Corner, SC | 3.0 | 2.5 | 1609 | $2,395 | $1.49 | 16d | 9 | 0.26mi |
| 107 Springbank Ct Moncks Corner, SC | 3.0 | 3.0 | 2174 | $2,346 | $1.08 | 23d | 1 | 0.30mi |
| 100 Southern Vine St Moncks Corner, SC | 1.0–3.0 | 1.0–2.0 | 980 | $2,125 | $2.17 | 5d | 30 | 0.55mi |
| 143 Rockingham Way Moncks Corner, SC | 3.0 | 2.5 | 2095 | $2,051 | $0.98 | 5d | 1 | 0.64mi |
| 714 McRoy St Moncks Corner, SC | 4.0 | 3.0 | 1912 | $2,400 | $1.26 | 4d | 1 | 1.39mi |
| 705 McRoy St Moncks Corner, SC | 4.0 | 2.5 | 1801 | $2,399 | $1.33 | 5d | 1 | 1.43mi |
HOA detail
- Monthly dues
- $220 · $2,640/yr
Listing history 28 events
-
2026-06-21days on market $279,000 Active 213 DOM
-
2026-06-18days on market $279,000 Active 210 DOM
-
2026-06-17days on market $279,000 Active 209 DOM
-
2026-06-16days on market $279,000 Active 208 DOM
-
2026-06-15days on market $279,000 Active 207 DOM
-
2026-06-13days on market $279,000 Active 205 DOM
-
2026-06-13days on market $279,000 Active 204 DOM
-
2026-06-10days on market $279,000 Active 202 DOM
-
2026-06-09days on market $279,000 Active 201 DOM
-
2026-06-08days on market $279,000 Active 200 DOM
-
2026-06-07days on market $279,000 Active 199 DOM
-
2026-06-05days on market $279,000 Active 196 DOM
-
2026-06-03days on market $279,000 Active 195 DOM
-
2026-06-03days on market $279,000 Active 194 DOM
-
2026-06-01days on market $279,000 Active 193 DOM
-
2026-05-31days on market $279,000 Active 192 DOM
-
2026-05-01price $279,000
-
2026-04-03price $284,900
-
2026-03-05price $285,000
-
2026-02-24price $289,993
-
2026-02-12price $289,994
-
2026-02-04price $289,995
-
2026-01-28price $289,996
-
2026-01-20price $289,997
-
2026-01-16price $289,998
-
2026-01-12price $289,999
-
2025-11-20$290,000 Active
-
2021-09-16soldstatus $3,489,968
ⓘ Source: listings_history table (triggers on properties + properties_extension) + one-shot
backfill from property_details.listing_events for pre-trigger history.
Tax reassessment forecast SC · Resets to sale price
- Current annual tax
- $1,875 · $156/mo
- Projected year-2 tax
- $1,875 · $156/mo
- Expected delta
- $0/yr ($0/mo · 0.0%)
ⓘ Screening estimate from a state-policy table — verify with the county assessor before closing.
Nearby sold comps map
Loading sold comps map…
Walkable amenities ~0.75 mi
Loading nearby amenities…
Taxation est. · year 1
- Rental income
- $29,631
- − Mortgage interest
- −$15,628
- − Property taxes
- −$1,875
- − Insurance
- −$1,395
- − Repairs & maintenance
- −$2,370
- − Management
- −$2,370
- − HOA
- −$2,640
- − Depreciation
- −$8,116
- Taxable loss
- −$4,765
- Est. tax savings @ 24.0%
- +$1,144
- After-tax cash flow
- $1,085/yr
For passive investors: Depreciation is non-cash, so a rental often shows a tax loss while cash-flowing — sheltering income. Rental losses are passive: they offset passive income freely, and up to $25,000/yr can offset ordinary (W-2) income if you actively participate and your MAGI is under $100k (phasing out to $0 by $150k); unused losses carry forward. On sale, claimed depreciation is recaptured at up to 25%, and gains may owe capital-gains tax (a 1031 exchange can defer both). Figures are a year-1 estimate at your 24.0% rate — not tax advice; consult a CPA.
Schools (NCES district)
- District
- Berkeley 01
- NCES district ID
- 4501170
- Math proficiency
- 35% ▼ -8.00%
- Reading proficiency
- 48% ▼ -2.00%
- Median HH income
- $52,724
- Composite
- 35.95/100
- National rank
- #4799
- State rank
- #30 of 80 in SC
Livability — Moncks Corner
- Score
- 67/100
- State rank
- #99
- US rank
- #10812
Category grades
Schools grade is shown separately in the Schools card above.
Census & demographics
- Census place
- Moncks Corner, SC
- County
- Berkeley County · 198,768 people
- City population
- 43,816
- Metro
- Charleston-North Charleston, SC
- Population (ZIP)
- 43,816
- Household income
- $82,666
- Rent vs Own
- Severe rent burden
- 815.0
Population outlook (Berkeley County) Hauer SSP2
- Today (2025)
- 254,184 people
- By 2030
- 279,677 · +10.0%
- By 2040
- 329,379 · +29.6%
- By 2050
- 375,557 · +47.8%
- By 2075
- 476,740 · +87.6%
- By 2100
- 535,945 · +110.8%
Race, ethnicity, and origin ACS 2023
- Neighborhood character
- Majority White (61%)
- Race & ethnicity
- White 61% Black 29% Hispanic / Latino 6% Two or more races 5%
- Hispanic origin (detail)
- Mexican 2% Puerto Rican 2%
- Common ancestry
- Lithuanian 1% Slovak 1% Romanian 1%
- Foreign-born
- 3% · Canada
- Languages at home
- 96% English-only · Spanish 3%
Political lean MEDSL · Berkeley
- 2024 margin
- R (+16.3) · D 41.1% · R 57.4% · Other 1.4%
- 2008→2024 swing
- -3.2pp toward R · 2008: -13.1pp · 2024: -16.3pp
- All cycles
- 2024: R+16.3 2020: R+11.7 2016: R+17.4 2012: R+18.9 2008: R+13.1
Not yet ingested
- Civics
- —
Market trends
- HPI YoY
- ▼ -52.95%
- Current HPI
- 328.7212
- Rent YoY
- ▲ 2.77%
- Metro
- Charleston-North Charleston, SC
- State GDP YoY
- ▲ 4.51%
- F500 in state
- 2
Industry mix (Fortune 500 HQ in SC)
| Industry | F500 HQs | Revenue |
|---|---|---|
| Packaging | 1 | $7B |
|
||
Price history
-92.0% since first listed12 events — show timeline
- 2026-05-01 Price Changed $279,000 Charleston Trident MLS
- 2026-04-03 Price Changed $284,900 Charleston Trident MLS
- 2026-03-05 Price Changed $285,000 Charleston Trident MLS
- 2026-02-24 Price Changed $289,993 Charleston Trident MLS
- 2026-02-12 Price Changed $289,994 Charleston Trident MLS
- 2026-02-04 Price Changed $289,995 Charleston Trident MLS
- 2026-01-28 Price Changed $289,996 Charleston Trident MLS
- 2026-01-20 Price Changed $289,997 Charleston Trident MLS
- 2026-01-16 Price Changed $289,998 Charleston Trident MLS
- 2026-01-12 Price Changed $289,999 Charleston Trident MLS
- 2025-11-20 Listed $290,000 Charleston Trident MLS
- 2021-09-16 Sold (Public Records) $3,489,968 Public Records
Property tax history
+45.3%/yrLatest (2025): $1,875 · +6.0% YoY. Source: county tax records.
Cash-flow waterfall
monthlySold comps — $/sqft
last 12 mo · ≤1 miLoading sold comps…