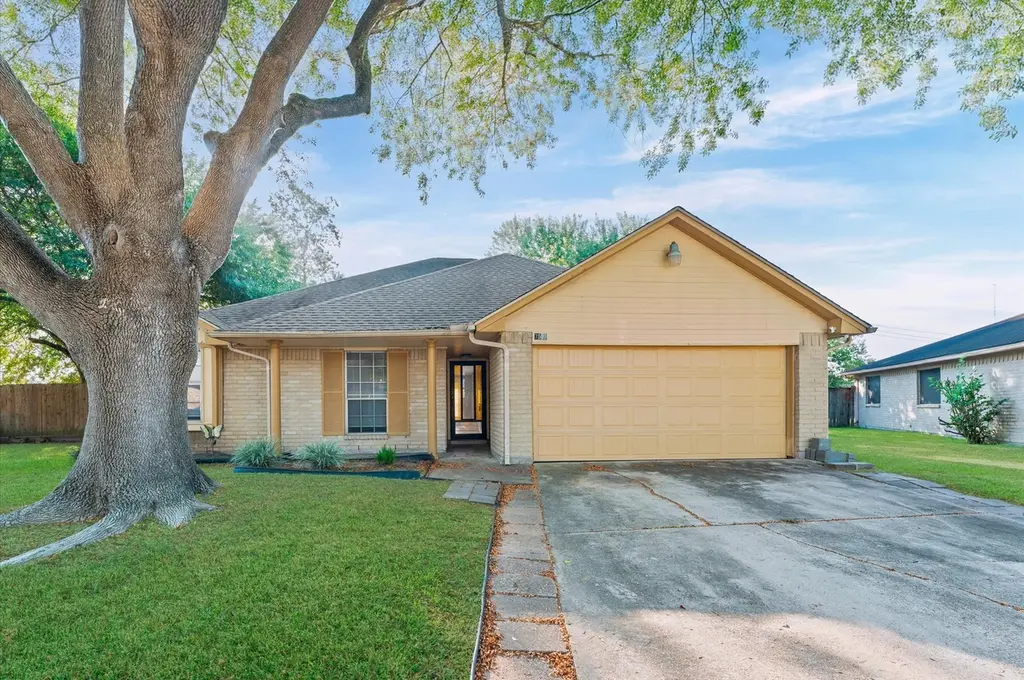
7502 Briar Run Ct · Houston, TX
Flood risk 1/10 · Minimal
- FEMA flood zone
- X (unshaded)
- Chance of flooding over 30 yrs
- 0.0%
- Est. flood insurance / yr
- $507 – $1,088
Fire risk 2/10 · Minimal
- Est. fire insurance / yr
- $1,222 – $2,270
Heat risk 9/10 · Severe
- Hot days now (above 110°F)
- 7 days/yr
- Hot days in 30 yrs
- 24 days/yr
Wind risk 9/10 · Severe
- Chance of severe wind over 30 yrs
- 99.0%
Air-quality risk 3/10 · Minor
- Unhealthy air days now
- 2 days/yr
- Unhealthy air days in 30 yrs
- 3 days/yr
Risk factors via First Street. Map © Google.
Why this score? — see what drove the F grade
The composite is a weighted blend of 9 inputs, each scored 0–100. Each bar is that input's sub-score; the figure is the points it added to the 100-point composite (weight × sub-score).
- Cash flow +7.6/30.0
- Appreciation +4.7/10.0
- Schools +4.5/10.0
- ARV discount +4.2/15.0
- Livability +3.7/5.0
- 1% rule +2.7/10.0
- Rent growth +2.6/5.0
- Condition / age +2.5/5.0
- DSCR +1.7/10.0
$231,776
🖨 Deal sheet 📄 Offer letter ✓ Due diligence
Listing remarks MLS
MAJOR VALUE! SELLER WILL REPLACE THE HVAC System with a brand-new unit AT CLOSING. ALL NEW KITCHEN APPLIANCES, GARAGE DOOR, RECENT ROOF REPLACEMENT. AND HOME WARRANTY PROVIDED. Bids already obtained—move in with confidence knowing one of the biggest expenses is covered! This well-designed home offers a comfortable layout with flexible spaces that can easily adapt to everyday living, work, or hobbies. The floor plan provides a natural flow while still offering room to make each area your own. Generous front and back yards offer opportunities for outdoor enjoyment and future landscaping, with a solid exterior that provides a strong starting point for thoughtful updates over time. Select images have been AI-enhanced to help visualize potential exterior updates, landscaping ideas, driveway maintenance, and furniture placement. These images are intended to highlight possibilities while showcasing the home’s layout and potential.
Key facts
- 0.23 acre lot
- 2 garage spots
- Built 1981
Neighborhood map
What this means for you Summary
Snapshot
- This is a 3-bed/2.0-bath single-family listed at $232k.
Deal economics
- At list price, monthly cash flow is $-282 ($-3k/yr) — negative.
- To cash-flow at today's rent, offer at most $182k (21.5% below list).
- To meet the 1% rule (rent ≥ 1% of price), the offer needs to be $179k (22.9% below list).
- Recommended offer: $179k (22.9% below list) — sets the bar for 1% rule.
- Cap rate 4.8% vs local median 3.2% in Houston — top-decile yield for the area; either an underpriced asset or a hidden risk that comps aren't pricing in. Stress-test before assuming the spread holds.
Location & tenants
- Location reads 74/100 on livability (#184 in TX, #4,771 nationally) — a middle-class / working-renter tenant base. Strengths: amenities A+, cost of living A+, housing A+; Watch: schools D, crime F.
- Fort Bend ISD (suburban): math 44% / reading 53% proficiency, ranked #140 of 826 in TX (top 17%) — families likely to look elsewhere, expect single-tenant / working-renter base with shorter leases.
- Market conditions: Rents flat; 186 active listings in the ZIP; 14 comparable units currently listed for rent nearby; rentals leasing fast (median 10d on market — plan ~1-2 weeks tenant-placement turnaround); 12,093 units permitted in Fort Bend County in 2024 (815 in 5+ unit buildings).
Forward outlook
- In year one you build about $325 of equity ($2k loan paydown + $-1k appreciation (-0.6% local appreciation)).
- Fort Bend County population projected at +75% by 2050 — long-run rental-demand tailwind backs the buy-and-hold thesis.
Negotiation context
- It's been on market 62 days — a 6% lower offer ($218k) is reasonable based on typical stale-listing flexibility.
- 2 sale attempts; this cycle's ask has dropped $43k (16%) from the opening price — seller is motivated, your offer sets the floor, not the list.
Risks & watch-outs
- Climate carrying-cost: severe wind risk, 99% chance of damaging wind over 30y; extreme-heat days projected 7→24/yr by 2055 (HVAC capex compounding) — expect insurance premiums to compound above CPI over the hold.
Questions for the listing agent
- What do current leases actually rent for vs. the listed asking? Can we see a recent rent roll and the last 12 months of T-12 income?
- It's been on market 62 days. Have you received any prior offers? Is the seller open to a 23% concession, seller financing, or rate buy-down credit?
- What does the HOA fee cover, when was the last increase, and are there any pending special assessments or reserve-fund shortfalls?
- Why hasn't it sold? Are there any deal-killer items the seller is aware of (foundation, flood, title, zoning, code violations)?
- Is there a deadline driving the sale (1031 exchange, divorce, estate, relocation)? That informs how much negotiation room exists.
- Schools are D-rated, which usually means shorter tenancies and higher turnover. Who's the typical renter profile here, and what's been the actual vacancy rate?
- Crime grade is F in this area — have there been break-ins, vandalism, or insurance claims at this property in the last 3 years? What carrier currently insures it and at what premium?
- The area grade is low — what's the realistic commute time and amenity access for the typical tenant pool here? Any planned neighborhood developments (good or bad) we should know about?
- What's the average days-on-market for RENTAL listings here right now (not sales)? A rising rental-DOM trend means longer vacancies and softer asking-rent achievability than the comps imply.
- What's the recent tenant-quality profile in this submarket — average credit score on applications, eviction rate, late-payment / NSF rate, and stable-employment percentage? A property-management company in the area should have these aggregated.
- How much new for-sale + rental construction is in the pipeline within 1–3 miles? Heavy new supply typically softens prices + rents 12–24 months out; constrained supply supports both.
Investment metrics
- 1% rule
- 0.77% ✗
- Cap rate
- 4.83%
- Cash-on-cash
- -5.21%
- DSCR
- 0.77
- GRM
- 10.8
CMA / ARV
- ARV (median comp)
- $215,879
- List price
- $231,776
- Delta
- 7.36%
- Verdict
- FAIR
- Comps
- 20 within 1.0 mi
Show comp detail 12 sales within ~0.75 mi
| Address | Dist | Beds/Ba | Sqft | Sold | Price | $/sf | Match |
|---|---|---|---|---|---|---|---|
| 7423 Maczali Dr | 0.29mi | 3/2.0 | 1,475 (+3%) | 4mo | $239,999 | $163 | 78 |
| 15903 Kenbrook Dr | 0.34mi | 3/2.0 | 1,487 (+4%) | 1mo | $245,000 | $165 | 76 |
| 7539 Maczali Dr | 0.32mi | 4/2.5 (+1) | 1,404 (-2%) | 0mo | $231,660 | $165 | 75 |
| 15906 Willbriar Ln | 0.27mi | 3/2.0 | 1,320 (-8%) | 1mo | $182,500 | $138 | 74 |
| 7458 Bahia Ln | 0.38mi | 3/2.0 | 1,341 (-6%) | 1mo | $228,000 | $170 | 71 |
| 7023 Maczali Dr | 0.53mi | 3/2.0 | 1,472 (+3%) | 1mo | $189,000 | $128 | 70 |
| 2435 Buttonhill Dr | 0.70mi | 3/2.0 | 1,420 (-0%) | 3mo | $195,000 | $137 | 64 |
| 7704 Sign St | 0.57mi | 4/2.0 (+1) | 1,343 (-6%) | 3mo | $165,000 | $123 | 56 |
| 6913 Chasewood Dr | 0.58mi | 3/2.0 | 1,312 (-8%) | 4mo | $99,000 | $75 | 56 |
| 7718 Sign St | 0.60mi | 4/2.5 (+1) | 1,343 (-6%) | 2mo | $192,000 | $143 | 54 |
| 2115 Pepperglen Ct | 0.66mi | 3/2.0 | 1,590 (+11%) | 4mo | $235,000 | $148 | 47 |
| 2507 Rittenmore Dr | 0.67mi | 4/2.0 (+1) | 1,568 (+10%) | 1mo | $235,000 | $150 | 46 |
Match score weights: distance 35% · size 25% · config 20% · recency 20%. Top-matched comps best support the ARV.
Projected returns pro-forma
-0.55% appreciation · 0.34% rent growth · sell at horizon
- IRR
- -12.4%
- Equity multiple
- 0.46×
- Total profit
- $-35,252
- Equity at exit
- $60,984
- IRR
- -8.1%
- Equity multiple
- 0.26×
- Total profit
- $-47,740
- Equity at exit
- $68,438
Cash invested: $64,897 (down + closing). Projections, not guarantees.
Landlord ↔ Tenant lean methodology
- Overall (STATE)
- 87 Strongly Landlord-Friendly
- State Texas
- 87 Strongly Landlord-Friendly · R+5
- County
- — inherits STATE
- City
- — inherits STATE
ZIP-level market 77489
- Home prices YoY
- -0.2%
- Rents YoY
- 0.3%
- Active inventory
- 186
- Price-to-rent
- 10.8×
Monthly cashflow live
- Estimated rent
- $1,786 high interval (Pro) →
- Mortgage (P&I)
- −$1,215
- Tax from tax record
- −$369 /mo · $4,427/yr
- Insurance
- −$97
- HOA
- −$12
- Vacancy / Maint / Mgmt
- −$375
- Net cashflow
- $-282
Break-even live
UW: 25.0% down · 7.5% · 30yr · 1.5% tax · 5.0% vac · 8.0% maint · 8.0% mgmt
Financing live
Cash to close
- Down payment
- $57,944
- Closing costs
- $6,953
- Reserves months
- —
- Total cash needed
- —
Loan-product check · same deal, 3 products live
Conventional
25% down · 7.5% · 30yr
- Down + closing
- —
- Monthly P&I
- —
- Monthly cashflow
- —
- DSCR
- —
- Eligible?
- —
Personal DTI + credit; lowest rate.
DSCR
20% down · 8.5% · 30yr
- Down + closing
- —
- Monthly P&I
- —
- Monthly cashflow
- —
- DSCR
- —
- Eligible?
- —
No personal income docs; deal must DSCR.
Hard money
10% down · 12.0% · 12mo
- Down + closing
- —
- Monthly P&I
- —
- Monthly cashflow
- —
- DSCR
- —
- Eligible?
- —
Short-term bridge; refi at stabilization.
Rent comps 14 comps
| Address | Beds | Baths | Sqft | Rent | $/sqft | DOM | Units | Dist |
|---|---|---|---|---|---|---|---|---|
| 15703 Baybriar Dr Missouri City, TX | 3.0 | 2.0 | 1252 | $1,615 | $1.29 | 19d | 1 | 0.20mi |
| 15823 Baybriar Dr Missouri City, TX | 3.0 | 2.0 | 1335 | $1,641 | $1.23 | 5d | 1 | 0.25mi |
| 6610 Rowell Ct Missouri City, TX | 3.0 | 2.0 | 1753 | $2,056 | $1.17 | 5d | 1 | 0.88mi |
| 16310 Setter Ct Missouri City, TX | 3.0 | 2.0 | 1672 | $1,700 | $1.02 | 43d | 1 | 0.91mi |
| 6406 Summer Ridge Dr Missouri City, TX | 3.0 | 2.0 | 1624 | $1,958 | $1.21 | 2d | 1 | 1.11mi |
| 16432 Chimney Rock Rd Unit 16465 Houston, TX | 3.0 | 2.0 | 1349 | $1,524 | $1.13 | 43d | 1 | 1.13mi |
| 16432 Chimney Rock Rd Unit 16489 Houston, TX | 2.0 | 2.0 | 1026 | $1,317 | $1.28 | 43d | 1 | 1.13mi |
| 16432 Chimney Rock Rd Unit 2112 Houston, TX | 2.0 | 2.0 | 1026 | $1,284 | $1.25 | 2d | 1 | 1.13mi |
| 16432 Chimney Rock Rd Unit 2174 Houston, TX | 2.0 | 2.0 | 1026 | $1,327 | $1.29 | 10d | 1 | 1.13mi |
| 16432 Chimney Rock Rd Unit 3174 Houston, TX | 3.0 | 2.0 | 1349 | $1,513 | $1.12 | 10d | 1 | 1.13mi |
| 16432 Chimney Rock Rd Apt 424 Houston, TX | 2.0 | 2.0 | 1026 | $1,292 | $1.26 | 5d | 1 | 1.13mi |
| 16432 Chimney Rock Rd Unit 3112 Houston, TX | 3.0 | 2.0 | 1349 | $1,481 | $1.10 | 2d | 1 | 1.13mi |
| 16211 Corsair Rd Houston, TX | 3.0 | 2.0 | 1139 | $1,813 | $1.59 | 24d | 1 | 1.15mi |
| 1215 New Tree Ln Missouri City, TX | 3.0 | 2.0 | 1323 | $1,725 | $1.30 | 12d | 1 | 1.26mi |
HOA detail
- Monthly dues
- $12 · $144/yr
- Likely covers
- landscaping
Listing history 17 events
-
2026-06-18days on market $231,776 Active 62 DOM
-
2026-06-17days on market $231,776 Active 61 DOM
-
2026-06-16days on market $231,776 Active 60 DOM
-
2026-06-15days on market $231,776 Active 59 DOM
-
2026-06-13statusdays on market $231,776 Active 57 DOM
-
2026-06-09days on market $231,776 Pending 53 DOM
-
2026-06-07days on market $231,776 Pending 51 DOM
-
2026-06-04days on market $231,776 Pending 48 DOM
-
2026-06-03statusdays on market $231,776 Pending 47 DOM
-
2026-06-02days on market $231,776 Active 46 DOM
-
2026-06-01days on market $231,776 Active 45 DOM
-
2026-05-31days on market $231,776 Active 44 DOM
-
2026-04-17status Active 953-char remark
Show marketing remark (953 chars)
MAJOR VALUE! SELLER WILL REPLACE THE HVAC System with a brand-new unit AT CLOSING. ALL NEW KITCHEN APPLIANCES, GARAGE DOOR, RECENT ROOF REPLACEMENT. AND HOME WARRANTY PROVIDED. Bids already obtained—move in with confidence knowing one of the biggest expenses is covered! This well-designed home offers a comfortable layout with flexible spaces that can easily adapt to everyday living, work, or hobbies. The floor plan provides a natural flow while still offering room to make each area your own. Generous front and back yards offer opportunities for outdoor enjoyment and future landscaping, with a solid exterior that provides a strong starting point for thoughtful updates over time. Select images have been AI-enhanced to help visualize potential exterior updates, landscaping ideas, driveway maintenance, and furniture placement. These images are intended to highlight possibilities while showcasing the home’s layout and potential.
-
2026-04-16historical 953-char remark
Show marketing remark (953 chars)
MAJOR VALUE! SELLER WILL REPLACE THE HVAC System with a brand-new unit AT CLOSING. ALL NEW KITCHEN APPLIANCES, GARAGE DOOR, RECENT ROOF REPLACEMENT. AND HOME WARRANTY PROVIDED. Bids already obtained—move in with confidence knowing one of the biggest expenses is covered! This well-designed home offers a comfortable layout with flexible spaces that can easily adapt to everyday living, work, or hobbies. The floor plan provides a natural flow while still offering room to make each area your own. Generous front and back yards offer opportunities for outdoor enjoyment and future landscaping, with a solid exterior that provides a strong starting point for thoughtful updates over time. Select images have been AI-enhanced to help visualize potential exterior updates, landscaping ideas, driveway maintenance, and furniture placement. These images are intended to highlight possibilities while showcasing the home’s layout and potential.
-
2026-04-16historical $245,000 953-char remark
Show marketing remark (953 chars)
MAJOR VALUE! SELLER WILL REPLACE THE HVAC System with a brand-new unit AT CLOSING. ALL NEW KITCHEN APPLIANCES, GARAGE DOOR, RECENT ROOF REPLACEMENT. AND HOME WARRANTY PROVIDED. Bids already obtained—move in with confidence knowing one of the biggest expenses is covered! This well-designed home offers a comfortable layout with flexible spaces that can easily adapt to everyday living, work, or hobbies. The floor plan provides a natural flow while still offering room to make each area your own. Generous front and back yards offer opportunities for outdoor enjoyment and future landscaping, with a solid exterior that provides a strong starting point for thoughtful updates over time. Select images have been AI-enhanced to help visualize potential exterior updates, landscaping ideas, driveway maintenance, and furniture placement. These images are intended to highlight possibilities while showcasing the home’s layout and potential.
-
2026-03-02historical
-
2025-08-27$275,000 Active
ⓘ Source: listings_history table (triggers on properties + properties_extension) + one-shot
backfill from property_details.listing_events for pre-trigger history.
Tax reassessment forecast TX · Resets to sale price
- Current annual tax
- $4,427 · $369/mo
- Projected year-2 tax
- $4,427 · $369/mo
- Expected delta
- $0/yr ($0/mo · 0.0%)
ⓘ Screening estimate from a state-policy table — verify with the county assessor before closing.
Climate risk First Street
- Flood 1/10 Low FEMA zone X (unshaded) · 0% chance over 30 yrs
- Wildfire 2/10 Low
- Heat 9/10 Extreme 7 d/yr ≥110°F today · 24 d/yr by 30 yrs out
- Wind 9/10 Extreme 99% chance of damaging wind over 30 yrs
- Air quality 3/10 Moderate 2 unhealthy d/yr today · 3 by 30 yrs out
Nearby sold comps map
Loading sold comps map…
Walkable amenities ~0.75 mi
Loading nearby amenities…
Taxation est. · year 1
- Rental income
- $21,432
- − Mortgage interest
- −$12,983
- − Property taxes
- −$4,427
- − Insurance
- −$1,159
- − Repairs & maintenance
- −$1,715
- − Management
- −$1,715
- − HOA
- −$144
- − Depreciation
- −$6,743
- Taxable loss
- −$7,453
- Est. tax savings @ 24.0%
- +$1,789
- After-tax cash flow
- $-1,595/yr
For passive investors: Depreciation is non-cash, so a rental often shows a tax loss while cash-flowing — sheltering income. Rental losses are passive: they offset passive income freely, and up to $25,000/yr can offset ordinary (W-2) income if you actively participate and your MAGI is under $100k (phasing out to $0 by $150k); unused losses carry forward. On sale, claimed depreciation is recaptured at up to 25%, and gains may owe capital-gains tax (a 1031 exchange can defer both). Figures are a year-1 estimate at your 24.0% rate — not tax advice; consult a CPA.
Schools (NCES district)
- District
- Fort Bend ISD
- NCES district ID
- 4819650
- Math proficiency
- 44% ▼ -15.00%
- Reading proficiency
- 53% ▼ -4.00%
- Median HH income
- $82,360
- Composite
- 44.61/100
- National rank
- #2779
- State rank
- #140 of 826 in TX
Livability — Houston
- Score
- 74/100
- State rank
- #184
- US rank
- #4771
Category grades
Schools grade is shown separately in the Schools card above.
Census & demographics
- Census place
- Houston, TX
- County
- Fort Bend County · 836,777 people
- City population
- 3,226,434
- Metro
- Houston-The Woodlands-Sugar Land, TX
- Population (ZIP)
- 39,292
- Household income
- $74,689
- Rent vs Own
- Severe rent burden
- 1121.0
Population outlook (Fort Bend County) Hauer SSP2
- Today (2025)
- 1,004,526 people
- By 2030
- 1,153,104 · +14.8%
- By 2040
- 1,453,718 · +44.7%
- By 2050
- 1,753,781 · +74.6%
- By 2075
- 2,455,772 · +144.5%
- By 2100
- 2,930,528 · +191.7%
Race, ethnicity, and origin ACS 2023
- Neighborhood character
- Majority Black (60%)
- Race & ethnicity
- Black 60% Hispanic / Latino 29% Two or more races 13% White 4% Asian 3%
- Hispanic origin (detail)
- Mexican 17%
- Foreign-born
- 16% · Canada, Vietnam
- Languages at home
- 73% English-only · Spanish 22% Vietnamese 1% Other Asian/Pacific 1%
Political lean MEDSL · Fort Bend
- 2024 margin
- Toss-up / Even · D 49.5% · R 47.9% · Other 2.6%
- 2008→2024 swing
- +4.0pp toward D · 2008: -2.4pp · 2024: 1.6pp
- All cycles
- 2024: D+1.6 2020: D+10.6 2016: D+6.6 2012: R+6.8 2008: R+2.4
Not yet ingested
- Civics
- —
Market trends
- HPI YoY
- ▼ -0.55%
- Current HPI
- 288.1306
- Rent YoY
- ▲ 0.34%
- Metro
- Houston-The Woodlands-Sugar Land, TX
- State GDP YoY
- ▲ 3.95%
- F500 in state
- 110
Industry mix (Fortune 500 HQ in TX)
| Industry | F500 HQs | Revenue |
|---|---|---|
| Energy | 16 | $1,198B |
|
||
| Technology | 5 | $198B |
|
||
| Engineering / Construction | 4 | $72B |
|
||
| Energy Services | 3 | $60B |
|
||
| Utilities | 3 | $41B |
|
||
| Healthcare | 2 | $330B |
|
||
Price history
-10.9% since first listed5 events — show timeline
- 2026-04-17 Relisted — HARMLS
- 2026-04-16 Listing Removed — HARMLS
- 2026-04-16 Coming Soon $245,000 HARMLS
- 2026-03-02 Listing Removed — HARMLS
- 2025-08-27 Listed $275,000 HARMLS
Property tax history
+4.3%/yrLatest (2025): $4,427 · -0.0% YoY. Source: county tax records.
Cash-flow waterfall
monthlySold comps — $/sqft
last 12 mo · ≤1 miLoading sold comps…