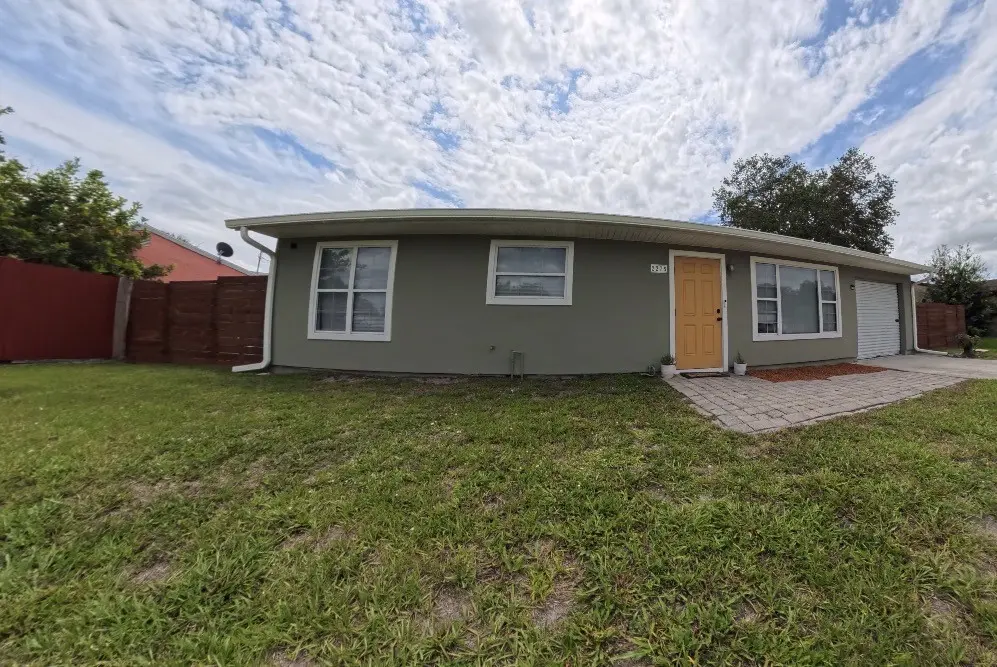
2275 18th Ave SW · Florida Ridge, FL
Flood risk 1/10 · Minimal
- FEMA flood zone
- X (unshaded)
- Chance of flooding over 30 yrs
- 0.0%
- Est. flood insurance / yr
- $507 – $1,088
Fire risk 2/10 · Minimal
- Est. fire insurance / yr
- $947 – $1,759
Heat risk 10/10 · Severe
- Hot days now (above 107°F)
- 7 days/yr
- Hot days in 30 yrs
- 25 days/yr
Wind risk 10/10 · Severe
- Chance of severe wind over 30 yrs
- 99.0%
Air-quality risk 1/10 · Minimal
- Unhealthy air days now
- 0 days/yr
- Unhealthy air days in 30 yrs
- 0 days/yr
Risk factors via First Street. Map © Google.
Why this score? — see what drove the F grade
The composite is a weighted blend of 9 inputs, each scored 0–100. Each bar is that input's sub-score; the figure is the points it added to the 100-point composite (weight × sub-score).
- Cash flow +11.0/30.0
- Schools +4.2/10.0
- ARV discount +3.9/15.0
- Livability +3.6/5.0
- Rent growth +3.5/5.0
- DSCR +3.2/10.0
- 1% rule +2.6/10.0
- Condition / age +2.5/5.0
- Appreciation +0.0/10.0
$267,000
🖨 Deal sheet (PDF) 📄 Offer letter ✓ Due diligence
Listing remarks MLS
Totally adorable and completely updated home! 3 bed, 1.5 bath with new kitchen cabinets, appliances, LED lighting and plumbing! 12x12 shed in the backyard for extra storage! Community clubhouse and pool available for additional fee.
Key facts
- Rv or boat parking
- Vegetable gardens
- Storage shed
Tags
Property features AI
Finance
- Financial info: Pets allowed
- HOA & community: No association
Exterior
- Parking: Driveway
- Utilities: Public water; Public sewer
- Home design: Single-story; Faces southwest; Has view
- Construction: Block and concrete construction; Shingle roof; Built as a single-story structure
- Exterior features: Patio; Shed(s)
Interior
- Kitchen: Dishwasher; Range; Microwave; Refrigerator
- Bedrooms: Bedroom (9 x 10); Bedroom (10 x 11); Bedroom (12 x 13)
- Flooring: Tile
- Bathrooms: 1 full bathroom; 1 half bathroom
- Heating & cooling: Central heating; Central air conditioning
- Interior features: Blinds on windows; French doors; Closet cabinetry; Furnishing negotiable
- Laundry & utility: Laundry room; Washer; Dryer
Neighborhood map
What this means for you Summary
Snapshot
- This is a 2-bed/2.0-bath single-family listed at $267k.
Deal economics
- At list price, monthly cash flow is $-113 ($-1k/yr) — negative.
- To cash-flow at today's rent, offer at most $247k (7.5% below list).
- To meet the 1% rule (rent ≥ 1% of price), the offer needs to be $202k (24.2% below list).
- Recommended offer: $202k (24.2% below list) — sets the bar for 1% rule.
- Cap rate 5.8% vs local median 4.5% in Florida Ridge — meaningfully above typical; check what's discounted (condition, days-on-market, listing class) to confirm the premium yield is real.
Location & tenants
- Location reads 72/100 on livability (#353 in FL) — a middle-class / working-renter tenant base. Strengths: commute A+, cost of living A+, housing A+; Watch: employment D, amenities F, health & safety D-.
- Indian River (other): math 48% / reading 52% proficiency, ranked #35 of 73 in FL (top 48%) — acceptable for families but not a draw, mixed tenant base, ~2y average lease.
- Zoned schools: Indian River Academy (math 53% / reading 50%, grade C-, #1,035 of 2,144 statewide, top 49%, 430 students, 81% FRL); Oslo Middle School (math 39% / reading 45%, grade D-, #340 of 571 statewide, top 61%, 864 students, 72% FRL); Vero Beach High School (math 28% / reading 43%, grade F, #367 of 667 statewide, top 57%, 2,847 students, 50% FRL).
- Market conditions: Rents rising fast (+4.2%/yr); 351 active listings in the ZIP; 6 comparable units currently listed for rent nearby; rentals at typical pace (median 23d on market — plan ~3-4 weeks tenant-placement turnaround); 564 units permitted in Indian River County in 2024 (281 in 5+ unit buildings).
- This rent runs 36% of the median local income ($67k/yr) — at the standard rent-burdened threshold; future hikes will face affordability resistance.
Forward outlook
- Local home prices are declining (-3.0%/yr); year-one equity from $2k of loan paydown is wiped out by about $8k of value loss. Plan a longer hold.
- Indian River County population projected at +18% by 2050 — long-run rental-demand tailwind backs the buy-and-hold thesis.
Negotiation context
- It's been on market 20 days — a 2% lower offer ($263k) is reasonable based on typical stale-listing flexibility.
- 3 sale attempts since 5y ago with the ask held roughly flat each time — persistent listings suggest the price (not the market) is what's stuck; bring a comps-based counter.
- Current owner paid $199k; 34% above their basis — modest negotiation headroom, anchor on the comps not their cost.
Risks & watch-outs
- Climate carrying-cost: severe wind risk, 99% chance of damaging wind over 30y; extreme-heat days projected 7→25/yr by 2055 (HVAC capex compounding) — expect insurance premiums to compound above CPI over the hold.
Questions for the listing agent
- What do current leases actually rent for vs. the listed asking? Can we see a recent rent roll and the last 12 months of T-12 income?
- Is there a deadline driving the sale (1031 exchange, divorce, estate, relocation)? That informs how much negotiation room exists.
- Schools are D-rated, which usually means shorter tenancies and higher turnover. Who's the typical renter profile here, and what's been the actual vacancy rate?
- The area grade is low — what's the realistic commute time and amenity access for the typical tenant pool here? Any planned neighborhood developments (good or bad) we should know about?
- What's the average days-on-market for RENTAL listings here right now (not sales)? A rising rental-DOM trend means longer vacancies and softer asking-rent achievability than the comps imply.
- What's the recent tenant-quality profile in this submarket — average credit score on applications, eviction rate, late-payment / NSF rate, and stable-employment percentage? A property-management company in the area should have these aggregated.
- How much new for-sale + rental construction is in the pipeline within 1–3 miles? Heavy new supply typically softens prices + rents 12–24 months out; constrained supply supports both.
Investment metrics
- 1% rule
- 0.76% ✗
- Cap rate
- 5.78%
- Cash-on-cash
- -1.82%
- DSCR
- 0.92
- GRM
- 11.0
CMA / ARV
- ARV (on-the-fly)
- $247,430
- Comps found
- 12
Show comp detail 12 sales within ~0.75 mi
| Address | Dist | Beds/Ba | Sqft | Sold | Price | $/sf | Match |
|---|---|---|---|---|---|---|---|
| 2235 18th Ave SW | 0.03mi | 3/1.0 (+1) | 1,116 (+2%) | 12mo | $200,000 | $179 | 76 |
| 2046 15th Ave | 0.37mi | 2/2.0 | 1,067 (-2%) | 7mo | $250,000 | $234 | 74 |
| 2206 13th Ave SW | 0.33mi | 3/2.0 (+1) | 1,073 (-2%) | 5mo | $238,500 | $222 | 73 |
| 2136 20th Ave SW | 0.15mi | 3/1.5 (+1) | 1,152 (+6%) | 12mo | $265,000 | $230 | 66 |
| 1355 23rd Pl SW | 0.31mi | 3/2.0 (+1) | 1,188 (+9%) | 3mo | $170,000 | $143 | 64 |
| 2365 11th Ct SW | 0.46mi | 3/2.0 (+1) | 1,176 (+8%) | 4mo | $290,000 | $247 | 57 |
| 965 Highland Dr SW | 0.69mi | 3/2.0 (+1) | 1,117 (+2%) | 5mo | $279,000 | $250 | 55 |
| 2035 13th Ave SW | 0.44mi | 2/2.0 | 1,245 (+14%) | 2mo | $280,000 | $225 | 54 |
| 6506 Kings Hwy | 0.74mi | 2/2.0 | 1,074 (-2%) | 11mo | $244,000 | $227 | 54 |
| 1375 23rd St SW | 0.28mi | 3/2.0 (+1) | 1,240 (+14%) | 11mo | $275,000 | $222 | 50 |
| 1676 17th Pl SW | 0.65mi | 2/2.0 | 960 (-12%) | 1mo | $195,000 | $203 | 49 |
| 980 24th Pl SW | 0.70mi | 3/2.0 (+1) | 1,234 (+13%) | 4mo | $350,000 | $284 | 37 |
Match score weights: distance 35% · size 25% · config 20% · recency 20%. Top-matched comps best support the ARV.
Projected returns pro-forma
-3.0% appreciation · 4.18% rent growth · sell at horizon
- IRR
- -18.1%
- Equity multiple
- 0.36×
- Total profit
- $-48,100
- Equity at exit
- $39,811
- IRR
- -8.4%
- Equity multiple
- 0.45×
- Total profit
- $-41,165
- Equity at exit
- $23,085
Cash invested: $74,760 (down + closing). Projections, not guarantees.
Landlord ↔ Tenant lean methodology
- Overall (STATE)
- 87 Strongly Landlord-Friendly
- State Florida
- 87 Strongly Landlord-Friendly · R+3
- County
- — inherits STATE
- City
- — inherits STATE
ZIP-level market 32962
- Rents YoY
- 4.2%
- Active inventory
- 351
- Price-to-rent
- 11.0×
Monthly cashflow live
- Estimated rent
- $2,024 high interval (Pro) →
- Mortgage (P&I)
- −$1,400
- Tax from tax record
- −$201 /mo · $2,406/yr
- Insurance
- −$111
- HOA
- −$0
- Vacancy / Maint / Mgmt
- −$425
- Net cashflow
- $-113
Break-even live
Sensitivity live
| Price | -10% $38 | -5% $-38 | +0% $-113 | +5% $-189 | +10% $-264 |
|---|---|---|---|---|---|
| Rent | -10% $-273 | -5% $-193 | +0% $-113 | +5% $-33 | +10% $47 |
| Rate | -1.0pp $21 | -0.5pp $-45 | base $-113 | +0.5pp $-182 | +1.0pp $-253 |
UW: 25.0% down · 7.5% · 30yr · 1.5% tax · 5.0% vac · 8.0% maint · 8.0% mgmt
Financing live
Cash to close
- Down payment
- $66,750
- Closing costs
- $8,010
- Reserves months
- —
- Total cash needed
- —
Loan-product check · same deal, 3 products live
Conventional
25% down · 7.5% · 30yr
- Down + closing
- —
- Monthly P&I
- —
- Monthly cashflow
- —
- DSCR
- —
- Eligible?
- —
Personal DTI + credit; lowest rate.
DSCR
20% down · 8.5% · 30yr
- Down + closing
- —
- Monthly P&I
- —
- Monthly cashflow
- —
- DSCR
- —
- Eligible?
- —
No personal income docs; deal must DSCR.
Hard money
10% down · 12.0% · 12mo
- Down + closing
- —
- Monthly P&I
- —
- Monthly cashflow
- —
- DSCR
- —
- Eligible?
- —
Short-term bridge; refi at stabilization.
Rent comps 6 comps
| Address | Beds | Baths | Sqft | Rent | $/sqft | DOM | Units | Dist |
|---|---|---|---|---|---|---|---|---|
| 7503 Paso Robles Blvd Fort Pierce, FL | 3.0 | 2.0 | 1260 | $2,000 | $1.59 | 25d | 1 | 0.70mi |
| 985 23rd Pl SW Vero Beach, FL | 3.0 | 2.0 | 1176 | $2,200 | $1.87 | 23d | 1 | 0.70mi |
| 7500 Pensacola Rd Fort Pierce, FL | 3.0 | 2.0 | 1125 | $2,150 | $1.91 | 15d | 1 | 0.97mi |
| 2450 8th Ave SW Vero Beach, FL | 3.0 | 2.0 | 1388 | $2,100 | $1.51 | 23d | 1 | 0.97mi |
| 6906 Ocala Ave Fort Pierce, FL | 3.0 | 2.0 | 1175 | $1,955 | $1.66 | 15d | 1 | 1.32mi |
| 7403 Winter Garden Pkwy Fort Pierce, FL | 3.0 | 2.0 | 1372 | $2,200 | $1.60 | 23d | 1 | 1.43mi |
Listing history 15 events
-
2026-06-22days on market $267,000 Active 20 DOM
-
2026-06-19days on market $267,000 Active 18 DOM
-
2026-06-18days on market $267,000 Active 17 DOM
-
2026-06-17days on market $267,000 Active 16 DOM
-
2026-06-16days on market $267,000 Active 15 DOM
-
2026-06-15days on market $267,000 Active 14 DOM
-
2026-06-14days on market $267,000 Active 12 DOM
-
2026-06-13days on market $267,000 Active 11 DOM
-
2026-06-10days on market $267,000 Active 9 DOM
-
2026-06-09days on market $267,000 Active 8 DOM
-
2026-06-08days on market $267,000 Active 7 DOM
-
2026-06-07days on market $267,000 Active 6 DOM
-
2026-06-05days on market $267,000 Active 3 DOM
-
2026-06-02remarks 535-char remark
-
2026-06-02$267,000 Active 1 DOM
ⓘ Source: listings_history table (triggers on properties + properties_extension) + one-shot
backfill from property_details.listing_events for pre-trigger history.
Tax reassessment forecast FL · Resets to sale price
- Current annual tax
- $2,406 · $201/mo
- Projected year-2 tax
- $2,406 · $201/mo
- Expected delta
- $0/yr ($0/mo · 0.0%)
ⓘ Screening estimate from a state-policy table — verify with the county assessor before closing.
Climate risk First Street
- Flood 1/10 Low FEMA zone X (unshaded) · 0% chance over 30 yrs
- Wildfire 2/10 Low
- Heat 10/10 Extreme 7 d/yr ≥107°F today · 25 d/yr by 30 yrs out
- Wind 10/10 Extreme 99% chance of damaging wind over 30 yrs
- Air quality 1/10 Low 0 unhealthy d/yr today · 0 by 30 yrs out
Nearby sold comps map
Loading sold comps map…
Walkable amenities ~0.75 mi
Loading nearby amenities…
Taxation est. · year 1
- Rental income
- $24,284
- − Mortgage interest
- −$14,956
- − Property taxes
- −$2,406
- − Insurance
- −$1,335
- − Repairs & maintenance
- −$1,943
- − Management
- −$1,943
- − Depreciation
- −$7,767
- Taxable loss
- −$6,066
- Est. tax savings @ 24.0%
- +$1,456
- After-tax cash flow
- $97/yr
For passive investors: Depreciation is non-cash, so a rental often shows a tax loss while cash-flowing — sheltering income. Rental losses are passive: they offset passive income freely, and up to $25,000/yr can offset ordinary (W-2) income if you actively participate and your MAGI is under $100k (phasing out to $0 by $150k); unused losses carry forward. On sale, claimed depreciation is recaptured at up to 25%, and gains may owe capital-gains tax (a 1031 exchange can defer both). Figures are a year-1 estimate at your 24.0% rate — not tax advice; consult a CPA.
Schools (NCES district)
- District
- Indian River
- NCES district ID
- 1200930
- Math proficiency
- 48% ▼ -9.00%
- Reading proficiency
- 52% ▼ -3.00%
- Median HH income
- $46,597
- Composite
- 42.45/100
- National rank
- #3218
- State rank
- #35 of 73 in FL
Livability — Florida Ridge
- Score
- 72/100
- State rank
- #353
- US rank
- #6129
Category grades
Schools grade is shown separately in the Schools card above.
Census & demographics
- Census place
- Florida Ridge, FL
- County
- Indian River County · 143,738 people
- City population
- 25,629
- Metro
- Sebastian-Vero Beach, FL
- Population (ZIP)
- 25,522
- Household income
- $66,664
- Rent vs Own
- Severe rent burden
- 425.0
Population outlook (Indian River County) Hauer SSP2
- Today (2025)
- 165,104 people
- By 2030
- 172,869 · +4.7%
- By 2040
- 185,640 · +12.4%
- By 2050
- 194,465 · +17.8%
- By 2075
- 211,115 · +27.9%
- By 2100
- 211,781 · +28.3%
Race, ethnicity, and origin ACS 2023
- Neighborhood character
- Predominantly White (70%)
- Race & ethnicity
- White 70% Black 13% Hispanic / Latino 12% Two or more races 5% Native American 1%
- Hispanic origin (detail)
- Mexican 1% Puerto Rican 2% Cuban 1%
- Common ancestry
- Romanian 4% Lithuanian 4% Italian 3%
- Foreign-born
- 12% · Canada, Jamaica, Dominican Republic
- Languages at home
- 85% English-only · Spanish 9% Other Indo-European 2% French/Haitian/Cajun 1%
Political lean MEDSL · Indian River
- 2024 margin
- Strong R (+27.4) · D 36.0% · R 63.4%
- 2008→2024 swing
- -12.5pp toward R · 2008: -14.8pp · 2024: -27.4pp
- All cycles
- 2024: R+27.4 2020: R+21.6 2016: R+24.5 2012: R+22.3 2008: R+14.8
Not yet ingested
- Civics
- —
Market trends
- HPI YoY
- ▼ -182.13%
- Current HPI
- 333.3274
- Rent YoY
- ▲ 4.18%
- Metro
- Sebastian-Vero Beach, FL
- State GDP YoY
- ▲ 3.28%
- F500 in state
- 36
Industry mix (Fortune 500 HQ in FL)
| Industry | F500 HQs | Revenue |
|---|---|---|
| Industrial Technology | 2 | $29B |
|
||
| Insurance | 2 | $17B |
|
||
| Retail | 1 | $60B |
|
||
| Technology Distribution | 1 | $58B |
|
||
| Homebuilding | 1 | $35B |
|
||
| Technology Manufacturing | 1 | $35B |
|
||
Price history
+641.7% since first listed13 events — show timeline
- 2026-05-31 Listed $267,000 RAIRCMLS
- 2021-05-13 Sold (Public Records) $199,000 Public Records
- 2021-04-30 Sold (MLS) $199,000 RAIRCMLS
- 2021-04-12 Contingent — RAIRCMLS
- 2021-03-30 Relisted — RAIRCMLS
- 2021-03-30 Price Changed $199,900 RAIRCMLS
- 2021-03-04 Contingent — RAIRCMLS
- 2021-01-29 Listed $205,000 RAIRCMLS
- 2021-01-25 Coming Soon $205,000 RAIRCMLS
- 2007-10-01 Sold (Public Records) $88,600 Public Records
- 2004-12-30 Sold (Public Records) $85,000 Public Records
- 1999-03-11 Sold (Public Records) $43,000 Public Records
- 1988-08-01 Sold (Public Records) $36,000 Public Records
Property tax history
+10.3%/yrLatest (2025): $2,406 · +13.3% YoY. Source: county tax records.
Cash-flow waterfall
monthlySold comps — $/sqft
last 12 mo · ≤1 miLoading sold comps…