 17-Plex
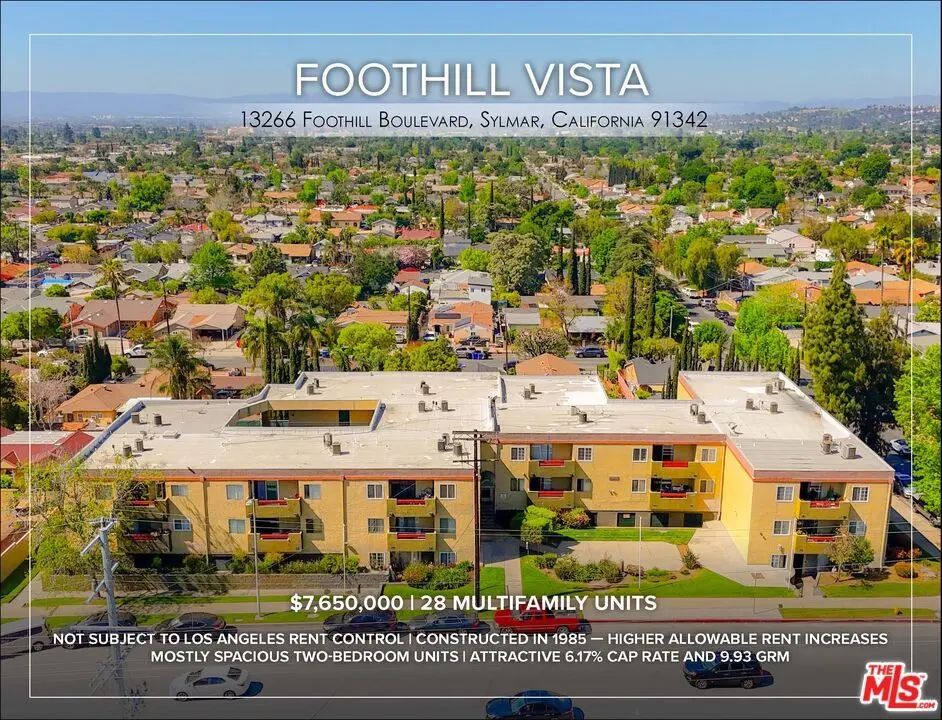
13266 Foothill Blvd · Los Angeles, CA
Flood risk 1/10 · Minimal
- FEMA flood zone
- X (unshaded)
- Chance of flooding over 30 yrs
- 0.0%
- Est. flood insurance / yr
- $507 – $1,088
Fire risk 7/10 · Major
- Est. fire insurance / yr
- $659 – $1,223
Heat risk 6/10 · Moderate
- Hot days now (above 100°F)
- 7 days/yr
- Hot days in 30 yrs
- 21 days/yr
Wind risk 1/10 · Minimal
- Chance of severe wind over 30 yrs
- —
Air-quality risk 7/10 · Major
- Unhealthy air days now
- 13 days/yr
- Unhealthy air days in 30 yrs
- 16 days/yr
Risk factors via First Street. Map © Google.
Why this score? — see what drove the D- grade
The composite is a weighted blend of 9 inputs, each scored 0–100. Each bar is that input's sub-score; the figure is the points it added to the 100-point composite (weight × sub-score).
- Cash flow +12.9/30.0
- ARV discount +7.5/15.0
- DSCR +3.9/10.0
- Schools +3.6/10.0
- 1% rule +3.4/10.0
- Livability +3.4/5.0
- Rent growth +2.5/5.0
- Condition / age +2.5/5.0
- Appreciation +0.0/10.0
$7,650,000
🖨 Deal sheet 📄 Offer letter ✓ Due diligence
Multi-family units
County records classify this as Multi-Family (5+ Unit). Listing-text estimate: 17 units. confirmed
5+ unit building — per-unit beds/baths from public records are typically unavailable; the breakdown below (if shown) is an estimate from the listing text.
Listing remarks MLS
Because the property was constructed in 1985, it is not subject to restrictive Los Angeles rent control. Instead, an owner is allowed to implement higher annual rent increases under California AB 1482. This could allow the investment's income to maintain pace with future rent growth, ensuring that the asset's cash flow is maximized. Available at an already attractive 6.17% current CAP Rate and 9.93 GRM, the property offers income growth through both rent upside and expansion of the existing RUBS collections. The building's excellent unit mix, consisting primarily of two- bedroom apartments, coupled with amenities such as central air/heat, stainless steel appliances, and ample garage parking, makes it a desirable asset for tenants and landlords alike. The building is not on the Los Angeles Department of Building and Safety's seismic retrofit list (Buyer to verify), allowing an investor to avoid an otherwise burdensome capital expense. The on- site garage parking area can accommodate 48 vehicles, while street parking is more readily available because the building is surrounded primarily by single-family residences. Located on a large corner lot along one of the San Fernando Valley's major streets, the property provides excellent visibility when attracting prospective tenants. Residents enjoy convenient access to the 210 Freeway, as well as numerous public transportation depots in the immediate area. The upcoming East San Fernando Valley Light Rail Transit Project is planned to start in Sylmar and extend the entire distance south to the Metro Orange Line, connecting the neighborhood to the majority of the Los Angeles metro area.
Key facts
- 0.55 acre lot
- 48 parking spots
- Built 1985
Neighborhood map
What this means for you Summary
Snapshot
- This is a 17 × 3-bed/?-bath units multifamily listed at $7.65M.
Deal economics
- At list price, monthly cash flow is $-558 ($-7k/yr) — negative. Per door: $-33/mo.
- To cash-flow at today's rent, offer at most $7.55M (1.3% below list).
- To meet the 1% rule (rent ≥ 1% of price), the offer needs to be $6.45M (15.8% below list).
- Recommended offer: $6.45M (15.8% below list) — sets the bar for 1% rule.
- Cap rate 6.2% vs local median 2.1% in Los Angeles — top-decile yield for the area; either an underpriced asset or a hidden risk that comps aren't pricing in. Stress-test before assuming the spread holds.
Location & tenants
- Location reads 68/100 on livability (#273 in CA) — a middle-class / working-renter tenant base. Strengths: amenities A+, commute A+, employment B; Watch: health & safety C-, schools D+, crime F.
- Los Angeles Unified (urban): math 29% / reading 54% proficiency, ranked #223 of 517 in CA (top 43%) — families likely to look elsewhere, expect single-tenant / working-renter base with shorter leases; 67% free/reduced lunch — lower-income household profile, screen leases tightly.
- Market conditions: Rents flat; 183 active listings in the ZIP; solid renter incomes; 19,697 units permitted in Los Angeles County in 2024 (9,426 in 5+ unit buildings).
- At $64,450/mo this rent would consume 788% of the median local household income ($98k/yr) (locally 2559% of renters already pay >50% of income on rent) — very limited rent-growth headroom before tenants either downsize or default.
Forward outlook
- Local home prices are declining (-3.0%/yr); year-one equity from $53k of loan paydown is wiped out by about $230k of value loss. Plan a longer hold.
- Los Angeles County population projected at +9% by 2050 — modest demand growth; plan on rents tracking national, not racing it.
Negotiation context
- It's been on market 72 days — a 6% lower offer ($7.19M) is reasonable based on typical stale-listing flexibility.
- 9 sale attempts since 5y ago with the ask held roughly flat each time — persistent listings suggest the price (not the market) is what's stuck; bring a comps-based counter.
- Current owner paid $3.03M; list at $7.65M implies a 152% gain — meaningful room to come down on a strong offer.
Risks & watch-outs
- Climate carrying-cost: major wildfire risk; extreme-heat days projected 7→21/yr by 2055 (HVAC capex compounding) — expect insurance premiums to compound above CPI over the hold.
Questions for the listing agent
- What do current leases actually rent for vs. the listed asking? Can we see a recent rent roll and the last 12 months of T-12 income?
- It's been on market 72 days. Have you received any prior offers? Is the seller open to a 16% concession, seller financing, or rate buy-down credit?
- Can we see the unit-by-unit rent roll, current vacancy, and any below-market leases? What's the average tenancy length?
- What capital expenditures (roof, boiler, parking lot, exteriors) have been made in the last 5 years, and what's planned in the next 2?
- Why hasn't it sold? Are there any deal-killer items the seller is aware of (foundation, flood, title, zoning, code violations)?
- Is there a deadline driving the sale (1031 exchange, divorce, estate, relocation)? That informs how much negotiation room exists.
- Schools are D-rated, which usually means shorter tenancies and higher turnover. Who's the typical renter profile here, and what's been the actual vacancy rate?
- Crime grade is F in this area — have there been break-ins, vandalism, or insurance claims at this property in the last 3 years? What carrier currently insures it and at what premium?
- The area grade is low — what's the realistic commute time and amenity access for the typical tenant pool here? Any planned neighborhood developments (good or bad) we should know about?
- What's the average days-on-market for RENTAL listings here right now (not sales)? A rising rental-DOM trend means longer vacancies and softer asking-rent achievability than the comps imply.
- What's the recent tenant-quality profile in this submarket — average credit score on applications, eviction rate, late-payment / NSF rate, and stable-employment percentage? A property-management company in the area should have these aggregated.
- How much new apartment / multifamily construction is in the pipeline within 1–3 miles? Heavy new supply (>2% of stock underway) typically softens rents 12–24 months out; light construction supports rent growth.
Investment metrics
- 1% rule
- 0.84% ✗
- Cap rate
- 6.21%
- Cash-on-cash
- -0.31%
- DSCR
- 0.99
- GRM
- 9.9
CMA / ARV
No comps found within radius.
Projected returns pro-forma
-3.0% appreciation · 0.02% rent growth · sell at horizon
- IRR
- -20.1%
- Equity multiple
- 0.32×
- Total profit
- $-1,462,688
- Equity at exit
- $1,140,640
- IRR
- -21.2%
- Equity multiple
- 0.05×
- Total profit
- $-2,044,450
- Equity at exit
- $661,432
Cash invested: $2,142,000 (down + closing). Projections, not guarantees.
Landlord ↔ Tenant lean methodology
- Overall (CITY)
- 0 Strongly Tenant-Friendly
- State California
- 18 Strongly Tenant-Friendly · D+13
- County
- — inherits STATE
- City Los Angeles
- 0 Strongly Tenant-Friendly · D+22
ZIP-level market 91342
- Rents YoY
- 0.0%
- Active inventory
- 183
- Price-to-rent
- 168.2×
Monthly cashflow live
- Estimated rent
- $64,450 high interval (Pro) →
- Mortgage (P&I)
- −$40,117
- Tax from tax record
- −$8,168 /mo · $98,019/yr
- Insurance
- −$3,188
- HOA
- −$0
- Vacancy / Maint / Mgmt
- −$13,534
- Net cashflow
- $-558
Break-even live
17-unit breakdown (identical units grouped — click to expand)
| Units | Beds | Baths | Est. rent |
|---|---|---|---|
| 17× units | 3 | — | $64,447 |
| #1 | 3 | — | $3,791 |
| #2 | 3 | — | $3,791 |
| #3 | 3 | — | $3,791 |
| #4 | 3 | — | $3,791 |
| #5 | 3 | — | $3,791 |
| #6 | 3 | — | $3,791 |
| #7 | 3 | — | $3,791 |
| #8 | 3 | — | $3,791 |
| #9 | 3 | — | $3,791 |
| #10 | 3 | — | $3,791 |
| #11 | 3 | — | $3,791 |
| #12 | 3 | — | $3,791 |
| #13 | 3 | — | $3,791 |
| #14 | 3 | — | $3,791 |
| #15 | 3 | — | $3,791 |
| #16 | 3 | — | $3,791 |
| #17 | 3 | — | $3,791 |
| Total (17 units) | $64,450 | ||
UW: 25.0% down · 7.5% · 30yr · 1.5% tax · 5.0% vac · 8.0% maint · 8.0% mgmt
Financing live
Cash to close
- Down payment
- $1,912,500
- Closing costs
- $229,500
- Reserves months
- —
- Total cash needed
- —
Loan-product check · same deal, 3 products live
Conventional
25% down · 7.5% · 30yr
- Down + closing
- —
- Monthly P&I
- —
- Monthly cashflow
- —
- DSCR
- —
- Eligible?
- —
Personal DTI + credit; lowest rate.
DSCR
20% down · 8.5% · 30yr
- Down + closing
- —
- Monthly P&I
- —
- Monthly cashflow
- —
- DSCR
- —
- Eligible?
- —
No personal income docs; deal must DSCR.
Hard money
10% down · 12.0% · 12mo
- Down + closing
- —
- Monthly P&I
- —
- Monthly cashflow
- —
- DSCR
- —
- Eligible?
- —
Short-term bridge; refi at stabilization.
Listing history 37 events
-
2026-06-18days on market $7,650,000 Active 72 DOM
-
2026-06-17days on market $7,650,000 Active 71 DOM
-
2026-06-16days on market $7,650,000 Active 70 DOM
-
2026-06-15days on market $7,650,000 Active 69 DOM
-
2026-06-13days on market $7,650,000 Active 67 DOM
-
2026-06-09days on market $7,650,000 Active 63 DOM
-
2026-06-08days on market $7,650,000 Active 62 DOM
-
2026-06-07days on market $7,650,000 Active 61 DOM
-
2026-06-04days on market $7,650,000 Active 58 DOM
-
2026-06-03days on market $7,650,000 Active 57 DOM
-
2026-06-02days on market $7,650,000 Active 56 DOM
-
2026-06-01days on market $7,650,000 Active 55 DOM
-
2026-05-31days on market $7,650,000 Active 54 DOM
-
2026-04-07$7,650,000 Active 1653-char remark
Show marketing remark (1653 chars)
Because the property was constructed in 1985, it is not subject to restrictive Los Angeles rent control. Instead, an owner is allowed to implement higher annual rent increases under California AB 1482. This could allow the investment's income to maintain pace with future rent growth, ensuring that the asset's cash flow is maximized. Available at an already attractive 6.17% current CAP Rate and 9.93 GRM, the property offers income growth through both rent upside and expansion of the existing RUBS collections. The building's excellent unit mix, consisting primarily of two- bedroom apartments, coupled with amenities such as central air/heat, stainless steel appliances, and ample garage parking, makes it a desirable asset for tenants and landlords alike. The building is not on the Los Angeles Department of Building and Safety's seismic retrofit list (Buyer to verify), allowing an investor to avoid an otherwise burdensome capital expense. The on- site garage parking area can accommodate 48 vehicles, while street parking is more readily available because the building is surrounded primarily by single-family residences. Located on a large corner lot along one of the San Fernando Valley's major streets, the property provides excellent visibility when attracting prospective tenants. Residents enjoy convenient access to the 210 Freeway, as well as numerous public transportation depots in the immediate area. The upcoming East San Fernando Valley Light Rail Transit Project is planned to start in Sylmar and extend the entire distance south to the Metro Orange Line, connecting the neighborhood to the majority of the Los Angeles metro area.
-
2025-04-07historical
-
2025-02-28status Active
-
2025-01-31historical Active Under Contract
-
2025-01-25price $7,400,000
-
2025-01-06$7,600,000 Active
-
2024-09-05historical $2,495
-
2024-09-05$2,495
-
2024-09-03historical
-
2024-05-22$7,800,000 Active
-
2024-04-10historical $2,499
-
2024-03-13$2,499
-
2024-02-01historical $995
-
2024-01-21price $995
-
2024-01-18$1,995
-
2023-12-26historical $1,850
-
2023-12-24$1,850
-
2021-06-01soldstatus $3,034,500
-
2021-05-28soldstatus $7,300,000 Sold
-
2021-03-30historical Backup Offers Accepted
-
2021-03-18$7,500,000 Active
-
2015-06-17soldstatus $5,100,000
-
1999-12-01soldstatus $1,250,000
-
1997-03-31soldstatus $870,000
ⓘ Source: listings_history table (triggers on properties + properties_extension) + one-shot
backfill from property_details.listing_events for pre-trigger history.
Tax reassessment forecast CA · Resets to sale price
- Current annual tax
- $98,019 · $8,168/mo
- Projected year-2 tax
- $98,019 · $8,168/mo
- Expected delta
- $0/yr ($0/mo · 0.0%)
ⓘ Screening estimate from a state-policy table — verify with the county assessor before closing.
Climate risk First Street
- Flood 1/10 Low FEMA zone X (unshaded) · 0% chance over 30 yrs
- Wildfire 7/10 Severe
- Heat 6/10 Major 7 d/yr ≥100°F today · 21 d/yr by 30 yrs out
- Wind 1/10 Low
- Air quality 7/10 Severe 13 unhealthy d/yr today · 16 by 30 yrs out
Nearby sold comps map
Loading sold comps map…
Walkable amenities ~0.75 mi
Loading nearby amenities…
Taxation est. · year 1
- Rental income
- $773,400
- − Mortgage interest
- −$428,519
- − Property taxes
- −$98,019
- − Insurance
- −$38,250
- − Repairs & maintenance
- −$61,872
- − Management
- −$61,872
- − Depreciation
- −$222,545
- Taxable loss
- −$137,677
- Est. tax savings @ 24.0%
- +$33,043
- After-tax cash flow
- $26,350/yr
For passive investors: Depreciation is non-cash, so a rental often shows a tax loss while cash-flowing — sheltering income. Rental losses are passive: they offset passive income freely, and up to $25,000/yr can offset ordinary (W-2) income if you actively participate and your MAGI is under $100k (phasing out to $0 by $150k); unused losses carry forward. On sale, claimed depreciation is recaptured at up to 25%, and gains may owe capital-gains tax (a 1031 exchange can defer both). Figures are a year-1 estimate at your 24.0% rate — not tax advice; consult a CPA.
Schools (NCES district)
- District
- Los Angeles Unified
- NCES district ID
- 0622710
- Math proficiency
- 29% ▼ -4.00%
- Reading proficiency
- 54% ▲ 10.00%
- Median HH income
- $50,403
- Composite
- 35.67/100
- National rank
- #4875
- State rank
- #223 of 517 in CA
Livability — Los Angeles
- Score
- 68/100
- State rank
- #273
- US rank
- #9237
Category grades
Schools grade is shown separately in the Schools card above.
Census & demographics
- Census place
- Los Angeles, CA
- County
- Los Angeles County · 9,444,647 people
- City population
- 3,838,149
- Metro
- Los Angeles-Long Beach-Anaheim, CA
- Population (ZIP)
- 93,301
- Household income
- $98,118
- Rent vs Own
- Severe rent burden
- 2559.0
Population outlook (Los Angeles County) Hauer SSP2
- Today (2025)
- 10,940,515 people
- By 2030
- 11,256,481 · +2.9%
- By 2040
- 11,729,929 · +7.2%
- By 2050
- 11,948,407 · +9.2%
- By 2075
- 11,818,114 · +8.0%
- By 2100
- 10,842,928 · -0.9%
Race, ethnicity, and origin ACS 2023
- Neighborhood character
- Predominantly Hispanic (74%)
- Race & ethnicity
- Hispanic / Latino 74% Two or more races 23% White 12% Asian 7% Black 3% Native American 2%
- Hispanic origin (detail)
- Mexican 59%
- Common ancestry
- Italian 1%
- Foreign-born
- 36% · Canada, South Korea, Dominican Republic
- Languages at home
- 32% English-only · Spanish 59% Tagalog/Filipino 4% Other Indo-European 3%
Political lean MEDSL · Los Angeles
- 2024 margin
- Solid D (+32.9) · D 64.8% · R 31.9% · Other 3.3%
- 2008→2024 swing
- -7.4pp toward R · 2008: 40.4pp · 2024: 32.9pp
- All cycles
- 2024: D+32.9 2020: D+44.2 2016: D+48.0 2012: D+40.0 2008: D+40.4
Not yet ingested
- Civics
- —
Market trends
- HPI YoY
- ▼ -921.77%
- Current HPI
- 440.1462
- Rent YoY
- ▬ 0.02%
- Metro
- Los Angeles-Long Beach-Anaheim, CA
- State GDP YoY
- ▲ 3.21%
- F500 in state
- 116
Industry mix (Fortune 500 HQ in CA)
| Industry | F500 HQs | Revenue |
|---|---|---|
| Technology | 27 | $1,492B |
|
||
| Financial Services | 3 | $174B |
|
||
| Retail | 3 | $44B |
|
||
| Insurance | 3 | $26B |
|
||
| Media / Entertainment | 2 | $115B |
|
||
| Pharmaceuticals / Biotech | 2 | $62B |
|
||
Price history
+779.3% since first listed24 events — show timeline
- 2026-04-07 Listed $7,650,000 TheMLS
- 2025-04-07 Listing Removed — CRMLS
- 2025-02-28 Relisted — CRMLS
- 2025-01-31 Contingent — CRMLS
- 2025-01-25 Price Changed $7,400,000 CRMLS
- 2025-01-06 Listed $7,600,000 CRMLS
- 2024-09-05 Rental Removed $2,495 APPFOLIO
- 2024-09-05 Listed for Rent $2,495 APPFOLIO
- 2024-09-03 Listing Removed — CRMLS
- 2024-05-22 Listed $7,800,000 CRMLS
- 2024-04-10 Rental Removed $2,499 APPFOLIO
- 2024-03-13 Listed for Rent $2,499 APPFOLIO
- 2024-02-01 Rental Removed $995 APPFOLIO
- 2024-01-21 Price Changed $995 APPFOLIO
- 2024-01-18 Listed for Rent $1,995 APPFOLIO
- 2023-12-26 Rental Removed $1,850 APPFOLIO
- 2023-12-24 Listed for Rent $1,850 APPFOLIO
- 2021-06-01 Sold (Public Records) $3,034,500 Public Records
- 2021-05-28 Sold (MLS) $7,300,000 TheMLS
- 2021-03-30 Contingent — TheMLS
- 2021-03-18 Listed $7,500,000 TheMLS
- 2015-06-17 Sold (Public Records) $5,100,000 Public Records
- 1999-12-01 Sold (Public Records) $1,250,000 Public Records
- 1997-03-31 Sold (Public Records) $870,000 Public Records
Property tax history
+9.7%/yrLatest (2025): $98,019 · +1.4% YoY. Source: county tax records.
Cash-flow waterfall
monthlySold comps — $/sqft
last 12 mo · ≤1 miLoading sold comps…