135 Cotton Leaf Blvd · Summerville, SC
Flood risk No data
- FEMA flood zone
- —
- Chance of flooding over 30 yrs
- —
- Est. flood insurance / yr
- —
Fire risk No data
- Est. fire insurance / yr
- —
Heat risk No data
- Hot days now (above threshold)
- —
- Hot days in 30 yrs
- —
Wind risk No data
- Chance of severe wind over 30 yrs
- —
Air-quality risk No data
- Unhealthy air days now
- —
- Unhealthy air days in 30 yrs
- —
Risk factors via First Street. Map © Google.
Why this score? — see what drove the C grade
The composite is a weighted blend of 9 inputs, each scored 0–100. Each bar is that input's sub-score; the figure is the points it added to the 100-point composite (weight × sub-score).
- Cash flow +16.9/30.0
- ARV discount +15.0/15.0
- DSCR +5.3/10.0
- 1% rule +4.6/10.0
- Condition / age +4.0/5.0
- Schools +3.6/10.0
- Rent growth +3.2/5.0
- Livability +3.2/5.0
- Appreciation +0.0/10.0
$229,990
🖨 Deal sheet 📄 Offer letter ✓ Due diligence
Listing remarks
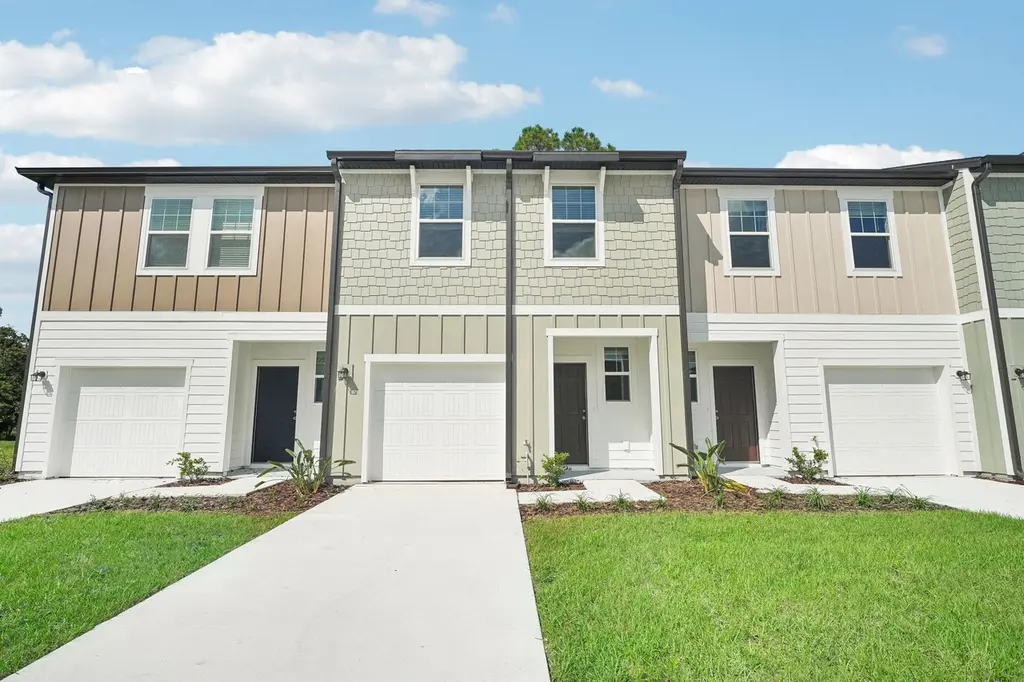
From the front porch, you enter the home and are immediately greeted by the staircase leading to the second floor, along with access to the one-car garage. Continuing toward the back of the home, you'll find the kitchen, a powder bath, and the open family room. A back patio is located just off the family room, offering space to relax outdoors. Upstairs, the second floor features an additional bedroom with its own walk-in closet and private bath, as well as a conveniently located laundry room. The primary bedroom completes the layout, offering a spacious walk-in closet and a well-appointed primary bath.
Key facts
- Walk-in closet
- Private bath
- Laundry room
Tags
Property features AI
Finance
- Other: Active listing; List price $229,990
Exterior
- Parking: 1 parking space (total)
- Utilities: Electric service; Central air; Heat pump
- Home design: Spec new construction (Plan: Nebula)
- Exterior features: Living area approximately 1386
Interior
- Kitchen: Includes dishwasher, disposal and microwave
- Bedrooms: 2 bedrooms
- Bathrooms: 2 full bathrooms
- Heating & cooling: Electric heating with heat pump; Central air conditioning
- Interior features: Dishwasher, Disposal, Microwave
Neighborhood map
What this means for you Summary
Snapshot
- This is a 2-bed/2.0-bath townhouse listed at $230k. Condition is rated good.
Deal economics
- At list price, monthly cash flow is $153 ($2k/yr) — positive.
- The deal already cash-flows at list — no discount required.
- To meet the 1% rule (rent ≥ 1% of price), the offer needs to be $221k (4.1% below list).
- Recommended offer: $221k (4.1% below list) — sets the bar for 1% rule.
- Cap rate 7.1% vs local median 4.0% in Summerville — top-decile yield for the area; either an underpriced asset or a hidden risk that comps aren't pricing in. Stress-test before assuming the spread holds.
Location & tenants
- Location reads 63/100 on livability (#167 in SC) — a middle-class / working-renter tenant base. Strengths: housing A+, schools B+, cost of living B+; Watch: amenities F, commute F, health & safety F.
- Berkeley 01 (suburban): math 35% / reading 48% proficiency, ranked #30 of 80 in SC (top 38%) — families likely to look elsewhere, expect single-tenant / working-renter base with shorter leases.
- Market conditions: Rents rising (+2.8%/yr); 642 active listings in the ZIP; 16 comparable units currently listed for rent nearby; rentals leasing fast (median 3d on market — plan ~1-2 weeks tenant-placement turnaround); solid renter incomes; 3,183 units permitted in Berkeley County in 2024 (580 in 5+ unit buildings).
- This rent runs 32% of the median local income ($83k/yr) — at the standard rent-burdened threshold; future hikes will face affordability resistance.
Forward outlook
- Local home prices are declining (-3.0%/yr); year-one equity from $2k of loan paydown is wiped out by about $7k of value loss. Plan a longer hold.
- Berkeley County population projected at +48% by 2050 — long-run rental-demand tailwind backs the buy-and-hold thesis.
Negotiation context
- Only 4 days on market — expect competitive offers; lowballing is unlikely to land.
Questions for the listing agent
- Is there a deadline driving the sale (1031 exchange, divorce, estate, relocation)? That informs how much negotiation room exists.
- Schools are B-rated — typically a magnet for longer-tenancy family renters. What's the average tenant stay here, and is there a school-zone premium baked into asking?
- What's the average days-on-market for RENTAL listings here right now (not sales)? A rising rental-DOM trend means longer vacancies and softer asking-rent achievability than the comps imply.
- What's the recent tenant-quality profile in this submarket — average credit score on applications, eviction rate, late-payment / NSF rate, and stable-employment percentage? A property-management company in the area should have these aggregated.
- How much new for-sale + rental construction is in the pipeline within 1–3 miles? Heavy new supply typically softens prices + rents 12–24 months out; constrained supply supports both.
Investment metrics
- 1% rule
- 0.96% ✗
- Cap rate
- 7.09%
- Cash-on-cash
- 2.85%
- DSCR
- 1.13
- GRM
- 8.7
CMA / ARV
- ARV (on-the-fly)
- $288,288
- Comps found
- 12
Show comp detail 12 sales within ~0.75 mi
| Address | Dist | Beds/Ba | Sqft | Sold | Price | $/sf | Match |
|---|---|---|---|---|---|---|---|
| 160 Cotton Leaf Blvd | 0.06mi | 2/2.5 | 1,386 (0%) | 4mo | $289,990 | $209 | 92 |
| 159 Cotton Leaf Blvd | 0.05mi | 2/2.5 | 1,387 (+0%) | 4mo | $287,990 | $208 | 92 |
| 183 Cotton Leaf Blvd | 0.11mi | 2/2.5 | 1,387 (+0%) | 4mo | $289,000 | $208 | 89 |
| 151 Cotton Leaf Blvd #55 | 0.03mi | 3/2.5 (+1) | 1,386 (0%) | 2mo | $292,990 | $211 | 89 |
| 158 Cotton Leaf Blvd | 0.06mi | 3/2.5 (+1) | 1,386 (0%) | 4mo | $287,990 | $208 | 87 |
| 185 Cotton Leaf Blvd #38 | 0.11mi | 3/2.5 (+1) | 1,386 (0%) | 2mo | $260,000 | $188 | 86 |
| 163 Cotton Leaf Blvd | 0.06mi | 3/2.5 (+1) | 1,386 (0%) | 5mo | $284,990 | $206 | 86 |
| 167 Cotton Leaf Blvd | 0.07mi | 3/2.5 (+1) | 1,386 (0%) | 4mo | $299,990 | $216 | 86 |
| 175 Cotton Leaf Blvd | 0.09mi | 3/2.5 (+1) | 1,386 (0%) | 4mo | $276,490 | $199 | 86 |
| 179 Cotton Leaf Blvd | 0.10mi | 3/2.5 (+1) | 1,387 (+0%) | 3mo | $286,690 | $207 | 85 |
| 184 Cotton Leaf Blvd | 0.11mi | 3/2.5 (+1) | 1,386 (0%) | 4mo | $293,990 | $212 | 85 |
| 205 Cozy Brook Ct | 0.58mi | 3/2.5 (+1) | 1,584 (+14%) | 3mo | $312,700 | $197 | 40 |
Match score weights: distance 35% · size 25% · config 20% · recency 20%. Top-matched comps best support the ARV.
Projected returns pro-forma
-3.0% appreciation · 2.77% rent growth · sell at horizon
- IRR
- -12.1%
- Equity multiple
- 0.56×
- Total profit
- $-28,019
- Equity at exit
- $34,292
- IRR
- -3.2%
- Equity multiple
- 0.79×
- Total profit
- $-13,821
- Equity at exit
- $19,885
Cash invested: $64,397 (down + closing). Projections, not guarantees.
Landlord ↔ Tenant lean methodology
- Overall (STATE)
- 90 Strongly Landlord-Friendly
- State South Carolina
- 90 Strongly Landlord-Friendly · R+6
- County
- — inherits STATE
- City
- — inherits STATE
ZIP-level market 29461
- Home prices YoY
- -13.9%
- Rents YoY
- 2.8%
- Active inventory
- 642
- Price-to-rent
- 8.7×
Monthly cashflow live
- Estimated rent
- $2,205 high interval (Pro) →
- Mortgage (P&I)
- −$1,206
- Tax est. 1.5%
- −$287 /mo · $3,450/yr
- Insurance
- −$96
- HOA
- −$0
- Vacancy / Maint / Mgmt
- −$463
- Net cashflow
- $153
Break-even live
UW: 25.0% down · 7.5% · 30yr · 1.5% tax · 5.0% vac · 8.0% maint · 8.0% mgmt
Financing live
Cash to close
- Down payment
- $57,498
- Closing costs
- $6,900
- Reserves months
- —
- Total cash needed
- —
Loan-product check · same deal, 3 products live
Conventional
25% down · 7.5% · 30yr
- Down + closing
- —
- Monthly P&I
- —
- Monthly cashflow
- —
- DSCR
- —
- Eligible?
- —
Personal DTI + credit; lowest rate.
DSCR
20% down · 8.5% · 30yr
- Down + closing
- —
- Monthly P&I
- —
- Monthly cashflow
- —
- DSCR
- —
- Eligible?
- —
No personal income docs; deal must DSCR.
Hard money
10% down · 12.0% · 12mo
- Down + closing
- —
- Monthly P&I
- —
- Monthly cashflow
- —
- DSCR
- —
- Eligible?
- —
Short-term bridge; refi at stabilization.
Rent comps 16 comps
| Address | Beds | Baths | Sqft | Rent | $/sqft | DOM | Units | Dist |
|---|---|---|---|---|---|---|---|---|
| 391 Tiliwa St Summerville, SC | 3.0 | 2.5 | 1786 | $2,295 | $1.28 | 3d | 1 | 0.20mi |
| 402 Tiliwa St Summerville, SC | 3.0 | 2.5 | 1785 | $2,295 | $1.29 | 3d | 1 | 0.25mi |
| 753 Ridgley Dr Summerville, SC | 3.0 | 2.5 | 1786 | $2,295 | $1.28 | 21d | 1 | 0.38mi |
| 755 Ridgley Dr Unit 755 Summerville, SC | 3.0 | 2.5 | 1796 | $2,500 | $1.39 | 3d | 1 | 0.39mi |
| 704 Ladywood Dr Summerville, SC | 3.0 | 2.0 | 1618 | $2,350 | $1.45 | 3d | 1 | 0.57mi |
| 44000 Owl Wood Ln Summerville, SC | 1.0–3.0 | 1.0–2.0 | 1086 | $1,755 | $1.62 | 3d | 14 | 0.61mi |
| 900 Emblem St Summerville, SC | 1.0–3.0 | 1.0–2.0 | 1086 | $1,784 | $1.64 | 2d | 21 | 0.74mi |
| 5101 Evado Ln Summerville, SC | 3.0 | 1.0–2.0 | 859 | $1,894 | $2.20 | 2d | 19 | 0.77mi |
| 608 Ladywood Dr Summerville, SC | 3.0 | 2.0 | 1618 | $2,200 | $1.36 | 11d | 1 | 0.83mi |
| 130 Lucky Day Dr Summerville, SC | 3.0 | 2.0 | 1547 | $2,100 | $1.36 | 2d | 1 | 0.89mi |
| 844 Lilyford Ln , SC | 3.0 | 2.5 | 1518 | $2,300 | $1.52 | 23d | 1 | 1.07mi |
| 900 Owl Wood Ln Summerville, SC | 3.0 | 2.0 | 1311 | $2,273 | $1.73 | 3d | 1 | 1.14mi |
| 900 Owl Wood Ln Summerville, SC | 2.0 | 2.0 | 1157 | $2,385 | $2.06 | 23d | 1 | 1.14mi |
| 175 Lyra Ln Summerville, SC | 3.0–4.0 | 2.0–3.0 | 2082 | $2,200 | $1.06 | 3d | 3 | 1.29mi |
| 310 Surfbird Rd Summerville, SC | 3.0 | 2.5 | 1761 | $2,350 | $1.33 | 10d | 1 | 1.34mi |
| 495 Pender Woods Dr Summerville, SC | 3.0 | 2.0 | 1418 | $2,175 | $1.53 | 23d | 1 | 1.42mi |
Listing history 1 events
-
2026-05-31days on market $229,990 Active 4 DOM
ⓘ Source: listings_history table (triggers on properties + properties_extension) + one-shot
backfill from property_details.listing_events for pre-trigger history.
Nearby sold comps map
Loading sold comps map…
Walkable amenities ~0.75 mi
Loading nearby amenities…
Taxation est. · year 1
- Rental income
- $26,462
- − Mortgage interest
- −$12,883
- − Property taxes
- −$3,450
- − Insurance
- −$1,150
- − Repairs & maintenance
- −$2,117
- − Management
- −$2,117
- − Depreciation
- −$6,691
- Taxable loss
- −$1,945
- Est. tax savings @ 24.0%
- +$467
- After-tax cash flow
- $2,299/yr
For passive investors: Depreciation is non-cash, so a rental often shows a tax loss while cash-flowing — sheltering income. Rental losses are passive: they offset passive income freely, and up to $25,000/yr can offset ordinary (W-2) income if you actively participate and your MAGI is under $100k (phasing out to $0 by $150k); unused losses carry forward. On sale, claimed depreciation is recaptured at up to 25%, and gains may owe capital-gains tax (a 1031 exchange can defer both). Figures are a year-1 estimate at your 24.0% rate — not tax advice; consult a CPA.
Condition & rehab AI · 12 photos
This townhouse is in excellent condition with modern finishes and a well-maintained exterior. It offers a good return on investment with minor updates that can significantly enhance its resale and rental value.
Value-add opportunities
- Both Painting the exterior and interior walls — Fresh paint enhances curb appeal and interior aesthetics.
- Both Landscaping improvements — Enhances curb appeal and adds value to the property.
- Both Adding smart home features — Improves convenience and adds modern appeal, attracting more buyers/renters.
- Resale Upgrading the kitchen backsplash — A backsplash can add visual interest and value to the kitchen space.
- Resale Upgrading the bathroom fixtures — Modern fixtures can enhance the bathroom's appeal and add value to the property.
Renovation cost estimate screening
Value-add ROI direction
- Both Painting the exterior and interior walls — Fresh paint enhances curb appeal and interior aesthetics. ↑
- Both Landscaping improvements — Enhances curb appeal and adds value to the property. ↑
- Both Adding smart home features — Improves convenience and adds modern appeal, attracting more buyers/renters. ↑
- Resale Upgrading the kitchen backsplash — A backsplash can add visual interest and value to the kitchen space. ↑
- Resale Upgrading the bathroom fixtures — Modern fixtures can enhance the bathroom's appeal and add value to the property. ↑
ⓘ Cost ranges are severity-bucket heuristics (US national rule-of-thumb). Get contractor quotes + a written scope before underwriting a rehab budget.
Schools (NCES district)
- District
- Berkeley 01
- NCES district ID
- 4501170
- Math proficiency
- 35% ▼ -8.00%
- Reading proficiency
- 48% ▼ -2.00%
- Median HH income
- $52,724
- Composite
- 35.95/100
- National rank
- #4799
- State rank
- #30 of 80 in SC
Livability — Summerville
- Score
- 63/100
- State rank
- #167
- US rank
- #15058
Category grades
Schools grade is shown separately in the Schools card above.
Census & demographics
- County
- Berkeley County · 198,768 people
- City population
- 171,668
- Metro
- Charleston-North Charleston, SC
- Population (ZIP)
- 43,816
- Household income
- $82,666
- Rent vs Own
- Severe rent burden
- 815.0
Population outlook (Berkeley County) Hauer SSP2
- Today (2025)
- 254,184 people
- By 2030
- 279,677 · +10.0%
- By 2040
- 329,379 · +29.6%
- By 2050
- 375,557 · +47.8%
- By 2075
- 476,740 · +87.6%
- By 2100
- 535,945 · +110.8%
Race, ethnicity, and origin ACS 2023
- Neighborhood character
- Majority White (61%)
- Race & ethnicity
- White 61% Black 29% Hispanic / Latino 6% Two or more races 5%
- Hispanic origin (detail)
- Mexican 2% Puerto Rican 2%
- Common ancestry
- Lithuanian 1% Slovak 1% Romanian 1%
- Foreign-born
- 3% · Canada
- Languages at home
- 96% English-only · Spanish 3%
Political lean MEDSL · Berkeley
- 2024 margin
- R (+16.3) · D 41.1% · R 57.4% · Other 1.4%
- 2008→2024 swing
- -3.2pp toward R · 2008: -13.1pp · 2024: -16.3pp
- All cycles
- 2024: R+16.3 2020: R+11.7 2016: R+17.4 2012: R+18.9 2008: R+13.1
Not yet ingested
- Civics
- —
Market trends
- HPI YoY
- ▼ -52.95%
- Current HPI
- 328.7212
- Rent YoY
- ▲ 2.77%
- Metro
- Charleston-North Charleston, SC
- State GDP YoY
- ▲ 4.51%
- F500 in state
- 2
Industry mix (Fortune 500 HQ in SC)
| Industry | F500 HQs | Revenue |
|---|---|---|
| Packaging | 1 | $7B |
|
||
Cash-flow waterfall
monthlySold comps — $/sqft
last 12 mo · ≤1 miLoading sold comps…