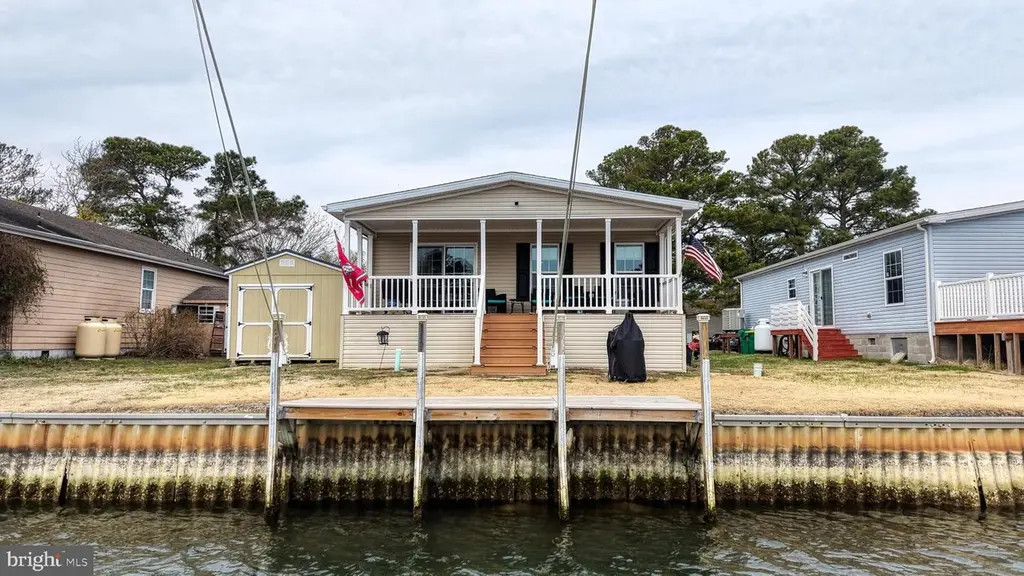
35480 Pine Dr · Long Neck, DE
Flood risk 9/10 · Severe
- FEMA flood zone
- AE
- Chance of flooding over 30 yrs
- 0.99%
- Est. flood insurance / yr
- $2,026 – $9,024
Fire risk 1/10 · Minimal
- Est. fire insurance / yr
- $476 – $884
Heat risk 9/10 · Severe
- Hot days now (above 100°F)
- 7 days/yr
- Hot days in 30 yrs
- 19 days/yr
Wind risk 8/10 · Major
- Chance of severe wind over 30 yrs
- 80.0%
Air-quality risk 2/10 · Minimal
- Unhealthy air days now
- 1 days/yr
- Unhealthy air days in 30 yrs
- 1 days/yr
Risk factors via First Street. Map © Google.
Why this score? — see what drove the C- grade
The composite is a weighted blend of 9 inputs, each scored 0–100. Each bar is that input's sub-score; the figure is the points it added to the 100-point composite (weight × sub-score).
- Cash flow +25.2/30.0
- DSCR +8.3/10.0
- 1% rule +6.6/10.0
- Condition / age +4.0/5.0
- Livability +3.5/5.0
- Schools +2.9/10.0
- Rent growth +2.5/5.0
- ARV discount +0.0/15.0
- Appreciation +0.0/10.0
$194,000
🖨 Deal sheet (PDF) 📄 Offer letter ✓ Due diligence
Listing remarks
Experience waterfront living at its finest without the hefty price tag! This stunning three-bedroom, two-bath home is only 4 years old and in excellent condition. The thoughtfully designed open-concept layout creates the perfect space for entertaining family and friends, with seamless flow between the living, dining, and kitchen areas. Step outside to your backyard oasis where you can hop on your boat, enjoy kayaking or fishing, or simply relax on the porch while taking in the peaceful water views. Located in the desirable Mariners Cove community, residents enjoy access to a community pool and boat ramp—making it easy to enjoy everything this waterfront lifestyle has to offer. Conveni
Key facts
- Community pool
- Built 2022
- Listed 97 days
Neighborhood map
What this means for you Summary
Snapshot
- This is a 3-bed/2.0-bath manufactured listed at $194k. Condition is rated good.
Deal economics
- At list price, monthly cash flow is $-27 ($-327/yr) — negative.
- To cash-flow at today's rent, offer at most $190k (2.0% below list).
- Meets the 1% rule at list price ($2k rent vs $194k).
- Recommended offer: $177k (9.0% below list) — sets the bar for market timing.
- Cap rate 9.0% vs local median 3.4% in Long Neck — top-decile yield for the area; either an underpriced asset or a hidden risk that comps aren't pricing in. Stress-test before assuming the spread holds.
Location & tenants
- Location reads 69/100 on livability (#30 in DE) — a middle-class / working-renter tenant base. Strengths: cost of living A+, housing A+, crime A-; Watch: employment D+, amenities F, commute F.
- Indian River School District (rural): math 25% / reading 41% proficiency, ranked #14 of 26 in DE (top 54%) — families likely to look elsewhere, expect single-tenant / working-renter base with shorter leases.
- Zoned schools: Long Neck Elementary School (math 22% / reading 35%, grade F, #57 of 105 statewide, top 55%, 693 students, 0% FRL); Millsboro Middle School (math 24% / reading 42%, grade F, #14 of 36 statewide, top 37%, 771 students, 0% FRL); Sussex Central High School (math 23% / reading 42%, grade F, #24 of 40 statewide, top 59%, 2,039 students, 0% FRL) — zoned schools average 0% FRL vs 49% district-wide (49 pts lower); this property's tenant base skews higher-income than the district average.
- Market conditions: 870 active listings in the ZIP; 1 comparable units currently listed for rent nearby; solid renter incomes; 4,354 units permitted in Sussex County in 2024 (344 in 5+ unit buildings).
- This rent runs 34% of the median local income ($78k/yr) — at the standard rent-burdened threshold; future hikes will face affordability resistance.
Forward outlook
- Local home prices are declining (-3.0%/yr); year-one equity from $1k of loan paydown is wiped out by about $6k of value loss. Plan a longer hold.
- Sussex County population projected at +25% by 2050 — long-run rental-demand tailwind backs the buy-and-hold thesis.
Negotiation context
- It's been on market 97 days — a 9% lower offer ($177k) is reasonable based on typical stale-listing flexibility.
- 2 sale attempts; this cycle's ask has dropped $16k (8%) from the opening price — seller is motivated, your offer sets the floor, not the list.
Risks & watch-outs
- Watch-outs: flood insurance adds $460/mo.
- Climate carrying-cost: in FEMA flood zone AE (mandatory federal flood insurance); severe wind risk, 80% chance of damaging wind over 30y; extreme-heat days projected 7→19/yr by 2055 (HVAC capex compounding) — expect insurance premiums to compound above CPI over the hold.
Questions for the listing agent
- What do current leases actually rent for vs. the listed asking? Can we see a recent rent roll and the last 12 months of T-12 income?
- It's been on market 97 days. Have you received any prior offers? Is the seller open to a 9% concession, seller financing, or rate buy-down credit?
- What's the actual annual flood-insurance premium (NFIP or private), and is the property in a SFHA with mandatory coverage?
- What does the HOA fee cover, when was the last increase, and are there any pending special assessments or reserve-fund shortfalls?
- Why hasn't it sold? Are there any deal-killer items the seller is aware of (foundation, flood, title, zoning, code violations)?
- Is there a deadline driving the sale (1031 exchange, divorce, estate, relocation)? That informs how much negotiation room exists.
- Schools are F-rated, which usually means shorter tenancies and higher turnover. Who's the typical renter profile here, and what's been the actual vacancy rate?
- What's the average days-on-market for RENTAL listings here right now (not sales)? A rising rental-DOM trend means longer vacancies and softer asking-rent achievability than the comps imply.
- What's the recent tenant-quality profile in this submarket — average credit score on applications, eviction rate, late-payment / NSF rate, and stable-employment percentage? A property-management company in the area should have these aggregated.
- How much new for-sale + rental construction is in the pipeline within 1–3 miles? Heavy new supply typically softens prices + rents 12–24 months out; constrained supply supports both.
Investment metrics
- 1% rule
- 1.16% ✓
- Cap rate
- 8.97%
- Cash-on-cash
- 9.57%
- DSCR
- 1.43
- GRM
- 7.2
CMA / ARV
- ARV (median comp)
- $160,344
- List price
- $194,000
- Delta
- 20.99%
- Verdict
- OVERPRICED
- Comps
- 20 within 1.0 mi
Show comp detail 3 sales within ~0.75 mi
| Address | Dist | Beds/Ba | Sqft | Sold | Price | $/sf | Match |
|---|---|---|---|---|---|---|---|
| 35468 Joann Dr #11511 | 0.05mi | 3/1.0 | 1,260 (+1%) | 11mo | $52,000 | $41 | 83 |
| 27299 Dinghy Rd #1348 | 0.68mi | 3/2.0 | 1,200 (-4%) | 10mo | $69,000 | $58 | 54 |
| 35476 Bayview Ln #4147 | 0.62mi | 3/2.0 | 1,400 (+12%) | 17mo | $146,000 | $104 | 36 |
Match score weights: distance 35% · size 25% · config 20% · recency 20%. Top-matched comps best support the ARV.
Projected returns pro-forma
-3.0% appreciation · 3.0% rent growth · sell at horizon
- IRR
- -17.1%
- Equity multiple
- 0.40×
- Total profit
- $-32,851
- Equity at exit
- $28,926
- IRR
- -8.7%
- Equity multiple
- 0.46×
- Total profit
- $-29,546
- Equity at exit
- $16,774
Cash invested: $54,320 (down + closing). Projections, not guarantees.
Landlord ↔ Tenant lean methodology
- Overall (STATE)
- 70 Landlord-Friendly
- State Delaware
- 70 Landlord-Friendly · D+7
- County
- — inherits STATE
- City
- — inherits STATE
ZIP-level market 19966
- Home prices YoY
- -6.4%
- Active inventory
- 870
- Price-to-rent
- 7.2×
Monthly cashflow live
- Estimated rent
- $2,248 medium interval (Pro) →
- Mortgage (P&I)
- −$1,017
- Tax est. 1.5%
- −$242 /mo · $2,910/yr
- Insurance
- −$81
- Flood insurance flood zone
- −$460 /mo · $5,525/yr
- HOA
- −$2
- Vacancy / Maint / Mgmt
- −$472
- Net cashflow
- $-27
Break-even live
Sensitivity live
| Price | -10% $107 | -5% $40 | +0% $-27 | +5% $-94 | +10% $-161 |
|---|---|---|---|---|---|
| Rent | -10% $-205 | -5% $-116 | +0% $-27 | +5% $62 | +10% $150 |
| Rate | -1.0pp $70 | -0.5pp $22 | base $-27 | +0.5pp $-77 | +1.0pp $-129 |
UW: 25.0% down · 7.5% · 30yr · 1.5% tax · 5.0% vac · 8.0% maint · 8.0% mgmt
Financing live
Cash to close
- Down payment
- $48,500
- Closing costs
- $5,820
- Reserves months
- —
- Total cash needed
- —
Loan-product check · same deal, 3 products live
Conventional
25% down · 7.5% · 30yr
- Down + closing
- —
- Monthly P&I
- —
- Monthly cashflow
- —
- DSCR
- —
- Eligible?
- —
Personal DTI + credit; lowest rate.
DSCR
20% down · 8.5% · 30yr
- Down + closing
- —
- Monthly P&I
- —
- Monthly cashflow
- —
- DSCR
- —
- Eligible?
- —
No personal income docs; deal must DSCR.
Hard money
10% down · 12.0% · 12mo
- Down + closing
- —
- Monthly P&I
- —
- Monthly cashflow
- —
- DSCR
- —
- Eligible?
- —
Short-term bridge; refi at stabilization.
Rent comps 1 comps
| Address | Beds | Baths | Sqft | Rent | $/sqft | DOM | Units | Dist |
|---|---|---|---|---|---|---|---|---|
| 35829 S Gloucester Cir Unit 35829 Long Neck, DE | 3.0 | 2.5 | 1500 | $1,995 | $1.33 | 15d | 1 | 0.14mi |
HOA detail
- Monthly dues
- $2 · $24/yr
- Likely covers
- waterpool
Listing history 22 events
-
2026-06-21days on market $194,000 Active 97 DOM
-
2026-06-18days on market $194,000 Active 94 DOM
-
2026-06-17days on market $194,000 Active 93 DOM
-
2026-06-16days on market $194,000 Active 92 DOM
-
2026-06-15days on market $194,000 Active 91 DOM
-
2026-06-14days on market $194,000 Active 89 DOM
-
2026-06-13days on market $194,000 Active 88 DOM
-
2026-06-10days on market $194,000 Active 86 DOM
-
2026-06-09days on market $194,000 Active 85 DOM
-
2026-06-08days on market $194,000 Active 84 DOM
-
2026-06-07days on market $194,000 Active 83 DOM
-
2026-06-02days on market $194,000 Active 78 DOM
-
2026-06-01days on market $194,000 Active 77 DOM
-
2026-05-31days on market $194,000 Active 76 DOM
-
2026-05-30days on market $194,000 Active 75 DOM
-
2026-04-06price $199,000
-
2026-03-16$210,000 Active
-
2025-07-08historical
-
2025-05-08price $199,000
-
2025-04-29price $208,000
-
2025-03-26price $213,000
-
2025-02-20$218,000 Active
ⓘ Source: listings_history table (triggers on properties + properties_extension) + one-shot
backfill from property_details.listing_events for pre-trigger history.
Climate risk First Street
- Flood 9/10 Extreme FEMA zone AE · 99% chance over 30 yrs
- Wildfire 1/10 Low
- Heat 9/10 Extreme 7 d/yr ≥100°F today · 19 d/yr by 30 yrs out
- Wind 8/10 Severe 80% chance of damaging wind over 30 yrs
- Air quality 2/10 Low 1 unhealthy d/yr today · 1 by 30 yrs out
Nearby sold comps map
Loading sold comps map…
Walkable amenities ~0.75 mi
Loading nearby amenities…
Taxation est. · year 1
- Rental income
- $26,976
- − Mortgage interest
- −$10,867
- − Property taxes
- −$2,910
- − Insurance
- −$6,495
- − Repairs & maintenance
- −$2,158
- − Management
- −$2,158
- − HOA
- −$24
- − Depreciation
- −$5,644
- Taxable loss
- −$3,280
- Est. tax savings @ 24.0%
- +$787
- After-tax cash flow
- $461/yr
For passive investors: Depreciation is non-cash, so a rental often shows a tax loss while cash-flowing — sheltering income. Rental losses are passive: they offset passive income freely, and up to $25,000/yr can offset ordinary (W-2) income if you actively participate and your MAGI is under $100k (phasing out to $0 by $150k); unused losses carry forward. On sale, claimed depreciation is recaptured at up to 25%, and gains may owe capital-gains tax (a 1031 exchange can defer both). Figures are a year-1 estimate at your 24.0% rate — not tax advice; consult a CPA.
Condition & rehab AI · 12 photos
This waterfront home is in excellent condition with a modern open-concept layout and easy access to water activities. It's a great investment opportunity.
Value-add opportunities
- Resale Paint exterior trim — Enhances curb appeal
- Rental Clean gutters — Keeps property in good condition
Renovation cost estimate screening
Value-add ROI direction
- Resale Paint exterior trim — Enhances curb appeal ↑
- Rental Clean gutters — Keeps property in good condition ↑
ⓘ Cost ranges are severity-bucket heuristics (US national rule-of-thumb). Get contractor quotes + a written scope before underwriting a rehab budget.
Schools (NCES district)
- District
- Indian River School District
- NCES district ID
- 1000680
- Math proficiency
- 25% ▼ -27.00%
- Reading proficiency
- 41% ▼ -17.00%
- Median HH income
- $53,838
- Composite
- 28.99/100
- National rank
- #6620
- State rank
- #14 of 26 in DE
Livability — Long Neck
- Score
- 69/100
- State rank
- #30
- US rank
- #8720
Category grades
Schools grade is shown separately in the Schools card above.
Census & demographics
- County
- Sussex County · 82,708 people
- Metro
- Salisbury, MD-DE
- Population (ZIP)
- 35,884
- Household income
- $78,305
- Rent vs Own
- Severe rent burden
- 464.0
Population outlook (Sussex County) Hauer SSP2
- Today (2025)
- 248,853 people
- By 2030
- 264,464 · +6.3%
- By 2040
- 290,980 · +16.9%
- By 2050
- 311,259 · +25.1%
- By 2075
- 352,488 · +41.6%
- By 2100
- 367,406 · +47.6%
Race, ethnicity, and origin ACS 2023
- Neighborhood character
- Predominantly White (74%)
- Race & ethnicity
- White 74% Hispanic / Latino 11% Black 8% Two or more races 7% Native American 3% Asian 1%
- Hispanic origin (detail)
- Mexican 3%
- Common ancestry
- Romanian 4% Slovak 2% Serbian 1%
- Foreign-born
- 8% · Canada, China
- Languages at home
- 88% English-only · Spanish 9% Other Indo-European 1%
Political lean MEDSL · Sussex
- 2024 margin
- R (+11.0) · D 43.9% · R 54.9% · Other 1.2%
- 2008→2024 swing
- -2.4pp toward R · 2008: -8.6pp · 2024: -11.0pp
- All cycles
- 2024: R+11.0 2020: R+11.2 2016: R+22.0 2012: R+13.0 2008: R+8.6
Not yet ingested
- Civics
- —
Market trends
- HPI YoY
- ▼ -18.26%
- Current HPI
- 268.5609
- Rent YoY
- —
- Metro
- Salisbury, MD-DE
- State GDP YoY
- —
- F500 in state
- 0
Price history
-8.7% since first listed7 events — show timeline
- 2026-04-06 Price Changed $199,000 BRIGHT MLS
- 2026-03-16 Listed $210,000 BRIGHT MLS
- 2025-07-08 Listing Removed — BRIGHT MLS
- 2025-05-08 Price Changed $199,000 BRIGHT MLS
- 2025-04-29 Price Changed $208,000 BRIGHT MLS
- 2025-03-26 Price Changed $213,000 BRIGHT MLS
- 2025-02-20 Listed $218,000 BRIGHT MLS
Property tax history
-5.8%/yrLatest (2025): $328 · -11.3% YoY. Source: county tax records.
Cash-flow waterfall
monthlySold comps — $/sqft
last 12 mo · ≤1 miLoading sold comps…