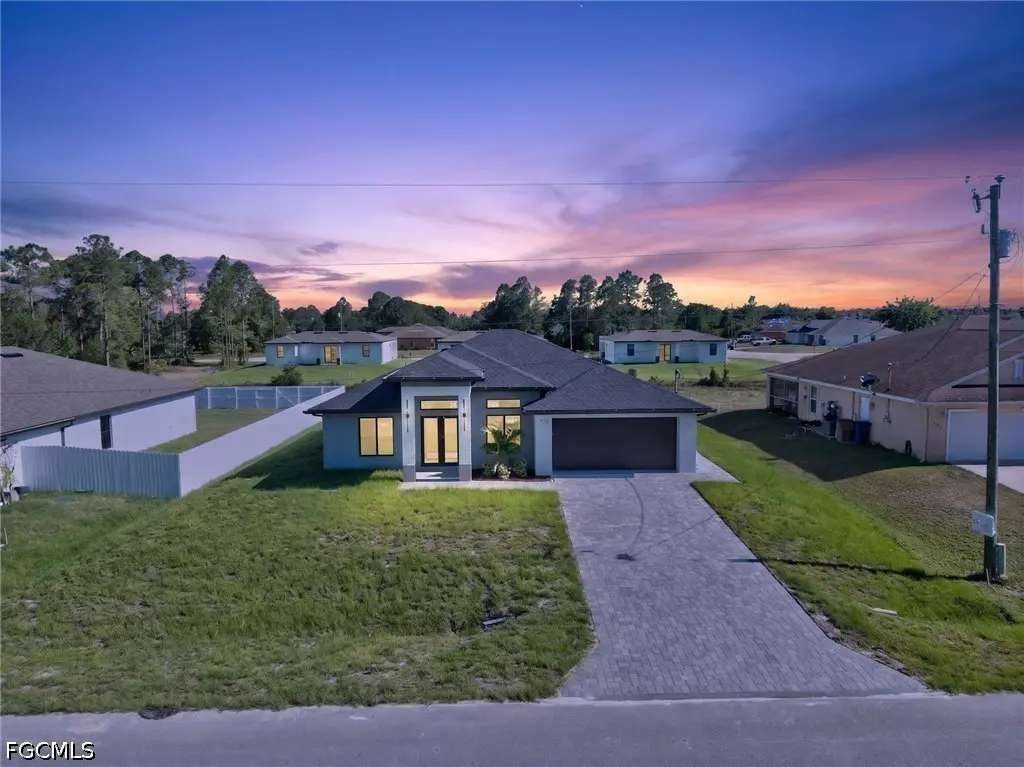
728 Brazos St E · Lehigh Acres, FL
Flood risk 6/10 · Moderate
- FEMA flood zone
- X (unshaded)
- Chance of flooding over 30 yrs
- 0.73%
- Est. flood insurance / yr
- $507 – $1,088
Fire risk 2/10 · Minimal
- Est. fire insurance / yr
- $947 – $1,759
Heat risk 10/10 · Severe
- Hot days now (above 108°F)
- 7 days/yr
- Hot days in 30 yrs
- 28 days/yr
Wind risk 10/10 · Severe
- Chance of severe wind over 30 yrs
- 99.0%
Air-quality risk 2/10 · Minimal
- Unhealthy air days now
- 1 days/yr
- Unhealthy air days in 30 yrs
- 2 days/yr
Risk factors via First Street. Map © Google.
Why this score? — see what drove the D- grade
The composite is a weighted blend of 9 inputs, each scored 0–100. Each bar is that input's sub-score; the figure is the points it added to the 100-point composite (weight × sub-score).
- Appreciation +10.0/10.0
- ARV discount +7.5/15.0
- Cash flow +6.7/30.0
- Schools +4.1/10.0
- Livability +3.0/5.0
- Condition / age +2.5/5.0
- 1% rule +1.7/10.0
- Rent growth +1.3/5.0
- DSCR +1.0/10.0
$319,900
🖨 Deal sheet 📄 Offer letter ✓ Due diligence
Listing remarks
Seller contributing towards buyers closing costs!!!Gorgeous new construction home ready to move in. Property is Designed and built to be a truly residential beauty. This property has many upgrades such as pavers on the driveway, sprinkler system and many more. It offers an open floor plan with The kitchen equipped with quartz countertops, a full backsplash, Modern cabinetry, large counter-space With stainless-steel appliances, perfect for both cooking and entertaining. Don't miss the opportunity to own this beautiful property.
Key facts
- Full backsplash
- Open floor plan
- Quartz countertops
Tags
Property features AI
Finance
- Financial info: Pets allowed
- HOA & community: Non-gated community; No association fee listed
Exterior
- Parking: Attached garage with 2 covered spaces; Garage door opener
- Security: Smoke detectors
- Utilities: Well water; Septic tank; Cable available; High-speed internet available
- Home design: Single-story home; New construction; North-facing
- Construction: Built with block, concrete and stucco; Shingle roof
- Exterior features: Security/high-impact doors; Sprinkler/irrigation system; Room for a pool; Open porch
Interior
- Kitchen: Microwave; Range; Refrigerator; Pantry
- Flooring: Tile flooring
- Bathrooms: 2 full bathrooms
- Heating & cooling: Central heating (electric); Central air conditioning (electric); Ceiling fans
- Interior features: Breakfast bar; Cathedral ceilings; Separate/formal dining room; Dual sinks; Pantry; Shower only; Separate shower; Cable TV available; Vaulted ceilings; High-speed internet available; Split bedroom floorplan; Single hung windows; Impact glass windows; Unfurnished
- Laundry & utility: Washer hookup; Dryer hookup; Inside laundry; Laundry tub
Neighborhood map
What this means for you Summary
Snapshot
- This is a 4-bed/2.0-bath land listed at $320k.
Deal economics
- At list price, monthly cash flow is $-510 ($-6k/yr) — negative.
- To cash-flow at today's rent, offer at most $246k (23.1% below list).
- To meet the 1% rule (rent ≥ 1% of price), the offer needs to be $215k (32.7% below list).
- Recommended offer: $215k (32.7% below list) — sets the bar for 1% rule.
Location & tenants
- Location reads 59/100 on livability (#826 in FL) — a working-class tenant base; expect higher turnover. Strengths: cost of living A+, housing A+; Watch: crime C-, employment D+, schools D-.
- Lee (suburban): math 47% / reading 50% proficiency, ranked #42 of 73 in FL (top 58%) — families likely to look elsewhere, expect single-tenant / working-renter base with shorter leases.
- Market conditions: Rents falling (-4.7%/yr); 2460 active listings in the ZIP; 40 comparable units currently listed for rent nearby; rentals at typical pace (median 21d on market — plan ~3-4 weeks tenant-placement turnaround); 15,411 units permitted in Lee County in 2024 (4,686 in 5+ unit buildings).
- This rent runs 36% of the median local income ($72k/yr) — at the standard rent-burdened threshold; future hikes will face affordability resistance.
Forward outlook
- In year one you build about $34k of equity ($2k loan paydown + $32k appreciation (10.0% local appreciation)).
- Lee County population projected at +44% by 2050 — long-run rental-demand tailwind backs the buy-and-hold thesis.
- By year 2, paydown + projected appreciation supports a ~$55k cash-out refi (75% LTV) — recoverable capital for the next deal without selling this one.
Negotiation context
- It's been on market 34 days — a 3% lower offer ($310k) is reasonable based on typical stale-listing flexibility.
- 3 sale attempts with the ask held roughly flat each time — persistent listings suggest the price (not the market) is what's stuck; bring a comps-based counter.
- Current owner paid $16k; list at $320k implies a 1839% gain — meaningful room to come down on a strong offer.
Risks & watch-outs
- Climate carrying-cost: major flood risk; severe wind risk, 99% chance of damaging wind over 30y; extreme-heat days projected 7→28/yr by 2055 (HVAC capex compounding) — expect insurance premiums to compound above CPI over the hold.
Questions for the listing agent
- What do current leases actually rent for vs. the listed asking? Can we see a recent rent roll and the last 12 months of T-12 income?
- It's been on market 34 days. Have you received any prior offers? Is the seller open to a 33% concession, seller financing, or rate buy-down credit?
- Is there a deadline driving the sale (1031 exchange, divorce, estate, relocation)? That informs how much negotiation room exists.
- Schools are D-rated, which usually means shorter tenancies and higher turnover. Who's the typical renter profile here, and what's been the actual vacancy rate?
- The area grade is low — what's the realistic commute time and amenity access for the typical tenant pool here? Any planned neighborhood developments (good or bad) we should know about?
- What's the average days-on-market for RENTAL listings here right now (not sales)? A rising rental-DOM trend means longer vacancies and softer asking-rent achievability than the comps imply.
- What's the recent tenant-quality profile in this submarket — average credit score on applications, eviction rate, late-payment / NSF rate, and stable-employment percentage? A property-management company in the area should have these aggregated.
- How much new for-sale + rental construction is in the pipeline within 1–3 miles? Heavy new supply typically softens prices + rents 12–24 months out; constrained supply supports both.
Investment metrics
- 1% rule
- 0.67% ✗
- Cap rate
- 4.38%
- Cash-on-cash
- -6.83%
- DSCR
- 0.70
- GRM
- 12.4
CMA / ARV
No comps found within radius.
Projected returns pro-forma
10.0% appreciation · 0.0% rent growth · sell at horizon
- IRR
- 18.7%
- Equity multiple
- 2.51×
- Total profit
- $135,481
- Equity at exit
- $288,191
- IRR
- 16.8%
- Equity multiple
- 5.61×
- Total profit
- $413,268
- Equity at exit
- $621,495
Cash invested: $89,572 (down + closing). Projections, not guarantees.
Landlord ↔ Tenant lean methodology
- Overall (STATE)
- 87 Strongly Landlord-Friendly
- State Florida
- 87 Strongly Landlord-Friendly · R+3
- County
- — inherits STATE
- City
- — inherits STATE
ZIP-level market 33974
- Home prices YoY
- 5.8%
- Rents YoY
- -4.7%
- Active inventory
- 2460
- Price-to-rent
- 12.4×
Monthly cashflow live
- Estimated rent
- $2,153 high interval (Pro) →
- Mortgage (P&I)
- −$1,678
- Tax est. 1.5%
- −$400 /mo · $4,798/yr
- Insurance
- −$133
- HOA
- −$0
- Vacancy / Maint / Mgmt
- −$452
- Net cashflow
- $-510
Break-even live
UW: 25.0% down · 7.5% · 30yr · 1.5% tax · 5.0% vac · 8.0% maint · 8.0% mgmt
Financing live
Cash to close
- Down payment
- $79,975
- Closing costs
- $9,597
- Reserves months
- —
- Total cash needed
- —
Loan-product check · same deal, 3 products live
Conventional
25% down · 7.5% · 30yr
- Down + closing
- —
- Monthly P&I
- —
- Monthly cashflow
- —
- DSCR
- —
- Eligible?
- —
Personal DTI + credit; lowest rate.
DSCR
20% down · 8.5% · 30yr
- Down + closing
- —
- Monthly P&I
- —
- Monthly cashflow
- —
- DSCR
- —
- Eligible?
- —
No personal income docs; deal must DSCR.
Hard money
10% down · 12.0% · 12mo
- Down + closing
- —
- Monthly P&I
- —
- Monthly cashflow
- —
- DSCR
- —
- Eligible?
- —
Short-term bridge; refi at stabilization.
Rent comps 40 comps
| Address | Beds | Baths | Sqft | Rent | $/sqft | DOM | Units | Dist |
|---|---|---|---|---|---|---|---|---|
| 728 Crestline Ave S Lehigh Acres, FL | 4.0 | 3.0 | 1904 | $2,000 | $1.05 | 21d | 1 | 0.12mi |
| 715 Bering Ave S Lehigh Acres, FL | 3.0 | 2.0 | 1835 | $1,895 | $1.03 | 21d | 1 | 0.14mi |
| 814 Crystal Ave S Lehigh Acres, FL | 3.0 | 2.0 | 1865 | $1,815 | $0.97 | 23d | 1 | 0.43mi |
| 719 Fullerton Ave S Lehigh Acres, FL | 3.0 | 2.0 | 1650 | $2,000 | $1.21 | 19d | 1 | 0.43mi |
| 760 Festival Ave S Lehigh Acres, FL | 3.0 | 2.0 | 1650 | $2,000 | $1.21 | 23d | 1 | 0.49mi |
| 652 Keller St E Lehigh Acres, FL | 3.0 | 2.0 | 1417 | $1,861 | $1.31 | 21d | 1 | 0.56mi |
| 826 Dawhert Ave S Lehigh Acres, FL | 4.0 | 2.0 | 1365 | $1,750 | $1.28 | 3d | 1 | 0.60mi |
| 771 Gaylord Ave S Lehigh Acres, FL | 3.0 | 2.0 | 1523 | $2,000 | $1.31 | 23d | 1 | 0.60mi |
| 750 Newhall St E Lehigh Acres, FL | 3.0 | 2.0 | 1147 | $1,675 | $1.46 | 19d | 1 | 0.61mi |
| 750 Newhall St E Lehigh Acres, FL | 3.0 | 2.0 | 1147 | $1,675 | $1.46 | 23d | 1 | 0.61mi |
| 762 Gallo Ave S #764 Lehigh Acres, FL | 3.0 | 2.0 | 1127 | $1,195 | $1.06 | 21d | 1 | 0.62mi |
| 710 Godwid Ave S Lehigh Acres, FL | 3.0 | 2.0 | 1758 | $2,150 | $1.22 | 21d | 1 | 0.65mi |
| 710 Godwid Ave S Lehigh Acres, FL | 3.0 | 2.0 | 1758 | $2,150 | $1.22 | 2d | 1 | 0.65mi |
| 710 Godwid Ave S Lehigh Acres, FL | 3.0 | 2.0 | 1758 | $2,150 | $1.22 | 3d | 1 | 0.65mi |
| 758 Worth Ave Lehigh Acres, FL | 3.0 | 2.0 | 1360 | $2,000 | $1.47 | 15d | 1 | 0.65mi |
| 708 Godwid Ave S Lehigh Acres, FL | 3.0 | 2.0 | 1758 | $2,150 | $1.22 | 21d | 1 | 0.65mi |
| 804 Gaylord Ave S Lehigh Acres, FL | 4.0 | 2.0 | 1833 | $1,875 | $1.02 | 23d | 1 | 0.66mi |
| 684 Thomas Sherwin Ave S Lehigh Acres, FL | 3.0 | 2.0 | 1288 | $1,695 | $1.32 | 3d | 1 | 0.72mi |
| 862 Charles Sise St E Lehigh Acres, FL | 3.0 | 2.0 | 1582 | $2,664 | $1.68 | 23d | 1 | 0.84mi |
| 696 Homestead Rd S Lehigh Acres, FL | 4.0 | 2.0 | 1777 | $2,200 | $1.24 | 23d | 1 | 0.88mi |
| 874 Apartment St Lehigh Acres, FL | 3.0 | 2.0 | 1200 | $1,750 | $1.46 | 23d | 1 | 0.88mi |
| 604 Thomas Sherwin Ave S Lehigh Acres, FL | 4.0 | 2.0 | 1493 | $2,200 | $1.47 | 3d | 1 | 0.90mi |
| 736 Barcia St E Lehigh Acres, FL | 4.0 | 2.0 | 1833 | $1,775 | $0.97 | 23d | 1 | 0.93mi |
| 744 Oakridge Ave S Lehigh Acres, FL | 3.0 | 2.0 | 1493 | $2,000 | $1.34 | 19d | 1 | 0.93mi |
| 546 Whispering Wind Bnd Lehigh Acres, FL | 3.0 | 2.0 | 1437 | $1,950 | $1.36 | 1d | 1 | 0.98mi |
| 528 Raintree St E Lehigh Acres, FL | 4.0 | 3.0 | 1400 | $1,700 | $1.21 | 23d | 1 | 0.98mi |
| 930 Ainsworth St W Lehigh Acres, FL | 3.0 | 2.0 | 1165 | $1,395 | $1.20 | 15d | 1 | 1.01mi |
| 925 Chenault St Lehigh Acres, FL | 3.0 | 2.0 | 1132 | $1,700 | $1.50 | 23d | 1 | 1.01mi |
| 927 Chenault St Lehigh Acres, FL | 3.0 | 2.0 | 1132 | $1,700 | $1.50 | 23d | 1 | 1.01mi |
| 711 Nimitz Blvd Lehigh Acres, FL | 4.0 | 2.0 | 1571 | $2,191 | $1.39 | 3d | 1 | 1.02mi |
| 886 Milwaukee Blvd Lehigh Acres, FL | 3.0 | 2.0 | 1205 | $1,900 | $1.58 | 23d | 1 | 1.03mi |
| 567 Charwood Ave S Lehigh Acres, FL | 3.0 | 2.0 | 1564 | $1,900 | $1.21 | 14d | 1 | 1.04mi |
| 598 Aston Lake Ct Lehigh Acres, FL | 3.0 | 2.0 | 1703 | $2,395 | $1.41 | 21d | 1 | 1.05mi |
| 908 Winters St E Lehigh Acres, FL | 3.0 | 2.0 | 1639 | $2,200 | $1.34 | 10d | 1 | 1.07mi |
| 606 Morningmist Ln Lehigh Acres, FL | 4.0 | 2.5 | 1817 | $2,295 | $1.26 | 3d | 1 | 1.07mi |
| 541 Chalet Ave S Lehigh Acres, FL | 4.0 | 3.0 | 1650 | $2,400 | $1.45 | 23d | 1 | 1.11mi |
| 645 Homestead Rd S Lehigh Acres, FL | 3.0 | 2.0 | 1165 | $1,700 | $1.46 | 23d | 1 | 1.11mi |
| 530 Kilgour Ave Lehigh Acres, FL | 3.0 | 2.0 | 2214 | $1,795 | $0.81 | 3d | 1 | 1.12mi |
| 573 Bell Blvd S Lehigh Acres, FL | 3.0 | 2.0 | 1218 | $1,900 | $1.56 | 14d | 1 | 1.14mi |
| 737 Almelia St E Lehigh Acres, FL | 3.0 | 2.0 | 1404 | $1,745 | $1.24 | 21d | 1 | 1.18mi |
Listing history 20 events
-
2026-06-15status $319,900 Pending 34 DOM
-
2026-06-15days on market $319,900 Active 34 DOM
-
2026-06-13days on market $319,900 Active 32 DOM
-
2026-06-10days on market $319,900 Active 29 DOM
-
2026-06-09days on market $319,900 Active 28 DOM
-
2026-06-08days on market $319,900 Active 27 DOM
-
2026-06-07days on market $319,900 Active 26 DOM
-
2026-06-03days on market $319,900 Active 22 DOM
-
2026-06-02days on market $319,900 Active 21 DOM
-
2026-06-01days on market $319,900 Active 20 DOM
-
2026-05-31days on market $319,900 Active 19 DOM
-
2026-05-12$319,900 Active
-
2026-05-04historical
-
2026-04-20price $329,900
-
2026-04-04price $332,000
-
2026-03-04status Active
-
2026-02-23status Pending
-
2026-01-30price $335,000
-
2026-01-14$349,900 Active
-
2024-12-10soldstatus $16,500
ⓘ Source: listings_history table (triggers on properties + properties_extension) + one-shot
backfill from property_details.listing_events for pre-trigger history.
Climate risk First Street
- Flood 6/10 Major FEMA zone X (unshaded) · 73% chance over 30 yrs
- Wildfire 2/10 Low
- Heat 10/10 Extreme 7 d/yr ≥108°F today · 28 d/yr by 30 yrs out
- Wind 10/10 Extreme 99% chance of damaging wind over 30 yrs
- Air quality 2/10 Low 1 unhealthy d/yr today · 2 by 30 yrs out
Nearby sold comps map
Loading sold comps map…
Walkable amenities ~0.75 mi
Loading nearby amenities…
Taxation est. · year 1
- Rental income
- $25,838
- − Mortgage interest
- −$17,919
- − Property taxes
- −$4,798
- − Insurance
- −$1,600
- − Repairs & maintenance
- −$2,067
- − Management
- −$2,067
- − Depreciation
- −$9,306
- Taxable loss
- −$11,920
- Est. tax savings @ 24.0%
- +$2,861
- After-tax cash flow
- $-3,256/yr
For passive investors: Depreciation is non-cash, so a rental often shows a tax loss while cash-flowing — sheltering income. Rental losses are passive: they offset passive income freely, and up to $25,000/yr can offset ordinary (W-2) income if you actively participate and your MAGI is under $100k (phasing out to $0 by $150k); unused losses carry forward. On sale, claimed depreciation is recaptured at up to 25%, and gains may owe capital-gains tax (a 1031 exchange can defer both). Figures are a year-1 estimate at your 24.0% rate — not tax advice; consult a CPA.
Schools (NCES district)
- District
- Lee
- NCES district ID
- 1201080
- Math proficiency
- 47% ▼ -11.00%
- Reading proficiency
- 50% ▼ -4.00%
- Median HH income
- $49,518
- Composite
- 41.49/100
- National rank
- #3458
- State rank
- #42 of 73 in FL
Livability — Lehigh Acres
- Score
- 59/100
- State rank
- #826
- US rank
- #20055
Category grades
Schools grade is shown separately in the Schools card above.
Census & demographics
- Census place
- Lehigh Acres, FL
- County
- Lee County · 788,662 people
- City population
- 130,638
- Metro
- Cape Coral-Fort Myers, FL
- Population (ZIP)
- 19,927
- Household income
- $72,192
- Rent vs Own
- Severe rent burden
- 434.0
Population outlook (Lee County) Hauer SSP2
- Today (2025)
- 871,946 people
- By 2030
- 955,468 · +9.6%
- By 2040
- 1,113,587 · +27.7%
- By 2050
- 1,256,891 · +44.1%
- By 2075
- 1,560,270 · +78.9%
- By 2100
- 1,726,848 · +98.0%
Race, ethnicity, and origin ACS 2023
- Neighborhood character
- Diverse neighborhood (Simpson 0.64)
- Race & ethnicity
- Hispanic / Latino 52% Two or more races 31% White 26% Black 18%
- Hispanic origin (detail)
- Mexican 12% Puerto Rican 7% Cuban 20% Dominican 4%
- Common ancestry
- Hispanic 7% Italian 1% Portuguese 1%
- Foreign-born
- 32% · Canada, Jamaica
- Languages at home
- 48% English-only · Spanish 43% French/Haitian/Cajun 7% Other Indo-European 1%
Political lean MEDSL · Lee
- 2024 margin
- Strong R (+28.4) · D 35.5% · R 63.9%
- 2008→2024 swing
- -18.0pp toward R · 2008: -10.4pp · 2024: -28.4pp
- All cycles
- 2024: R+28.4 2020: R+19.2 2016: R+20.4 2012: R+16.6 2008: R+10.4
Not yet ingested
- Civics
- —
Market trends
- HPI YoY
- ▲ 16.53%
- Current HPI
- 303.3399
- Rent YoY
- ▼ -4.68%
- Metro
- Cape Coral-Fort Myers, FL
- State GDP YoY
- ▲ 3.28%
- F500 in state
- 36
Industry mix (Fortune 500 HQ in FL)
| Industry | F500 HQs | Revenue |
|---|---|---|
| Industrial Technology | 2 | $29B |
|
||
| Insurance | 2 | $17B |
|
||
| Retail | 1 | $60B |
|
||
| Technology Distribution | 1 | $58B |
|
||
| Homebuilding | 1 | $35B |
|
||
| Technology Manufacturing | 1 | $35B |
|
||
Price history
+1838.8% since first listed9 events — show timeline
- 2026-05-12 Listed $319,900 FORTMLS
- 2026-05-04 Listing Removed — FORTMLS
- 2026-04-20 Price Changed $329,900 FORTMLS
- 2026-04-04 Price Changed $332,000 FORTMLS
- 2026-03-04 Relisted — FORTMLS
- 2026-02-23 Pending — FORTMLS
- 2026-01-30 Price Changed $335,000 FORTMLS
- 2026-01-14 Listed $349,900 FORTMLS
- 2024-12-10 Sold (Public Records) $16,500 Public Records
Property tax history
+12.4%/yrLatest (2025): $442 · +17.0% YoY. Source: county tax records.
Cash-flow waterfall
monthlySold comps — $/sqft
last 12 mo · ≤1 miLoading sold comps…