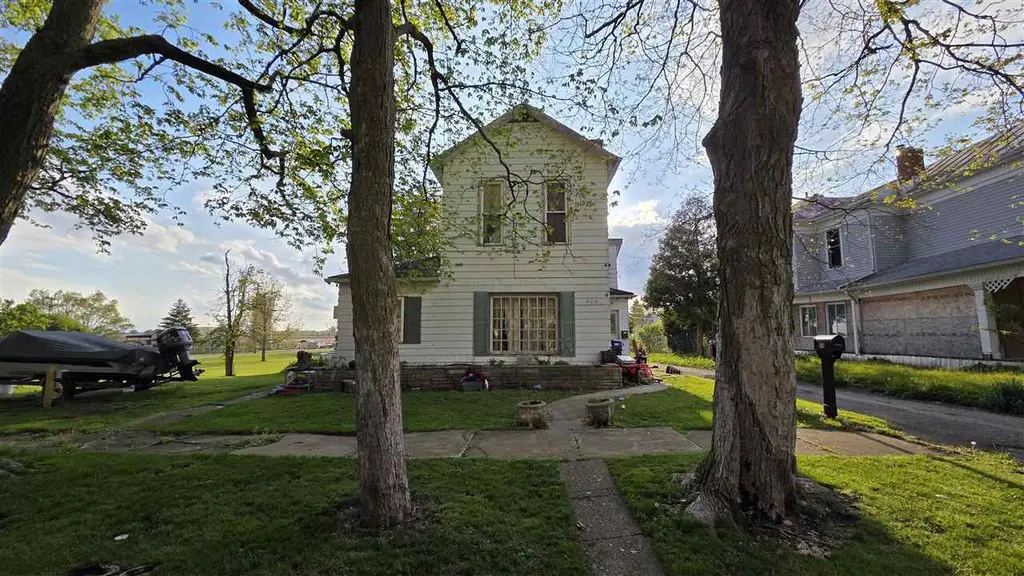
415 S Columbia St · Union City, IN
Flood risk 1/10 · Minimal
- FEMA flood zone
- X (unshaded)
- Chance of flooding over 30 yrs
- 0.0%
- Est. flood insurance / yr
- $473 – $860
Fire risk 1/10 · Minimal
- Est. fire insurance / yr
- $717 – $1,331
Heat risk 3/10 · Minor
- Hot days now (above 99°F)
- 7 days/yr
- Hot days in 30 yrs
- 18 days/yr
Wind risk 2/10 · Minimal
- Chance of severe wind over 30 yrs
- 1.0%
Air-quality risk 3/10 · Minor
- Unhealthy air days now
- 2 days/yr
- Unhealthy air days in 30 yrs
- 3 days/yr
Risk factors via First Street. Map © Google.
Why this score? — see what drove the A- grade
The composite is a weighted blend of 9 inputs, each scored 0–100. Each bar is that input's sub-score; the figure is the points it added to the 100-point composite (weight × sub-score).
- Cash flow +29.0/30.0
- ARV discount +13.5/15.0
- DSCR +10.0/10.0
- Appreciation +10.0/10.0
- 1% rule +7.0/10.0
- Livability +3.2/5.0
- Rent growth +2.5/5.0
- Schools +2.5/10.0
- Condition / age +2.5/5.0
$99,499
🖨 Deal sheet 📄 Offer letter ✓ Due diligence
Listing remarks MLS
Unique opportunity in Union City! This spacious 4-bedroom home at 415 S Columbia Street sits on approximately three city lots and occupies an entire corner lot, offering an uncommon amount of space, privacy, and potential. The property features a pool, garden area, and multiple outbuildings that provide excellent storage, workshop space, hobby areas, or future improvement possibilities. The home offers generous living space and plenty of character, with room for someone to bring their vision and updates to life. While repairs and improvements are needed, the combination of the large home, oversized corner lot, pool, garden space, and additional structures creates strong upside potential for investors, renovators, or buyers looking to build equity. Enjoy the convenience of town living while still having room to spread out outdoors. Plenty of space for entertaining, gardening, recreation, pets, parking, or additional possibilities. Conveniently located near local amenities, schools, and downtown Union City. Property is being sold as-is. Cash or conventional financing likely best suited for this property.
Key facts
- Workshop space
- Garden area
- Storage
Tags
Property features AI
Exterior
- Utilities: Public water; Septic sewer
- Home design: Single-family residence; Two levels
- Construction: Vinyl siding; Block foundation and crawl space
- Exterior features: Above-ground outdoor pool with pool cover; Storage shed; Has a view
Interior
- Kitchen: No appliances included
- Bedrooms: Four bedrooms total — two on the main level and two on the upper level; Upper bedrooms approximately 8.7 x 12.1 and 12.5 x 15.2; Main-level bedroom approximately 9.5 x 13.4
- Bathrooms: One full bathroom (main level)
- Heating & cooling: Forced-air heating; No central air conditioning
- Interior features: Smoke detectors installed; Exterior-entry basement
- Laundry & utility: Main-level laundry room (approx. 5.6 x 9.7)
Neighborhood map
What this means for you Summary
Snapshot
- This is a 3-bed/1.0-bath single-family listed at $99k.
Deal economics
- At list price, monthly cash flow is $341 ($4k/yr) — positive.
- The deal already cash-flows at list — no discount required.
- Meets the 1% rule at list price ($1k rent vs $99k).
- Recommended offer: $97k (3.0% below list) — sets the bar for market timing.
Location & tenants
- Location reads 63/100 on livability (#432 in IN) — a middle-class / working-renter tenant base. Strengths: cost of living A+, housing A+, crime A-; Watch: health & safety C-, amenities F, commute F.
- Randolph Eastern School Corporation (town): math 29% / reading 31% proficiency, ranked #246 of 301 in IN (top 82%) — families likely to look elsewhere, expect single-tenant / working-renter base with shorter leases.
- Zoned schools: North Side Elementary School (math 46% / reading 27%, grade F, #571 of 994 statewide, top 58%, 561 students, 72% FRL); Union City Community Jr/Sr High (math 9% / reading 36%, grade F, #337 of 369 statewide, top 92%, 367 students, 67% FRL) — zoned schools average 70% FRL vs 54% district-wide (15 pts higher); higher-poverty schools than district average — tighter screening recommended.
- Market conditions: 35 active listings in the ZIP; 19 units permitted in Randolph County in 2024 (0 in 5+ unit buildings).
Forward outlook
- In year one you build about $11k of equity ($688 loan paydown + $10k appreciation (10.0% local appreciation)).
- Randolph County population projected at -26% by 2050 — secular population decline; favor cash flow + early exit over multi-decade hold.
- At projected returns (10.0% appreciation + 3.0% rent growth), your $28k cash investment doubles in ~2 years — after that, you're playing with house money.
- By year 4, paydown + projected appreciation supports a ~$38k cash-out refi (75% LTV) — recoverable capital for the next deal without selling this one.
Negotiation context
- It's been on market 38 days — a 3% lower offer ($97k) is reasonable based on typical stale-listing flexibility.
- 2 sale attempts with the ask held roughly flat each time — persistent listings suggest the price (not the market) is what's stuck; bring a comps-based counter.
- Current owner paid $22k; list at $99k implies a 352% gain — meaningful room to come down on a strong offer.
Risks & watch-outs
- Watch-outs: built in 1880 — expect roof / HVAC / electrical / plumbing capex.
Questions for the listing agent
- It's been on market 38 days. Have you received any prior offers? Is the seller open to a 3% concession, seller financing, or rate buy-down credit?
- Built in 1880 — when were the roof, HVAC, electrical panel, plumbing, and water heater last replaced?
- Is there a deadline driving the sale (1031 exchange, divorce, estate, relocation)? That informs how much negotiation room exists.
- Schools are D-rated, which usually means shorter tenancies and higher turnover. Who's the typical renter profile here, and what's been the actual vacancy rate?
- What's the average days-on-market for RENTAL listings here right now (not sales)? A rising rental-DOM trend means longer vacancies and softer asking-rent achievability than the comps imply.
- What's the recent tenant-quality profile in this submarket — average credit score on applications, eviction rate, late-payment / NSF rate, and stable-employment percentage? A property-management company in the area should have these aggregated.
- How much new for-sale + rental construction is in the pipeline within 1–3 miles? Heavy new supply typically softens prices + rents 12–24 months out; constrained supply supports both.
Investment metrics
- 1% rule
- 1.20% ✓
- Cap rate
- 10.41%
- Cash-on-cash
- 14.70%
- DSCR
- 1.65
- GRM
- 6.9
CMA / ARV
- ARV (median comp)
- $114,728
- List price
- $99,499
- Delta
- -13.27%
- Verdict
- UNDERPRICED
- Comps
- 20 within 1.0 mi
Show comp detail 12 sales within ~0.75 mi
| Address | Dist | Beds/Ba | Sqft | Sold | Price | $/sf | Match |
|---|---|---|---|---|---|---|---|
| 226 E Main St | 0.31mi | 3/1.0 | 1,396 (-2%) | 5mo | $149,700 | $107 | 78 |
| 224 S 1st St | 0.24mi | 3/1.5 | 1,476 (+3%) | 9mo | $159,900 | $108 | 74 |
| 309 S Market St | 0.21mi | 3/1.0 | 1,295 (-10%) | 8mo | $31,150 | $24 | 68 |
| 305 E North St | 0.58mi | 3/1.5 | 1,385 (-3%) | 3mo | $45,000 | $32 | 63 |
| 9299 Worth Rd | 0.61mi | 3/2.0 | 1,360 (-5%) | 4mo | $215,000 | $158 | 56 |
| 122 S Division St | 0.61mi | 3/1.0 | 1,581 (+10%) | 2mo | $126,000 | $80 | 53 |
| 635 W Pearl St | 0.46mi | 2/1.0 (-1) | 1,280 (-11%) | 6mo | $48,720 | $38 | 51 |
| 198 N SR 227 | 0.73mi | 3/1.0 | 1,593 (+11%) | 1mo | $220,000 | $138 | 46 |
| 623 N Union | 0.70mi | 3/1.5 | 1,597 (+12%) | 2mo | $148,000 | $93 | 45 |
| 628 N Columbia St | 0.72mi | 3/2.5 | 1,532 (+7%) | 7mo | $33,750 | $22 | 43 |
| 710 N Union St | 0.74mi | 4/1.0 (+1) | 1,569 (+10%) | 11mo | $140,000 | $89 | 35 |
| 508 N High St | 0.69mi | 4/1.5 (+1) | 1,612 (+13%) | 8mo | $105,000 | $65 | 33 |
Match score weights: distance 35% · size 25% · config 20% · recency 20%. Top-matched comps best support the ARV.
Projected returns pro-forma
10.0% appreciation · 3.0% rent growth · sell at horizon
- IRR
- 35.1%
- Equity multiple
- 3.72×
- Total profit
- $75,885
- Equity at exit
- $89,637
- IRR
- 30.2%
- Equity multiple
- 8.41×
- Total profit
- $206,315
- Equity at exit
- $193,305
Cash invested: $27,860 (down + closing). Projections, not guarantees.
Landlord ↔ Tenant lean methodology
- Overall (STATE)
- 90 Strongly Landlord-Friendly
- State Indiana
- 90 Strongly Landlord-Friendly · R+11
- County
- — inherits STATE
- City
- — inherits STATE
ZIP-level market 47390
- Home prices YoY
- 9.1%
- Active inventory
- 35
- Price-to-rent
- 6.9×
Monthly cashflow live
- Estimated rent
- $1,196 medium interval (Pro) →
- Mortgage (P&I)
- −$522
- Tax from tax record
- −$40 /mo · $483/yr
- Insurance
- −$41
- HOA
- −$0
- Vacancy / Maint / Mgmt
- −$251
- Net cashflow
- $341
Break-even live
UW: 25.0% down · 7.5% · 30yr · 1.5% tax · 5.0% vac · 8.0% maint · 8.0% mgmt
Financing live
Cash to close
- Down payment
- $24,875
- Closing costs
- $2,985
- Reserves months
- —
- Total cash needed
- —
Loan-product check · same deal, 3 products live
Conventional
25% down · 7.5% · 30yr
- Down + closing
- —
- Monthly P&I
- —
- Monthly cashflow
- —
- DSCR
- —
- Eligible?
- —
Personal DTI + credit; lowest rate.
DSCR
20% down · 8.5% · 30yr
- Down + closing
- —
- Monthly P&I
- —
- Monthly cashflow
- —
- DSCR
- —
- Eligible?
- —
No personal income docs; deal must DSCR.
Hard money
10% down · 12.0% · 12mo
- Down + closing
- —
- Monthly P&I
- —
- Monthly cashflow
- —
- DSCR
- —
- Eligible?
- —
Short-term bridge; refi at stabilization.
Listing history 19 events
-
2026-06-18days on market $99,499 Active 38 DOM
-
2026-06-17days on market $99,499 Active 37 DOM
-
2026-06-16days on market $99,499 Active 36 DOM
-
2026-06-15days on market $99,499 Active 35 DOM
-
2026-06-13days on market $99,499 Active 33 DOM
-
2026-06-12days on market $99,499 Active 32 DOM
-
2026-06-09days on market $99,499 Active 29 DOM
-
2026-06-08days on market $99,499 Active 28 DOM
-
2026-06-07days on market $99,499 Active 27 DOM
-
2026-06-05days on market $99,499 Active 25 DOM
-
2026-06-04days on market $99,499 Active 23 DOM
-
2026-06-02days on market $99,499 Active 22 DOM
-
2026-06-01days on market $99,499 Active 21 DOM
-
2026-05-31days on market $99,499 Active 20 DOM
-
2026-05-31days on market $99,499 Active 19 DOM
-
2026-05-11$99,499 Active 1119-char remark
Show marketing remark (1119 chars)
Unique opportunity in Union City! This spacious 4-bedroom home at 415 S Columbia Street sits on approximately three city lots and occupies an entire corner lot, offering an uncommon amount of space, privacy, and potential. The property features a pool, garden area, and multiple outbuildings that provide excellent storage, workshop space, hobby areas, or future improvement possibilities. The home offers generous living space and plenty of character, with room for someone to bring their vision and updates to life. While repairs and improvements are needed, the combination of the large home, oversized corner lot, pool, garden space, and additional structures creates strong upside potential for investors, renovators, or buyers looking to build equity. Enjoy the convenience of town living while still having room to spread out outdoors. Plenty of space for entertaining, gardening, recreation, pets, parking, or additional possibilities. Conveniently located near local amenities, schools, and downtown Union City. Property is being sold as-is. Cash or conventional financing likely best suited for this property.
-
2026-05-11$99,499 Active 1022-char remark
Show marketing remark (1119 chars)
Unique opportunity in Union City! This spacious 4-bedroom home at 415 S Columbia Street sits on approximately three city lots and occupies an entire corner lot, offering an uncommon amount of space, privacy, and potential. The property features a pool, garden area, and multiple outbuildings that provide excellent storage, workshop space, hobby areas, or future improvement possibilities. The home offers generous living space and plenty of character, with room for someone to bring their vision and updates to life. While repairs and improvements are needed, the combination of the large home, oversized corner lot, pool, garden space, and additional structures creates strong upside potential for investors, renovators, or buyers looking to build equity. Enjoy the convenience of town living while still having room to spread out outdoors. Plenty of space for entertaining, gardening, recreation, pets, parking, or additional possibilities. Conveniently located near local amenities, schools, and downtown Union City. Property is being sold as-is. Cash or conventional financing likely best suited for this property.
-
2010-03-30soldstatus $22,000
-
2010-03-30soldstatus $22,000
ⓘ Source: listings_history table (triggers on properties + properties_extension) + one-shot
backfill from property_details.listing_events for pre-trigger history.
Tax reassessment forecast IN · Partial reset (capped growth)
- Current annual tax
- $483 · $40/mo
- Projected year-2 tax
- $664 · $55/mo
- Expected delta
- +$181/yr (+$15/mo · 37.6%)
ⓘ Screening estimate from a state-policy table — verify with the county assessor before closing.
Climate risk First Street
- Flood 1/10 Low FEMA zone X (unshaded) · 0% chance over 30 yrs
- Wildfire 1/10 Low
- Heat 3/10 Moderate 7 d/yr ≥99°F today · 18 d/yr by 30 yrs out
- Wind 2/10 Low 100% chance of damaging wind over 30 yrs
- Air quality 3/10 Moderate 2 unhealthy d/yr today · 3 by 30 yrs out
Nearby sold comps map
Loading sold comps map…
Walkable amenities ~0.75 mi
Loading nearby amenities…
Taxation est. · year 1
- Rental income
- $14,349
- − Mortgage interest
- −$5,573
- − Property taxes
- −$483
- − Insurance
- −$497
- − Repairs & maintenance
- −$1,148
- − Management
- −$1,148
- − Depreciation
- −$2,895
- Taxable income
- $2,605
- Est. tax owed @ 24.0%
- −$625
- After-tax cash flow
- $3,469/yr
For passive investors: Depreciation is non-cash, so a rental often shows a tax loss while cash-flowing — sheltering income. Rental losses are passive: they offset passive income freely, and up to $25,000/yr can offset ordinary (W-2) income if you actively participate and your MAGI is under $100k (phasing out to $0 by $150k); unused losses carry forward. On sale, claimed depreciation is recaptured at up to 25%, and gains may owe capital-gains tax (a 1031 exchange can defer both). Figures are a year-1 estimate at your 24.0% rate — not tax advice; consult a CPA.
Schools (NCES district)
- District
- Randolph Eastern School Corporation
- NCES district ID
- 1803180
- Math proficiency
- 29% ▼ -15.00%
- Reading proficiency
- 31% ▼ -15.00%
- Median HH income
- $36,652
- Composite
- 24.92/100
- National rank
- #7570
- State rank
- #246 of 301 in IN
Livability — Union City
- Score
- 63/100
- State rank
- #432
- US rank
- #15530
Category grades
Schools grade is shown separately in the Schools card above.
Census & demographics
- Census place
- Union City, IN
- Population (ZIP)
- 5,084
Population outlook (Randolph County) Hauer SSP2
- Today (2025)
- 22,998 people
- By 2030
- 21,815 · -5.1%
- By 2040
- 19,360 · -15.8%
- By 2050
- 17,010 · -26.0%
- By 2075
- 12,491 · -45.7%
- By 2100
- 8,986 · -60.9%
Race, ethnicity, and origin ACS 2023
- Neighborhood character
- Predominantly White (79%)
- Race & ethnicity
- White 79% Hispanic / Latino 15% Two or more races 9% Black 3%
- Hispanic origin (detail)
- Mexican 10%
- Common ancestry
- Romanian 3% Portuguese 2% Italian 1%
- Foreign-born
- 6% · Canada, South Korea, Guatemala
- Languages at home
- 88% English-only · Spanish 10% Korean 1% Other Indo-European 1%
Political lean MEDSL · Randolph
- 2024 margin
- Solid R (+53.7) · D 22.3% · R 75.9% · Other 1.8%
- 2008→2024 swing
- -44.9pp toward R · 2008: -8.8pp · 2024: -53.7pp
- All cycles
- 2024: R+53.7 2020: R+52.4 2016: R+48.5 2012: R+24.1 2008: R+8.8
Not yet ingested
- Civics
- —
Market trends
- HPI YoY
- ▲ 22.82%
- Current HPI
- 273.6736
- Rent YoY
- —
- Metro
- —
- State GDP YoY
- ▲ 2.90%
- F500 in state
- 18
Industry mix (Fortune 500 HQ in IN)
| Industry | F500 HQs | Revenue |
|---|---|---|
| Industrial Machinery | 2 | $37B |
|
||
| Healthcare | 1 | $177B |
|
||
| Pharmaceuticals | 1 | $45B |
|
||
| Metals / Steel | 1 | $18B |
|
||
| Agriculture | 1 | $17B |
|
||
| Packaging | 1 | $12B |
|
||
Price history
+318.2% since first listed5 events — show timeline
- 2026-05-27 Price Changed $91,999 RRELMS
- 2026-05-11 Listed $99,499 RRELMS
- 2026-05-11 Listed $99,499 MIBOR as Distributed by MLS Grid
- 2010-03-30 Sold (Public Records) $22,000 Public Records
- 2010-03-30 Sold (Public Records) $22,000 Public Records
Property tax history
+7.4%/yrLatest (2024): $483 · -10.0% YoY. Source: county tax records.
Cash-flow waterfall
monthlySold comps — $/sqft
last 12 mo · ≤1 miLoading sold comps…