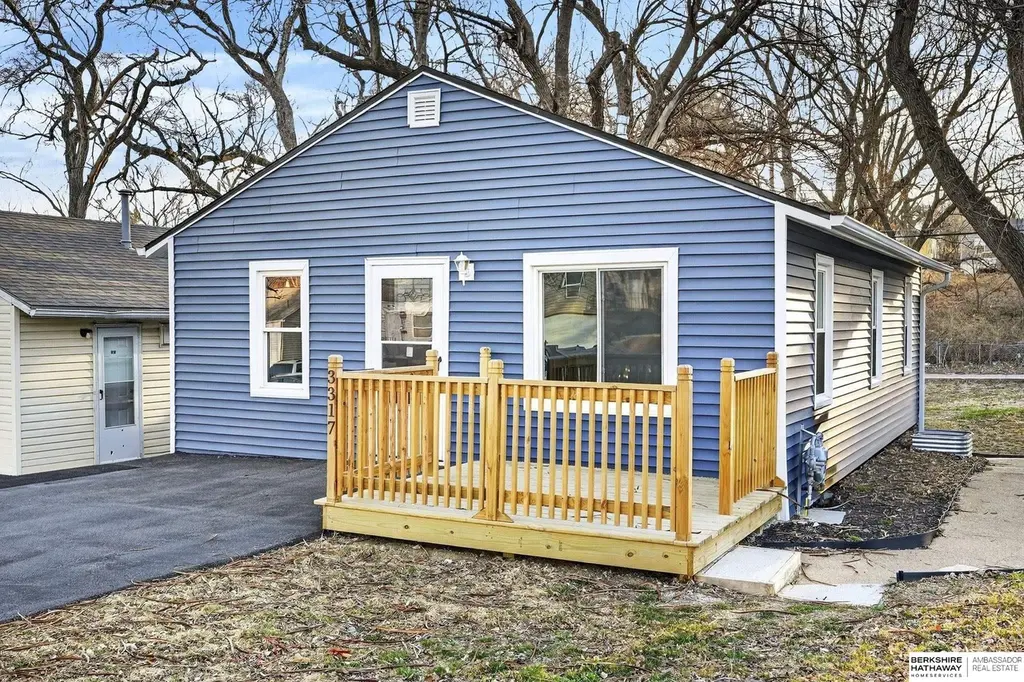
3317 N 39th St · Omaha, NE
Flood risk 1/10 · Minimal
- FEMA flood zone
- X (unshaded)
- Chance of flooding over 30 yrs
- 0.0%
- Est. flood insurance / yr
- $473 – $860
Fire risk 1/10 · Minimal
- Est. fire insurance / yr
- $1,161 – $2,155
Heat risk 3/10 · Minor
- Hot days now (above 105°F)
- 7 days/yr
- Hot days in 30 yrs
- 15 days/yr
Wind risk 2/10 · Minimal
- Chance of severe wind over 30 yrs
- —
Air-quality risk 2/10 · Minimal
- Unhealthy air days now
- 0 days/yr
- Unhealthy air days in 30 yrs
- 1 days/yr
Risk factors via First Street. Map © Google.
Why this score? — see what drove the D grade
The composite is a weighted blend of 9 inputs, each scored 0–100. Each bar is that input's sub-score; the figure is the points it added to the 100-point composite (weight × sub-score).
- Appreciation +10.0/10.0
- Cash flow +9.5/30.0
- ARV discount +7.5/15.0
- Livability +4.2/5.0
- Rent growth +3.3/5.0
- DSCR +2.7/10.0
- Condition / age +2.5/5.0
- Schools +2.1/10.0
- 1% rule +2.0/10.0
$200,000
🖨 Deal sheet (PDF) 📄 Offer letter ✓ Due diligence
Listing remarks
CONTRACT PENDING. .AMA. Completely renovated from exterior to interior, this 4-bedroom, 2-bath home offers updated finishes and major improvements throughout. Recent work includes new siding, roof, gutters, driveway, porch, insulation, ductwork, New electrical wiring installed throughout, plumbing, water heater, and furnace. The kitchen features new stainless steel appliances, and additional ductwork was added to improve basement airflow. Move-in ready with a functional layout and a long list of completed updates. Located in a NIFA Targeted Area, this home may offer buyers access to special financing options through participating lenders. OPEN HOUSE CANCELLED 4/4/2026
Key facts
- New siding
- New driveway
- New gutters
Tags
Neighborhood map
What this means for you Summary
Snapshot
- This is a 3-bed/1.5-bath single-family listed at $200k.
Deal economics
- At list price, monthly cash flow is $-140 ($-2k/yr) — negative.
- To cash-flow at today's rent, offer at most $175k (12.4% below list).
- To meet the 1% rule (rent ≥ 1% of price), the offer needs to be $140k (29.8% below list).
- Recommended offer: $140k (29.8% below list) — sets the bar for 1% rule.
- Cap rate 5.5% vs local median 3.6% in Omaha — top-decile yield for the area; either an underpriced asset or a hidden risk that comps aren't pricing in. Stress-test before assuming the spread holds.
Location & tenants
- Location reads 84/100 on livability (#7 in NE, #663 nationally) — a professional / high-income tenant draw. Strengths: amenities A+, commute A+, cost of living A+; Watch: crime F.
- Omaha Public Schools (urban): math 20% / reading 28% proficiency, ranked #110 of 111 in NE (top 99%) — low school quality limits family demand, transient renter base, plan for 1-2y turnover; 62% free/reduced lunch — lower-income household profile, screen leases tightly.
- Zoned schools: Druid Hill Elementary School (math 12% / reading 12%, grade F, #489 of 502 statewide, top 98%, 279 students, 0% FRL); Monroe Middle School (math 8% / reading 15%, grade F, #127 of 128 statewide, top 99%, 769 students, 0% FRL); Benson High School (math 9% / reading 12%, grade F, #257 of 261 statewide, top 98%, 1,570 students, 0% FRL) — zoned schools average 0% FRL vs 62% district-wide (62 pts lower); this property's tenant base skews higher-income than the district average.
- Zoned-school proficiency averages 11% at this address vs 24% district-wide (-13 pts) — the specific schools serving this property underperform the Omaha Public Schools average; the district grade overstates school quality for this exact location.
- Market conditions: Rents rising (+3.2%/yr); 140 active listings in the ZIP; 20 comparable units currently listed for rent nearby; rentals at typical pace (median 26d on market — plan ~3-4 weeks tenant-placement turnaround); lower-income renter base — watch delinquency; 4,539 units permitted in Douglas County in 2024 (2,583 in 5+ unit buildings).
Forward outlook
- In year one you build about $21k of equity ($1k loan paydown + $20k appreciation (10.0% local appreciation)).
- Douglas County population projected at +28% by 2050 — long-run rental-demand tailwind backs the buy-and-hold thesis.
- By year 2, paydown + projected appreciation supports a ~$34k cash-out refi (75% LTV) — recoverable capital for the next deal without selling this one.
Negotiation context
- Only 8 days on market — expect competitive offers; lowballing is unlikely to land.
- 8 sale attempts since 23y ago with the ask held roughly flat each time — persistent listings suggest the price (not the market) is what's stuck; bring a comps-based counter.
- Current owner paid $87k; list at $200k implies a 130% gain — meaningful room to come down on a strong offer.
Risks & watch-outs
- Watch-outs: built in 1955 — expect roof / HVAC / electrical / plumbing capex.
Questions for the listing agent
- What do current leases actually rent for vs. the listed asking? Can we see a recent rent roll and the last 12 months of T-12 income?
- Built in 1955 — when were the roof, HVAC, electrical panel, plumbing, and water heater last replaced?
- Is there a deadline driving the sale (1031 exchange, divorce, estate, relocation)? That informs how much negotiation room exists.
- Crime grade is F in this area — have there been break-ins, vandalism, or insurance claims at this property in the last 3 years? What carrier currently insures it and at what premium?
- The area grade is low — what's the realistic commute time and amenity access for the typical tenant pool here? Any planned neighborhood developments (good or bad) we should know about?
- What's the average days-on-market for RENTAL listings here right now (not sales)? A rising rental-DOM trend means longer vacancies and softer asking-rent achievability than the comps imply.
- What's the recent tenant-quality profile in this submarket — average credit score on applications, eviction rate, late-payment / NSF rate, and stable-employment percentage? A property-management company in the area should have these aggregated.
- How much new for-sale + rental construction is in the pipeline within 1–3 miles? Heavy new supply typically softens prices + rents 12–24 months out; constrained supply supports both.
Investment metrics
- 1% rule
- 0.70% ✗
- Cap rate
- 5.45%
- Cash-on-cash
- -3.01%
- DSCR
- 0.87
- GRM
- 11.9
CMA / ARV
- ARV (on-the-fly)
- $121,344
- Comps found
- 12
Show comp detail 12 sales within ~0.75 mi
| Address | Dist | Beds/Ba | Sqft | Sold | Price | $/sf | Match |
|---|---|---|---|---|---|---|---|
| 3936 N 40th St | 0.42mi | 2/1.0 (-1) | 768 (0%) | 2mo | $110,000 | $143 | 72 |
| 3940 N 38 St | 0.41mi | 2/1.0 (-1) | 780 (+2%) | 1mo | $123,000 | $158 | 70 |
| 4123 Wirt St | 0.31mi | 2/1.0 (-1) | 714 (-7%) | 1mo | $80,000 | $112 | 66 |
| 3701 Bedford Ave | 0.12mi | 2/2.0 (-1) | 675 (-12%) | 6mo | $110,000 | $163 | 62 |
| 3715 N 44th Ave | 0.50mi | 2/1.0 (-1) | 810 (+6%) | 3mo | $130,000 | $160 | 58 |
| 3355 N 40 Ave | 0.15mi | 2/1.0 (-1) | 660 (-14%) | 7mo | $123,000 | $186 | 57 |
| 4204 Bedford Ave | 0.28mi | 2/1.0 (-1) | 874 (+14%) | 2mo | $140,000 | $160 | 56 |
| 4328 N 40th Ave | 0.66mi | 2/1.0 (-1) | 776 (+1%) | 6mo | $130,000 | $168 | 55 |
| 3919 Miami St | 0.44mi | 2/1.0 (-1) | 860 (+12%) | 2mo | $115,000 | $134 | 51 |
| 3959 N 40th St | 0.46mi | 2/1.0 (-1) | 870 (+13%) | 0mo | $108,000 | $124 | 49 |
| 2434 N 33rd Ave | 0.71mi | 2/1.0 (-1) | 848 (+10%) | 5mo | $127,500 | $150 | 38 |
| 3601 Burdette St | 0.74mi | 2/1.0 (-1) | 672 (-12%) | 2mo | $65,000 | $97 | 36 |
Match score weights: distance 35% · size 25% · config 20% · recency 20%. Top-matched comps best support the ARV.
Projected returns pro-forma
10.0% appreciation · 3.22% rent growth · sell at horizon
- IRR
- 22.2%
- Equity multiple
- 2.79×
- Total profit
- $100,232
- Equity at exit
- $180,176
- IRR
- 20.0%
- Equity multiple
- 6.41×
- Total profit
- $302,719
- Equity at exit
- $388,556
Cash invested: $56,000 (down + closing). Projections, not guarantees.
Landlord ↔ Tenant lean methodology
- Overall (STATE)
- 83 Strongly Landlord-Friendly
- State Nebraska
- 83 Strongly Landlord-Friendly · R+13
- County
- — inherits STATE
- City
- — inherits STATE
ZIP-level market 68111
- Home prices YoY
- 4.0%
- Rents YoY
- 3.2%
- Active inventory
- 140
- Price-to-rent
- 11.9×
Monthly cashflow live
- Estimated rent
- $1,404 high interval (Pro) →
- Mortgage (P&I)
- −$1,049
- Tax from tax record
- −$118 /mo · $1,411/yr
- Insurance
- −$83
- HOA
- −$0
- Vacancy / Maint / Mgmt
- −$295
- Net cashflow
- $-140
Break-even live
Sensitivity live
| Price | -10% $-27 | -5% $-84 | +0% $-140 | +5% $-197 | +10% $-254 |
|---|---|---|---|---|---|
| Rent | -10% $-251 | -5% $-196 | +0% $-140 | +5% $-85 | +10% $-30 |
| Rate | -1.0pp $-40 | -0.5pp $-90 | base $-140 | +0.5pp $-192 | +1.0pp $-245 |
UW: 25.0% down · 7.5% · 30yr · 1.5% tax · 5.0% vac · 8.0% maint · 8.0% mgmt
Financing live
Cash to close
- Down payment
- $50,000
- Closing costs
- $6,000
- Reserves months
- —
- Total cash needed
- —
Loan-product check · same deal, 3 products live
Conventional
25% down · 7.5% · 30yr
- Down + closing
- —
- Monthly P&I
- —
- Monthly cashflow
- —
- DSCR
- —
- Eligible?
- —
Personal DTI + credit; lowest rate.
DSCR
20% down · 8.5% · 30yr
- Down + closing
- —
- Monthly P&I
- —
- Monthly cashflow
- —
- DSCR
- —
- Eligible?
- —
No personal income docs; deal must DSCR.
Hard money
10% down · 12.0% · 12mo
- Down + closing
- —
- Monthly P&I
- —
- Monthly cashflow
- —
- DSCR
- —
- Eligible?
- —
Short-term bridge; refi at stabilization.
Rent comps 20 comps
| Address | Beds | Baths | Sqft | Rent | $/sqft | DOM | Units | Dist |
|---|---|---|---|---|---|---|---|---|
| 3323 N 40th St Omaha, NE | 2.0 | 1.0 | 1000 | $1,575 | $1.57 | 4d | 1 | 0.05mi |
| 3674 Bedford Ave Omaha, NE | 3.0 | 1.0 | 864 | $1,275 | $1.48 | 25d | 1 | 0.14mi |
| 3356 N 41st St Omaha, NE | 2.0 | 1.0 | 720 | $1,295 | $1.80 | 25d | 1 | 0.22mi |
| 3425 N 45th St Omaha, NE | 2.0 | 1.0 | 872 | $1,500 | $1.72 | 16d | 1 | 0.49mi |
| 3502 Lake St Omaha, NE | 2.0 | 1.0 | 974 | $995 | $1.02 | 4d | 1 | 0.58mi |
| 2305 John a Creighton Blvd Omaha, NE | 2.0 | 1.0 | 672 | $1,200 | $1.79 | 23d | 1 | 0.64mi |
| 4874 Maple St Omaha, NE | 3.0 | 1.0 | 1098 | $1,545 | $1.41 | 45d | 1 | 0.90mi |
| 4112 N 48th St Unit 3 Omaha, NE | 2.0 | 1.0 | 800 | $850 | $1.06 | 25d | 1 | 0.92mi |
| 4112 N 48th St Omaha, NE | 2.0 | 1.0 | 825 | $899 | $1.09 | 12d | 2 | 0.92mi |
| 4112 N 48th St Unit 2 Omaha, NE | 2.0 | 1.0 | 800 | $899 | $1.12 | 25d | 1 | 0.92mi |
| 4852 Boyd St Omaha, NE | 2.0 | 2.0 | 912 | $1,500 | $1.64 | 45d | 1 | 1.07mi |
| 4844 Taylor St Apt 4 Omaha, NE | 2.0 | 1.0 | 750 | $925 | $1.23 | 25d | 1 | 1.09mi |
| 4102 Hamilton St Unit 014 Omaha, NE | 2.0 | 1.0 | 811 | $1,120 | $1.38 | 25d | 1 | 1.16mi |
| 4102 Hamilton St Omaha, NE | 2.0 | 1.0 | 811 | $1,120 | $1.38 | 4d | 1 | 1.17mi |
| 4918 Ames Ave Unit 17 Omaha, NE | 2.0 | 1.5 | 1074 | $850 | $0.79 | 25d | 1 | 1.18mi |
| 5119 Pratt St Omaha, NE | 3.0 | 1.0 | 1008 | $1,900 | $1.88 | 45d | 1 | 1.20mi |
| 1407 N 31st St Omaha, NE | 2.0 | 1.0 | 1040 | $1,395 | $1.34 | 4d | 1 | 1.33mi |
| 1004 Glenwood Ave Unit 2 Omaha, NE | 3.0 | 1.5 | 1000 | $1,500 | $1.50 | 4d | 1 | 1.35mi |
| 4314 N 52nd St Omaha, NE | 3.0 | 1.0 | 780 | $945 | $1.21 | 16d | 1 | 1.42mi |
| 1306 N 48th Ave Unit 1313258 Omaha, NE | 2.0 | 1.0 | 994 | $875 | $0.88 | 4d | 1 | 1.46mi |
Listing history 22 events
-
2026-04-04status Pending
-
2026-03-27$200,000 New
-
2026-03-05historical
-
2025-10-29price $210,000
-
2025-10-18historical
-
2025-10-17$215,000 New
-
2025-09-29price $215,000
-
2025-09-11$219,999 New
-
2025-06-12soldstatus $87,000
-
2025-06-11soldstatus $87,000 Sold
-
2025-06-02status Pending
-
2025-04-30$90,000 New
-
2018-01-19historical
-
2017-12-01$35,000 Active - New
-
2013-02-19soldstatus $11,000
-
2013-02-06historical
-
2012-10-01$20,500
-
2006-03-31historical
-
2005-09-01$39,900
-
2004-03-01soldstatus $43,000
-
2004-02-10historical
-
2003-12-12$43,000
ⓘ Source: listings_history table (triggers on properties + properties_extension) + one-shot
backfill from property_details.listing_events for pre-trigger history.
Tax reassessment forecast NE · Resets to sale price
- Current annual tax
- $1,411 · $118/mo
- Projected year-2 tax
- $3,460 · $288/mo
- Expected delta
- +$2,049/yr (+$171/mo · 145.2%)
ⓘ Screening estimate from a state-policy table — verify with the county assessor before closing.
Climate risk First Street
- Flood 1/10 Low FEMA zone X (unshaded) · 0% chance over 30 yrs
- Wildfire 1/10 Low
- Heat 3/10 Moderate 7 d/yr ≥105°F today · 15 d/yr by 30 yrs out
- Wind 2/10 Low
- Air quality 2/10 Low 0 unhealthy d/yr today · 1 by 30 yrs out
Nearby sold comps map
Loading sold comps map…
Walkable amenities ~0.75 mi
Loading nearby amenities…
Taxation est. · year 1
- Rental income
- $16,850
- − Mortgage interest
- −$11,203
- − Property taxes
- −$1,411
- − Insurance
- −$1,000
- − Repairs & maintenance
- −$1,348
- − Management
- −$1,348
- − Depreciation
- −$5,818
- Taxable loss
- −$5,278
- Est. tax savings @ 24.0%
- +$1,267
- After-tax cash flow
- $-419/yr
For passive investors: Depreciation is non-cash, so a rental often shows a tax loss while cash-flowing — sheltering income. Rental losses are passive: they offset passive income freely, and up to $25,000/yr can offset ordinary (W-2) income if you actively participate and your MAGI is under $100k (phasing out to $0 by $150k); unused losses carry forward. On sale, claimed depreciation is recaptured at up to 25%, and gains may owe capital-gains tax (a 1031 exchange can defer both). Figures are a year-1 estimate at your 24.0% rate — not tax advice; consult a CPA.
Schools (NCES district)
- District
- Omaha Public Schools
- NCES district ID
- 3174820
- Math proficiency
- 20% ▼ -10.00%
- Reading proficiency
- 28% ▼ -5.00%
- Median HH income
- $46,039
- Composite
- 20.83/100
- National rank
- #8502
- State rank
- #110 of 111 in NE
Livability — Omaha
- Score
- 84/100
- State rank
- #7
- US rank
- #663
Category grades
Schools grade is shown separately in the Schools card above.
Census & demographics
- Census place
- Omaha, NE
- County
- Douglas County · 538,646 people
- City population
- 552,986
- Metro
- Omaha-Council Bluffs, NE-IA
- Population (ZIP)
- 24,210
- Household income
- $42,185
- Rent vs Own
- Severe rent burden
- 1913.0
Population outlook (Douglas County) Hauer SSP2
- Today (2025)
- 625,245 people
- By 2030
- 661,613 · +5.8%
- By 2040
- 732,395 · +17.1%
- By 2050
- 801,988 · +28.3%
- By 2075
- 968,637 · +54.9%
- By 2100
- 1,101,871 · +76.2%
Race, ethnicity, and origin ACS 2023
- Neighborhood character
- Diverse neighborhood (Simpson 0.65)
- Race & ethnicity
- Black 52% Hispanic / Latino 21% White 17% Two or more races 15% Asian 3% Native American 1%
- Hispanic origin (detail)
- Mexican 14%
- Common ancestry
- Ukrainian 3% Lithuanian 0%
- Foreign-born
- 14% · Canada, Philippines
- Languages at home
- 75% English-only · Spanish 16% Other Asian/Pacific 3% French/Haitian/Cajun 1%
Political lean MEDSL · Douglas
- 2024 margin
- D (+10.2) · D 54.4% · R 44.2% · Other 1.4%
- 2008→2024 swing
- +5.5pp toward D · 2008: 4.6pp · 2024: 10.2pp
- All cycles
- 2024: D+10.2 2020: D+11.3 2016: D+1.4 2012: R+4.3 2008: D+4.6
Not yet ingested
- Civics
- —
Market trends
- HPI YoY
- ▲ 13.82%
- Current HPI
- 358.7174
- Rent YoY
- ▲ 3.22%
- Metro
- Omaha-Council Bluffs, NE-IA
- State GDP YoY
- ▲ 0.68%
- F500 in state
- 2
Industry mix (Fortune 500 HQ in NE)
| Industry | F500 HQs | Revenue |
|---|---|---|
| Conglomerate | 1 | $371B |
|
||
Price history
+365.1% since first listed22 events — show timeline
- 2026-04-04 Pending — GPRMLS
- 2026-03-27 Listed $200,000 GPRMLS
- 2026-03-05 Listing Removed — GPRMLS
- 2025-10-29 Price Changed $210,000 GPRMLS
- 2025-10-18 Listing Removed — GPRMLS
- 2025-10-17 Listed $215,000 GPRMLS
- 2025-09-29 Price Changed $215,000 GPRMLS
- 2025-09-11 Listed $219,999 GPRMLS
- 2025-06-12 Sold (Public Records) $87,000 Public Records
- 2025-06-11 Sold (MLS) $87,000 GPRMLS
- 2025-06-02 Pending — GPRMLS
- 2025-04-30 Listed $90,000 GPRMLS
- 2018-01-19 Listing Removed — GPRMLS
- 2017-12-01 Listed $35,000 GPRMLS
- 2013-02-19 Sold (MLS) $11,000 GPRMLS
- 2013-02-06 Listing Removed — GPRMLS
- 2012-10-01 Listed $20,500 GPRMLS
- 2006-03-31 Listing Removed — GPRMLS
- 2005-09-01 Listed $39,900 GPRMLS
- 2004-03-01 Sold (MLS) $43,000 GPRMLS
- 2004-02-10 Listing Removed — GPRMLS
- 2003-12-12 Listed $43,000 GPRMLS
Property tax history
+9.0%/yrLatest (2025): $1,411 · -1.2% YoY. Source: county tax records.
Cash-flow waterfall
monthlySold comps — $/sqft
last 12 mo · ≤1 miLoading sold comps…