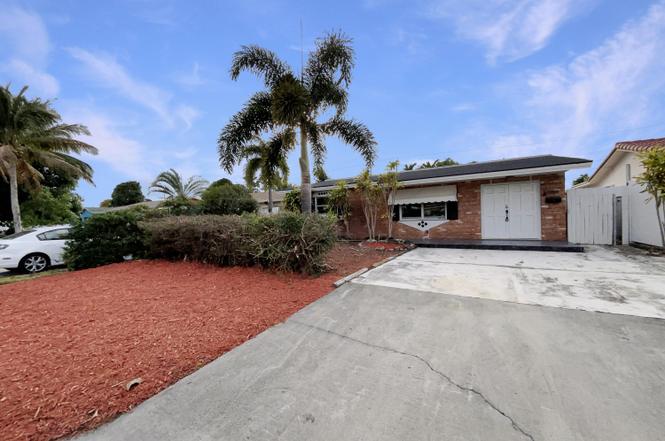
3765 NE 12th Ter · Pompano Beach, FL
Flood risk 1/10 · Minimal
- FEMA flood zone
- X (shaded)
- Chance of flooding over 30 yrs
- 0.0%
- Est. flood insurance / yr
- $507 – $1,088
Fire risk 1/10 · Minimal
- Est. fire insurance / yr
- $947 – $1,759
Heat risk 9/10 · Severe
- Hot days now (above 107°F)
- 7 days/yr
- Hot days in 30 yrs
- 26 days/yr
Wind risk 10/10 · Severe
- Chance of severe wind over 30 yrs
- 99.0%
Air-quality risk 2/10 · Minimal
- Unhealthy air days now
- 1 days/yr
- Unhealthy air days in 30 yrs
- 3 days/yr
Risk factors via First Street. Map © Google.
Why this score? — see what drove the D+ grade
The composite is a weighted blend of 9 inputs, each scored 0–100. Each bar is that input's sub-score; the figure is the points it added to the 100-point composite (weight × sub-score).
- ARV discount +15.0/15.0
- Cash flow +14.0/30.0
- DSCR +4.2/10.0
- Schools +4.1/10.0
- Livability +3.7/5.0
- Rent growth +2.9/5.0
- 1% rule +2.7/10.0
- Condition / age +2.5/5.0
- Appreciation +0.0/10.0
$381,000
🖨 Deal sheet (PDF) 📄 Offer letter ✓ Due diligence
Listing remarks
Welcome to 3765 NE 12th Ter, a property that boasts a range of desirable features. Enjoy the outdoors with a covered patio, perfect for entertaining or relaxing. The fenced-in backyard provides privacy and security, and includes a storage shed for all your outdoor equipment. Inside, the kitchen is a chef's dream with an accent backsplash and all stainless steel appliances. The primary bedroom is a haven of comfort with double closets for ample storage. The home also features a new roof, ensuring peace of mind for years to come. This property is a must-see for anyone seeking a blend of style and functionality. Included 100-Day Home Warranty with buyer activation
Key facts
- Double closets
- Covered patio
- Storage shed
Tags
Property features AI
Finance
- Other: No additional financial details provided
- Financial info: Pets allowed
- HOA & community: No association amenities
Exterior
- Parking: Parking details not provided
- Security: No security features listed
- Utilities: Three-phase electric service; Public sewer; Sewer and water available
- Home design: Single-family residence; Single-story; Faces east; Resale condition; Living area approximately 1,280
- Construction: Aluminum siding and concrete construction
- Exterior features: Not on the waterfront; No waterfront features listed
Interior
- Kitchen: Microwave; Electric water heater
- Bedrooms: 2 bedrooms on the main level
- Flooring: Vinyl flooring
- Bathrooms: 2 full bathrooms (main level)
- Heating & cooling: Electric central heat; Central air conditioning
- Interior features: No notable built-in interior features listed; Unfurnished
- Laundry & utility: Laundry inside
Neighborhood map
What this means for you Summary
Snapshot
- This is a 2-bed/2.0-bath single-family listed at $381k.
Deal economics
- At list price, monthly cash flow is $48 ($571/yr) — positive.
- The deal already cash-flows at list — no discount required.
- To meet the 1% rule (rent ≥ 1% of price), the offer needs to be $294k (22.9% below list).
- Recommended offer: $294k (22.9% below list) — sets the bar for 1% rule.
- Cap rate 6.4% vs local median 3.1% in Pompano Beach — top-decile yield for the area; either an underpriced asset or a hidden risk that comps aren't pricing in. Stress-test before assuming the spread holds.
Location & tenants
- Location reads 74/100 on livability (#284 in FL, #4,541 nationally) — a middle-class / working-renter tenant base. Strengths: commute A+, housing A+, cost of living B+; Watch: employment D+, amenities F.
- Broward (suburban): math 42% / reading 53% proficiency, ranked #46 of 73 in FL (top 63%) — families likely to look elsewhere, expect single-tenant / working-renter base with shorter leases.
- Zoned schools: Norcrest Elementary School (math 39% / reading 43%, grade F, #1,454 of 2,144 statewide, top 69%, 672 students, 71% FRL); Deerfield Beach Middle School (math 30% / reading 39%, grade F, #421 of 571 statewide, top 74%, 1,140 students, 72% FRL); Deerfield Beach High School (math 12% / reading 37%, grade F, #505 of 667 statewide, top 79%, 2,251 students, 69% FRL) — zoned schools average 71% FRL vs 51% district-wide (19 pts higher); higher-poverty schools than district average — tighter screening recommended.
- Zoned-school proficiency averages 33% at this address vs 48% district-wide (-14 pts) — the specific schools serving this property underperform the Broward average; the district grade overstates school quality for this exact location.
- Market conditions: Rents rising (+1.8%/yr); 595 active listings in the ZIP; 40 comparable units currently listed for rent nearby; rentals at typical pace (median 19d on market — plan ~3-4 weeks tenant-placement turnaround); 2,111 units permitted in Broward County in 2024 (1,265 in 5+ unit buildings).
- At $2,936/mo this rent would consume 49% of the median local household income ($71k/yr) (locally 2907% of renters already pay >50% of income on rent) — very limited rent-growth headroom before tenants either downsize or default.
Forward outlook
- Local home prices are declining (-3.0%/yr); year-one equity from $3k of loan paydown is wiped out by about $11k of value loss. Plan a longer hold.
- Broward County population projected at +34% by 2050 — long-run rental-demand tailwind backs the buy-and-hold thesis.
Negotiation context
- It's been on market 94 days — a 9% lower offer ($347k) is reasonable based on typical stale-listing flexibility.
- 4 sale attempts; this cycle's ask is 21572% above the opening price — seller raised mid-cycle; expect resistance to lowballs.
- Current owner paid $325k; 17% above their basis — modest negotiation headroom, anchor on the comps not their cost.
Risks & watch-outs
- Climate carrying-cost: severe wind risk, 99% chance of damaging wind over 30y; extreme-heat days projected 7→26/yr by 2055 (HVAC capex compounding) — expect insurance premiums to compound above CPI over the hold.
Questions for the listing agent
- It's been on market 94 days. Have you received any prior offers? Is the seller open to a 23% concession, seller financing, or rate buy-down credit?
- Built in 1971 — when were the roof, HVAC, electrical panel, plumbing, and water heater last replaced?
- Why hasn't it sold? Are there any deal-killer items the seller is aware of (foundation, flood, title, zoning, code violations)?
- Is there a deadline driving the sale (1031 exchange, divorce, estate, relocation)? That informs how much negotiation room exists.
- Schools are D-rated, which usually means shorter tenancies and higher turnover. Who's the typical renter profile here, and what's been the actual vacancy rate?
- The area grade is low — what's the realistic commute time and amenity access for the typical tenant pool here? Any planned neighborhood developments (good or bad) we should know about?
- What's the average days-on-market for RENTAL listings here right now (not sales)? A rising rental-DOM trend means longer vacancies and softer asking-rent achievability than the comps imply.
- What's the recent tenant-quality profile in this submarket — average credit score on applications, eviction rate, late-payment / NSF rate, and stable-employment percentage? A property-management company in the area should have these aggregated.
- How much new for-sale + rental construction is in the pipeline within 1–3 miles? Heavy new supply typically softens prices + rents 12–24 months out; constrained supply supports both.
Investment metrics
- 1% rule
- 0.77% ✗
- Cap rate
- 6.44%
- Cash-on-cash
- 0.54%
- DSCR
- 1.02
- GRM
- 10.8
CMA / ARV
- ARV (on-the-fly)
- $481,280
- Comps found
- 1
Show comp detail 1 sale within ~0.75 mi
| Address | Dist | Beds/Ba | Sqft | Sold | Price | $/sf | Match |
|---|---|---|---|---|---|---|---|
| 1411 NE 35th St | 0.24mi | 2/2.0 | 1,254 (-2%) | 17mo | $472,000 | $376 | 71 |
Match score weights: distance 35% · size 25% · config 20% · recency 20%. Top-matched comps best support the ARV.
Projected returns pro-forma
-3.0% appreciation · 1.75% rent growth · sell at horizon
- IRR
- -16.7%
- Equity multiple
- 0.41×
- Total profit
- $-62,533
- Equity at exit
- $56,808
- IRR
- -10.7%
- Equity multiple
- 0.38×
- Total profit
- $-65,866
- Equity at exit
- $32,942
Cash invested: $106,680 (down + closing). Projections, not guarantees.
Landlord ↔ Tenant lean methodology
- Overall (STATE)
- 87 Strongly Landlord-Friendly
- State Florida
- 87 Strongly Landlord-Friendly · R+3
- County
- — inherits STATE
- City
- — inherits STATE
ZIP-level market 33064
- Home prices YoY
- -18.7%
- Rents YoY
- 1.8%
- Active inventory
- 595
- Price-to-rent
- 10.8×
Monthly cashflow live
- Estimated rent
- $2,936 high interval (Pro) →
- Mortgage (P&I)
- −$1,998
- Tax from tax record
- −$115 /mo · $1,379/yr
- Insurance
- −$159
- HOA
- −$0
- Vacancy / Maint / Mgmt
- −$617
- Net cashflow
- $48
Break-even live
Sensitivity live
| Price | -10% $263 | -5% $155 | +0% $48 | +5% $-60 | +10% $-168 |
|---|---|---|---|---|---|
| Rent | -10% $-184 | -5% $-68 | +0% $48 | +5% $164 | +10% $280 |
| Rate | -1.0pp $239 | -0.5pp $144 | base $48 | +0.5pp $-51 | +1.0pp $-152 |
UW: 25.0% down · 7.5% · 30yr · 1.5% tax · 5.0% vac · 8.0% maint · 8.0% mgmt
Financing live
Cash to close
- Down payment
- $95,250
- Closing costs
- $11,430
- Reserves months
- —
- Total cash needed
- —
Loan-product check · same deal, 3 products live
Conventional
25% down · 7.5% · 30yr
- Down + closing
- —
- Monthly P&I
- —
- Monthly cashflow
- —
- DSCR
- —
- Eligible?
- —
Personal DTI + credit; lowest rate.
DSCR
20% down · 8.5% · 30yr
- Down + closing
- —
- Monthly P&I
- —
- Monthly cashflow
- —
- DSCR
- —
- Eligible?
- —
No personal income docs; deal must DSCR.
Hard money
10% down · 12.0% · 12mo
- Down + closing
- —
- Monthly P&I
- —
- Monthly cashflow
- —
- DSCR
- —
- Eligible?
- —
Short-term bridge; refi at stabilization.
Rent comps 40 comps
| Address | Beds | Baths | Sqft | Rent | $/sqft | DOM | Units | Dist |
|---|---|---|---|---|---|---|---|---|
| 3850 NE 12th Ter Pompano Beach, FL | 3.0 | 2.0 | 1528 | $4,200 | $2.75 | 18d | 1 | 0.11mi |
| 3850 NE 12th Ter Pompano Beach, FL | 3.0 | 2.0 | 1528 | $3,500 | $2.29 | 0d | 1 | 0.11mi |
| 3743 NE 16th Ter Pompano Beach, FL | 3.0 | 2.0 | 1806 | $3,400 | $1.88 | 4d | 1 | 0.37mi |
| 1330 NE 41st Dr Unit 1 Pompano Beach, FL | 2.0 | 2.0 | 1280 | $3,300 | $2.58 | 6d | 1 | 0.39mi |
| 3180 NE 10th Ter Pompano Beach, FL | 2.0 | 1.0 | 991 | $2,700 | $2.72 | 26d | 1 | 0.40mi |
| 4211 NE 13th Ave Unit 1332459P Pompano Beach, FL | 3.0 | 2.0 | 1291 | $10,288 | $7.97 | 24d | 1 | 0.43mi |
| 1530 NE 33rd St Unit 1530 Pompano Beach, FL | 2.0 | 1.0 | 893 | $2,100 | $2.35 | 26d | 1 | 0.46mi |
| 3951 NE 17th Ave #703 Pompano Beach, FL | 2.0 | 2.0 | 1250 | $2,500 | $2.00 | 9d | 1 | 0.46mi |
| 1510 NE 32nd Pl Pompano Beach, FL | 2.0 | 1.0 | 893 | $2,650 | $2.97 | 26d | 1 | 0.48mi |
| 4270 NE 12th Ter Pompano Beach, FL | 2.0 | 1.0 | 1173 | $2,200 | $1.88 | 26d | 1 | 0.51mi |
| 1400 NE 43rd Ct Unit 1400 Pompano Beach, FL | 3.0 | 1.0 | 1098 | $2,900 | $2.64 | 26d | 1 | 0.56mi |
| 3050 NE 9th Ter Pompano Beach, FL | 3.0 | 2.0 | 1400 | $2,850 | $2.04 | 7d | 1 | 0.56mi |
| 4010 NE 18th Ave Unit 4010 Pompano Beach, FL | 3.0 | 2.0 | 1180 | $2,790 | $2.36 | 4d | 1 | 0.56mi |
| 4010 NE 18th Ave Unit 4010 Pompano Beach, FL | 3.0 | 2.0 | 1180 | $2,850 | $2.42 | 26d | 1 | 0.56mi |
| 1410 NE 43rd Ct Pompano Beach, FL | 3.0 | 1.5 | 1244 | $2,476 | $1.99 | 26d | 1 | 0.56mi |
| 3120 NE 8th Ave Pompano Beach, FL | 3.0 | 2.0 | 1538 | $2,999 | $1.95 | 26d | 1 | 0.57mi |
| 1821 NE 40th Ct #305 Pompano Beach, FL | 2.0 | 2.0 | 1250 | $2,600 | $2.08 | 19d | 1 | 0.59mi |
| 1473 NE 30th Ct Pompano Beach, FL | 3.0 | 2.0 | 1147 | $3,500 | $3.05 | 4d | 1 | 0.61mi |
| 1648 NE 31st Ct Pompano Beach, FL | 3.0 | 1.0 | 1159 | $2,500 | $2.16 | 16d | 1 | 0.64mi |
| 1573 NE 30th Ct Pompano Beach, FL | 3.0 | 2.0 | 1439 | $3,500 | $2.43 | 26d | 1 | 0.65mi |
| 3421 NE 5th Ave Unit A Pompano Beach, FL | 2.0 | 1.0 | 970 | $2,500 | $2.58 | 26d | 1 | 0.66mi |
| 1558 NE 30th St Pompano Beach, FL | 1.0 | 1.0 | 1511 | $2,500 | $1.65 | 7d | 1 | 0.72mi |
| 2849 NE 13th Ave Pompano Beach, FL | 3.0 | 2.0 | 972 | $3,100 | $3.19 | 26d | 1 | 0.72mi |
| 2849 NE 13th Ave Pompano Beach, FL | 3.0 | 2.0 | 972 | $3,200 | $3.29 | 7d | 1 | 0.72mi |
| 4350 NE 18th Ave Pompano Beach, FL | 2.0 | 1.0 | 920 | $2,500 | $2.72 | 18d | 1 | 0.75mi |
| 2313 Vintage Dr Lighthouse Point, FL | 2.0 | 2.5 | 1430 | $3,000 | $2.10 | 19d | 1 | 0.76mi |
| 2351 Vintage Dr Unit 2351 Lighthouse Point, FL | 2.0 | 2.5 | 1430 | $3,100 | $2.17 | 18d | 1 | 0.82mi |
| 2351 Vintage Dr Unit 2351 Lighthouse Point, FL | 2.0 | 2.5 | 1430 | $3,100 | $2.17 | 17d | 1 | 0.82mi |
| 4411 N Federal Hwy Pompano Beach, FL | 1.0–3.0 | 1.0–2.0 | 1039 | $2,396 | $2.31 | 0d | 20 | 0.85mi |
| 520 NE 45th St Deerfield Beach, FL | 3.0 | 2.0 | 1030 | $2,800 | $2.72 | 26d | 1 | 0.86mi |
| 261 NE 40th St Deerfield Beach, FL | 3.0 | 2.0 | 1153 | $2,899 | $2.51 | 15d | 1 | 0.87mi |
| 261 NE 40th St #261 Pompano Beach, FL | 3.0 | 2.0 | 1208 | $2,949 | $2.44 | 12d | 1 | 0.87mi |
| 261 NE 40th St #261 Pompano Beach, FL | 3.0 | 2.0 | 1208 | $2,899 | $2.40 | 9d | 1 | 0.87mi |
| 2640 NE 10th Ter Pompano Beach, FL | 3.0 | 2.5 | 1177 | $4,100 | $3.48 | 26d | 1 | 0.89mi |
| 1900 NE 29th St Unit 2c Lighthouse Point, FL | 2.0 | 2.0 | 1220 | $2,250 | $1.84 | 26d | 1 | 0.90mi |
| 2121 NE 42nd Ct Unit 103C Lighthouse Point, FL | 2.0 | 2.0 | 960 | $1,795 | $1.87 | 26d | 1 | 0.92mi |
| 1921 NE 28th Ct Lighthouse Point, FL | 3.0 | 2.0 | 1258 | $3,995 | $3.18 | 26d | 1 | 0.93mi |
| 4030 NE 2nd Ter Deerfield Beach, FL | 3.0 | 2.0 | 1740 | $3,650 | $2.10 | 14d | 1 | 0.97mi |
| 4030 NE 2nd Ter Deerfield Beach, FL | 3.0 | 2.0 | 1740 | $3,650 | $2.10 | 16d | 1 | 0.97mi |
| 4771 NE 17th Ave Pompano Beach, FL | 3.0 | 1.0 | 1400 | $2,750 | $1.96 | 9d | 1 | 0.98mi |
Listing history 13 events
-
2026-05-08status Pending
-
2026-04-02price $381,000
-
2026-03-05price $385,000
-
2026-02-09status Active
-
2026-01-31historical $1,758
-
2026-01-29$1,758
-
2026-01-28status Pending
-
2026-01-22$390,000 Active
-
2025-12-06soldstatus $325,100
-
2025-12-03$325,100
-
2025-12-02soldstatus $325,100
-
1991-08-22soldstatus $78,000
-
1991-08-22soldstatus $78,000
ⓘ Source: listings_history table (triggers on properties + properties_extension) + one-shot
backfill from property_details.listing_events for pre-trigger history.
Tax reassessment forecast FL · Resets to sale price
- Current annual tax
- $1,379 · $115/mo
- Projected year-2 tax
- $3,162 · $264/mo
- Expected delta
- +$1,783/yr (+$149/mo · 129.3%)
ⓘ Screening estimate from a state-policy table — verify with the county assessor before closing.
Climate risk First Street
- Flood 1/10 Low FEMA zone X (shaded) · 0% chance over 30 yrs
- Wildfire 1/10 Low
- Heat 9/10 Extreme 7 d/yr ≥107°F today · 26 d/yr by 30 yrs out
- Wind 10/10 Extreme 99% chance of damaging wind over 30 yrs
- Air quality 2/10 Low 1 unhealthy d/yr today · 3 by 30 yrs out
Nearby sold comps map
Loading sold comps map…
Walkable amenities ~0.75 mi
Loading nearby amenities…
Taxation est. · year 1
- Rental income
- $35,229
- − Mortgage interest
- −$21,342
- − Property taxes
- −$1,379
- − Insurance
- −$1,905
- − Repairs & maintenance
- −$2,818
- − Management
- −$2,818
- − Depreciation
- −$11,084
- Taxable loss
- −$6,117
- Est. tax savings @ 24.0%
- +$1,468
- After-tax cash flow
- $2,039/yr
For passive investors: Depreciation is non-cash, so a rental often shows a tax loss while cash-flowing — sheltering income. Rental losses are passive: they offset passive income freely, and up to $25,000/yr can offset ordinary (W-2) income if you actively participate and your MAGI is under $100k (phasing out to $0 by $150k); unused losses carry forward. On sale, claimed depreciation is recaptured at up to 25%, and gains may owe capital-gains tax (a 1031 exchange can defer both). Figures are a year-1 estimate at your 24.0% rate — not tax advice; consult a CPA.
Schools (NCES district)
- District
- Broward
- NCES district ID
- 1200180
- Math proficiency
- 42% ▼ -18.00%
- Reading proficiency
- 53% ▼ -5.00%
- Median HH income
- $52,139
- Composite
- 40.88/100
- National rank
- #3621
- State rank
- #46 of 73 in FL
Livability — Pompano Beach
- Score
- 74/100
- State rank
- #284
- US rank
- #4541
Category grades
Schools grade is shown separately in the Schools card above.
Census & demographics
- Census place
- Pompano Beach, FL
- County
- Broward County · 1,963,430 people
- City population
- 155,861
- Metro
- Miami-Fort Lauderdale-Pompano Beach, FL
- Population (ZIP)
- 64,563
- Household income
- $71,301
- Rent vs Own
- Severe rent burden
- 2907.0
Population outlook (Broward County) Hauer SSP2
- Today (2025)
- 2,207,033 people
- By 2030
- 2,360,704 · +7.0%
- By 2040
- 2,661,208 · +20.6%
- By 2050
- 2,946,698 · +33.5%
- By 2075
- 3,602,273 · +63.2%
- By 2100
- 3,970,984 · +79.9%
Race, ethnicity, and origin ACS 2023
- Neighborhood character
- Highly diverse neighborhood (Simpson 0.75)
- Race & ethnicity
- White 34% Hispanic / Latino 27% Black 25% Two or more races 24% Asian 2%
- Hispanic origin (detail)
- Mexican 4% Puerto Rican 4% Cuban 4% Dominican 2%
- Common ancestry
- Hispanic 13% Estonian 10% Romanian 1%
- Foreign-born
- 43% · Canada, Jamaica, Dominican Republic
- Languages at home
- 45% English-only · Spanish 23% French/Haitian/Cajun 16% Other Indo-European 13%
Political lean MEDSL · Broward
- 2024 margin
- D (+17.0) · D 58.0% · R 41.0%
- 2008→2024 swing
- -17.8pp toward R · 2008: 34.7pp · 2024: 17.0pp
- All cycles
- 2024: D+17.0 2020: D+29.8 2016: D+35.0 2012: D+34.9 2008: D+34.7
Not yet ingested
- Civics
- —
Market trends
- HPI YoY
- ▼ -109.09%
- Current HPI
- 474.7007
- Rent YoY
- ▲ 1.75%
- Metro
- Miami-Fort Lauderdale-Pompano Beach, FL
- State GDP YoY
- ▲ 3.28%
- F500 in state
- 36
Industry mix (Fortune 500 HQ in FL)
| Industry | F500 HQs | Revenue |
|---|---|---|
| Industrial Technology | 2 | $29B |
|
||
| Insurance | 2 | $17B |
|
||
| Retail | 1 | $60B |
|
||
| Technology Distribution | 1 | $58B |
|
||
| Homebuilding | 1 | $35B |
|
||
| Technology Manufacturing | 1 | $35B |
|
||
Price history
+388.5% since first listed13 events — show timeline
- 2026-05-08 Pending — Beaches MLS
- 2026-04-02 Price Changed $381,000 Beaches MLS
- 2026-03-05 Price Changed $385,000 Beaches MLS
- 2026-02-09 Relisted — Beaches MLS
- 2026-01-31 Rental Removed $1,758 RENTSPREE
- 2026-01-29 Listed for Rent $1,758 RENTSPREE
- 2026-01-28 Pending — Beaches MLS
- 2026-01-22 Listed $390,000 Beaches MLS
- 2025-12-06 Sold (MLS) $325,100 Beaches MLS
- 2025-12-03 Listed $325,100 Beaches MLS
- 2025-12-02 Sold (Public Records) $325,100 Public Records
- 1991-08-22 Sold (Public Records) $78,000 Public Records
- 1991-08-22 Sold (Public Records) $78,000 Public Records
Property tax history
+3.1%/yrLatest (2025): $1,379 · +5.2% YoY. Source: county tax records.
Cash-flow waterfall
monthlySold comps — $/sqft
last 12 mo · ≤1 miLoading sold comps…