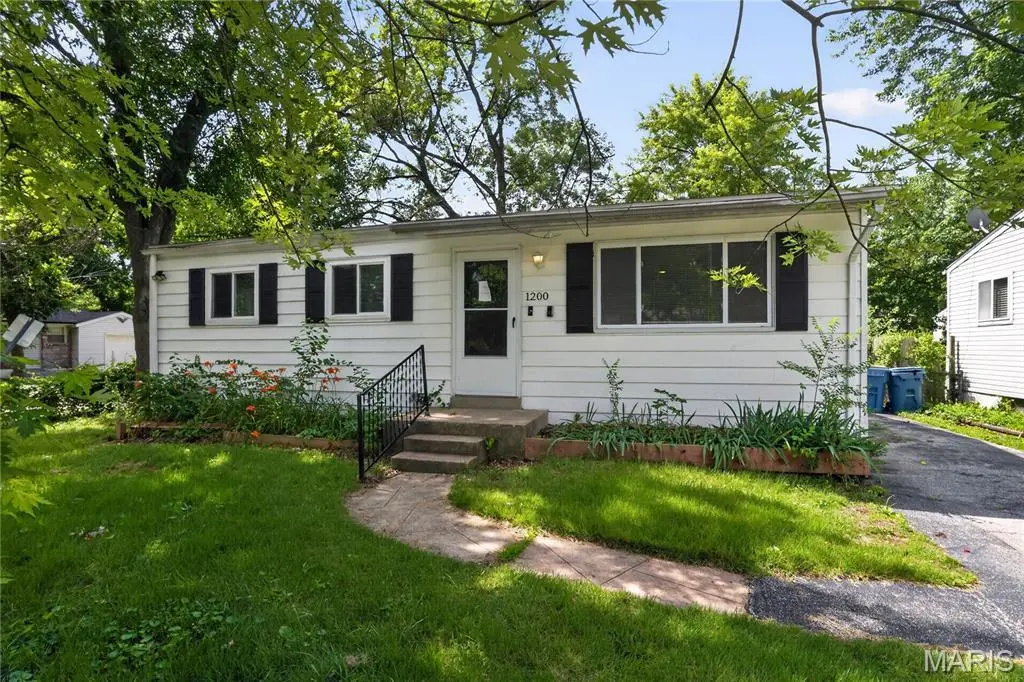
1200 Congress Ave · Spanish Lake, MO
Flood risk 1/10 · Minimal
- FEMA flood zone
- X (unshaded)
- Chance of flooding over 30 yrs
- 0.0%
- Est. flood insurance / yr
- $473 – $860
Fire risk 1/10 · Minimal
- Est. fire insurance / yr
- $1,054 – $1,958
Heat risk 5/10 · Moderate
- Hot days now (above 107°F)
- 7 days/yr
- Hot days in 30 yrs
- 21 days/yr
Wind risk 2/10 · Minimal
- Chance of severe wind over 30 yrs
- 1.0%
Air-quality risk 4/10 · Minor
- Unhealthy air days now
- 4 days/yr
- Unhealthy air days in 30 yrs
- 5 days/yr
Risk factors via First Street. Map © Google.
Why this score? — see what drove the C+ grade
The composite is a weighted blend of 9 inputs, each scored 0–100. Each bar is that input's sub-score; the figure is the points it added to the 100-point composite (weight × sub-score).
- Cash flow +30.0/30.0
- 1% rule +10.0/10.0
- DSCR +10.0/10.0
- ARV discount +4.7/15.0
- Livability +2.6/5.0
- Condition / age +2.5/5.0
- Rent growth +2.1/5.0
- Schools +1.7/10.0
- Appreciation +0.0/10.0
$89,900
🖨 Deal sheet 📄 Offer letter ✓ Due diligence
Listing remarks
Charming 2-bedroom, 1-bath ranch located in the Larimore Hills subdivision of unincorporated St. Louis County. This single-family home provides 864 sq ft of living space on a level lot. Built in 1959, the property features a functional layout with a spacious living room, eat-in kitchen, and full basement providing additional storage or potential use. Convenient off-street parking and easy access to major highways, schools, and local amenities.
Key facts
- Full basement
- Eat-in kitchen
- Functional layout
Tags
Property features AI
Finance
- Other: Property type: Residential — Single Family Residence; Above grade finished area reported as 864 (source: public records); Road surface: Asphalt/paved
- HOA & community: No association amenities
Exterior
- Parking: Driveway and off-street parking
- Utilities: Public water; Public sewer; Electric service by Ameren; Cable, electricity, natural gas, sewer and water available
- Home design: Single-family residence (house); One-level layout; Private ownership
- Construction: Frame construction with vinyl siding; Asphalt composition shingle roof; Concrete perimeter foundation; Built (year source: public records)
- Exterior features: Level lot; Chain link partial fencing; No patios or porches listed; No pool
Interior
- Kitchen: Eat-in kitchen with standard layout
- Bedrooms: 2 bedrooms on the main level (Primary bedroom and one secondary bedroom)
- Flooring: Other
- Bathrooms: 1 full bathroom (main level) with tub/shower combo
- Heating & cooling: Forced air heating (natural gas); Central air conditioning
- Interior features: Insulated windows; Full unfinished basement; Unfinished storage/utility area in basement
- Laundry & utility: Laundry area in basement
Neighborhood map
What this means for you Summary
Snapshot
- This is a 3-bed/1.0-bath single-family listed at $90k.
Deal economics
- At list price, monthly cash flow is $544 ($7k/yr) — positive.
- The deal already cash-flows at list — no discount required.
- Meets the 1% rule at list price ($1k rent vs $90k).
- Cap rate 13.5% vs local median 7.9% in Spanish Lake — top-decile yield for the area; either an underpriced asset or a hidden risk that comps aren't pricing in. Stress-test before assuming the spread holds.
Location & tenants
- Location reads 51/100 on livability (#870 in MO) — a working-class tenant base; expect higher turnover. Strengths: cost of living A+, housing A+; Watch: crime F, amenities F, commute F.
- Hazelwood (suburban): math 11% / reading 26% proficiency, ranked #306 of 324 in MO (top 94%) — low school quality limits family demand, transient renter base, plan for 1-2y turnover.
- Zoned schools: Larimore Elem. (math 2% / reading 12%, grade F, #1,058 of 1,115 statewide, top 96%, 341 students, 99% FRL); Hazelwood East High (math 5% / reading 21%, grade F, #495 of 521 statewide, top 95%, 1,264 students, 66% FRL) — zoned schools average 82% FRL vs 53% district-wide (29 pts higher); higher-poverty schools than district average — tighter screening recommended.
- Market conditions: Rents soft (-1.5%/yr); 101 active listings in the ZIP; 20 comparable units currently listed for rent nearby; rentals at typical pace (median 24d on market — plan ~3-4 weeks tenant-placement turnaround); 40% of comp listings sitting > 30 days — soft ceiling on asking rent; 920 units permitted in St. Louis County in 2024 (250 in 5+ unit buildings).
- This rent runs 30% of the median local income ($56k/yr) — at the standard rent-burdened threshold; future hikes will face affordability resistance.
Forward outlook
- Local home prices are declining (-3.0%/yr); year-one equity from $622 of loan paydown is wiped out by about $3k of value loss. Plan a longer hold.
- At projected returns (-3.0% appreciation + 0.0% rent growth), your $25k cash investment doubles in ~6 years — after that, you're playing with house money.
Negotiation context
- Only 6 days on market — expect competitive offers; lowballing is unlikely to land.
Risks & watch-outs
- Watch-outs: built in 1959 — expect roof / HVAC / electrical / plumbing capex.
- Climate carrying-cost: extreme-heat days projected 7→21/yr by 2055 (HVAC capex compounding) — expect insurance premiums to compound above CPI over the hold.
Questions for the listing agent
- Built in 1959 — when were the roof, HVAC, electrical panel, plumbing, and water heater last replaced?
- Is there a deadline driving the sale (1031 exchange, divorce, estate, relocation)? That informs how much negotiation room exists.
- Schools are F-rated, which usually means shorter tenancies and higher turnover. Who's the typical renter profile here, and what's been the actual vacancy rate?
- Crime grade is F in this area — have there been break-ins, vandalism, or insurance claims at this property in the last 3 years? What carrier currently insures it and at what premium?
- What's the average days-on-market for RENTAL listings here right now (not sales)? A rising rental-DOM trend means longer vacancies and softer asking-rent achievability than the comps imply.
- What's the recent tenant-quality profile in this submarket — average credit score on applications, eviction rate, late-payment / NSF rate, and stable-employment percentage? A property-management company in the area should have these aggregated.
- How much new for-sale + rental construction is in the pipeline within 1–3 miles? Heavy new supply typically softens prices + rents 12–24 months out; constrained supply supports both.
Investment metrics
- 1% rule
- 1.57% ✓
- Cap rate
- 13.55%
- Cash-on-cash
- 25.92%
- DSCR
- 2.15
- GRM
- 5.3
CMA / ARV
- ARV (on-the-fly)
- $84,672
- Comps found
- 12
Show comp detail 12 sales within ~0.75 mi
| Address | Dist | Beds/Ba | Sqft | Sold | Price | $/sf | Match |
|---|---|---|---|---|---|---|---|
| 1200 Baron Ave | 0.05mi | 3/1.0 | 864 (0%) | 2mo | $77,500 | $90 | 96 |
| 1219 Congress Ave | 0.04mi | 3/1.0 | 864 (0%) | 4mo | $29,900 | $35 | 95 |
| 1157 Scott | 0.07mi | 3/1.0 | 864 (0%) | 3mo | $137,900 | $160 | 94 |
| 1221 Scott Ave | 0.08mi | 3/1.0 | 864 (0%) | 4mo | $85,000 | $98 | 93 |
| 1136 Walker Ave | 0.22mi | 3/1.0 | 864 (0%) | 3mo | $125,000 | $145 | 87 |
| 1125 Walker Ave | 0.25mi | 3/1.0 | 864 (0%) | 3mo | $114,999 | $133 | 86 |
| 1141 Walker Ave | 0.23mi | 2/1.5 (-1) | 864 (0%) | 3mo | $105,000 | $122 | 80 |
| 1231 Reale Ave | 0.27mi | 2/1.5 (-1) | 864 (0%) | 2mo | $69,900 | $81 | 78 |
| 1209 Northdale Ave | 0.53mi | 2/1.0 (-1) | 864 (0%) | 1mo | $79,900 | $92 | 70 |
| 1072 Prigge Rd | 0.23mi | 3/1.5 | 960 (+11%) | 0mo | $99,900 | $104 | 68 |
| 1135 Cove Ln | 0.34mi | 2/1.0 (-1) | 936 (+8%) | 2mo | $85,000 | $91 | 64 |
| 1459 Cove Ln | 0.56mi | 3/1.5 | 988 (+14%) | 3mo | $79,900 | $81 | 46 |
Match score weights: distance 35% · size 25% · config 20% · recency 20%. Top-matched comps best support the ARV.
Projected returns pro-forma
-3.0% appreciation · 0.0% rent growth · sell at horizon
- IRR
- 16.3%
- Equity multiple
- 1.63×
- Total profit
- $15,899
- Equity at exit
- $13,404
- IRR
- 22.7%
- Equity multiple
- 2.68×
- Total profit
- $42,363
- Equity at exit
- $7,773
Cash invested: $25,172 (down + closing). Projections, not guarantees.
Landlord ↔ Tenant lean methodology
- Overall (STATE)
- 81 Strongly Landlord-Friendly
- State Missouri
- 81 Strongly Landlord-Friendly · R+10
- County
- — inherits STATE
- City
- — inherits STATE
ZIP-level market 63138
- Home prices YoY
- -31.0%
- Rents YoY
- -1.5%
- Active inventory
- 101
- Price-to-rent
- 5.3×
Monthly cashflow live
- Estimated rent
- $1,416 high interval (Pro) →
- Mortgage (P&I)
- −$471
- Tax from tax record
- −$66 /mo · $792/yr
- Insurance
- −$37
- HOA
- −$0
- Vacancy / Maint / Mgmt
- −$297
- Net cashflow
- $544
Break-even live
UW: 25.0% down · 7.5% · 30yr · 1.5% tax · 5.0% vac · 8.0% maint · 8.0% mgmt
Financing live
Cash to close
- Down payment
- $22,475
- Closing costs
- $2,697
- Reserves months
- —
- Total cash needed
- —
Loan-product check · same deal, 3 products live
Conventional
25% down · 7.5% · 30yr
- Down + closing
- —
- Monthly P&I
- —
- Monthly cashflow
- —
- DSCR
- —
- Eligible?
- —
Personal DTI + credit; lowest rate.
DSCR
20% down · 8.5% · 30yr
- Down + closing
- —
- Monthly P&I
- —
- Monthly cashflow
- —
- DSCR
- —
- Eligible?
- —
No personal income docs; deal must DSCR.
Hard money
10% down · 12.0% · 12mo
- Down + closing
- —
- Monthly P&I
- —
- Monthly cashflow
- —
- DSCR
- —
- Eligible?
- —
Short-term bridge; refi at stabilization.
Rent comps 20 comps
| Address | Beds | Baths | Sqft | Rent | $/sqft | DOM | Units | Dist |
|---|---|---|---|---|---|---|---|---|
| 1141 Scott Ave Saint Louis, MO | 3.0 | 1.0 | 864 | $1,400 | $1.62 | 22d | 1 | 0.09mi |
| 1218 Walker Ave Saint Louis, MO | 3.0 | 1.0 | 936 | $1,275 | $1.36 | 24d | 1 | 0.17mi |
| 1223 Walker Ave Saint Louis, MO | 4.0 | 1.0 | 936 | $1,800 | $1.92 | 44d | 1 | 0.20mi |
| 1376 Cove Ln Saint Louis, MO | 3.0 | 1.0 | 925 | $1,365 | $1.48 | 24d | 1 | 0.34mi |
| 1359 Cove Ln Saint Louis, MO | 3.0 | 1.0 | 925 | $1,427 | $1.54 | 2d | 1 | 0.34mi |
| 1132 Redman Blvd Saint Louis, MO | 4.0 | 1.0 | 1080 | $1,195 | $1.11 | 44d | 1 | 0.35mi |
| 11891 Bridgevale Ave Saint Louis, MO | 3.0 | 1.0 | 864 | $1,350 | $1.56 | 24d | 1 | 0.38mi |
| 11930 Criterion Ave Saint Louis, MO | 3.0 | 1.0 | 816 | $1,350 | $1.65 | 44d | 1 | 0.55mi |
| 1504 Redman Blvd Saint Louis, MO | 3.0 | 2.0 | 1014 | $1,299 | $1.28 | 4d | 1 | 0.58mi |
| 11921 Larimore Rd Saint Louis, MO | 3.0 | 1.0 | 1078 | $1,100 | $1.02 | 44d | 1 | 0.59mi |
| 1455 Broadlawns Ln Saint Louis, MO | 3.0 | 1.0 | 912 | $1,395 | $1.53 | 12d | 1 | 0.69mi |
| 1473 Broadlawns Ln Saint Louis, MO | 3.0 | 1.0 | 1000 | $1,400 | $1.40 | 44d | 1 | 0.71mi |
| 1333 N Garden Dr St. Louis, MO | 2.0 | 1.0 | 626 | $1,100 | $1.76 | 44d | 1 | 0.84mi |
| 1342 N Garden Dr Saint Louis, MO | 2.0 | 1.0 | 626 | $1,100 | $1.76 | 2d | 3 | 0.87mi |
| 1708 San Remo Ct St. Louis, MO | 1.0–3.0 | 1.0–1.5 | 1053 | $1,300 | $1.23 | 2d | 9 | 1.03mi |
| 1321 Dominica Dr Saint Louis, MO | 3.0 | 1.0 | 1012 | $1,400 | $1.38 | 44d | 1 | 1.04mi |
| 12367 Horizon Village Dr Unit 12367 I St. Louis, MO | 2.0 | 1.0 | 836 | $995 | $1.19 | 24d | 1 | 1.44mi |
| 257 Glen Garry Rd Saint Louis, MO | 3.0 | 1.0 | 873 | $1,025 | $1.17 | 15d | 1 | 1.46mi |
| 10527 Prestwick Dr Saint Louis, MO | 3.0 | 2.0 | 854 | $1,395 | $1.63 | 7d | 1 | 1.48mi |
| 12401 Horizon Village Dr Unit 12415 A St. Louis, MO | 2.0 | 1.0 | 836 | $995 | $1.19 | 44d | 1 | 1.50mi |
Listing history 6 events
-
2026-06-18days on market $89,900 Active 6 DOM
-
2026-06-17days on market $89,900 Active 5 DOM
-
2026-06-16days on market $89,900 Active 4 DOM
-
2026-06-15days on market $89,900 Active 3 DOM
-
2026-06-13remarks 447-char remark
-
2026-06-13$89,900 Active 1 DOM
ⓘ Source: listings_history table (triggers on properties + properties_extension) + one-shot
backfill from property_details.listing_events for pre-trigger history.
Tax reassessment forecast MO · Resets to sale price
- Current annual tax
- $792 · $66/mo
- Projected year-2 tax
- $872 · $73/mo
- Expected delta
- +$80/yr (+$7/mo · 10.1%)
ⓘ Screening estimate from a state-policy table — verify with the county assessor before closing.
Climate risk First Street
- Flood 1/10 Low FEMA zone X (unshaded) · 0% chance over 30 yrs
- Wildfire 1/10 Low
- Heat 5/10 Major 7 d/yr ≥107°F today · 21 d/yr by 30 yrs out
- Wind 2/10 Low 100% chance of damaging wind over 30 yrs
- Air quality 4/10 Moderate 4 unhealthy d/yr today · 5 by 30 yrs out
Nearby sold comps map
Loading sold comps map…
Walkable amenities ~0.75 mi
Loading nearby amenities…
Taxation est. · year 1
- Rental income
- $16,990
- − Mortgage interest
- −$5,036
- − Property taxes
- −$792
- − Insurance
- −$450
- − Repairs & maintenance
- −$1,359
- − Management
- −$1,359
- − Depreciation
- −$2,615
- Taxable income
- $5,379
- Est. tax owed @ 24.0%
- −$1,291
- After-tax cash flow
- $5,232/yr
For passive investors: Depreciation is non-cash, so a rental often shows a tax loss while cash-flowing — sheltering income. Rental losses are passive: they offset passive income freely, and up to $25,000/yr can offset ordinary (W-2) income if you actively participate and your MAGI is under $100k (phasing out to $0 by $150k); unused losses carry forward. On sale, claimed depreciation is recaptured at up to 25%, and gains may owe capital-gains tax (a 1031 exchange can defer both). Figures are a year-1 estimate at your 24.0% rate — not tax advice; consult a CPA.
Schools (NCES district)
- District
- Hazelwood
- NCES district ID
- 2913830
- Math proficiency
- 11% ▼ -13.00%
- Reading proficiency
- 26% ▼ -6.00%
- Median HH income
- $51,621
- Composite
- 16.77/100
- National rank
- #9156
- State rank
- #306 of 324 in MO
Livability — Spanish Lake
- Score
- 51/100
- State rank
- #870
- US rank
- #25189
Category grades
Schools grade is shown separately in the Schools card above.
Census & demographics
- Census place
- Spanish Lake, MO
- County
- Saint Louis County · 888,823 people
- City population
- 18,233
- Metro
- St. Louis, MO-IL
- Population (ZIP)
- 18,233
- Household income
- $56,096
- Rent vs Own
- Severe rent burden
- 925.0
Population outlook (St. Louis County) Hauer SSP2
- Today (2025)
- 1,025,227 people
- By 2030
- 1,028,023 · +0.3%
- By 2040
- 1,020,940 · -0.4%
- By 2050
- 1,007,280 · -1.8%
- By 2075
- 987,277 · -3.7%
- By 2100
- 921,984 · -10.1%
Race, ethnicity, and origin ACS 2023
- Neighborhood character
- Predominantly Black (81%)
- Race & ethnicity
- Black 81% White 14% Two or more races 4% Hispanic / Latino 1%
- Foreign-born
- 2% · Canada
- Languages at home
- 98% English-only · Spanish 1%
Political lean MEDSL · St. Louis
- 2024 margin
- Strong D (+23.4) · D 60.8% · R 37.4% · Other 1.7%
- 2008→2024 swing
- +3.5pp toward D · 2008: 19.9pp · 2024: 23.4pp
- All cycles
- 2024: D+23.4 2020: D+24.0 2016: D+16.2 2012: D+13.7 2008: D+19.9
Not yet ingested
- Civics
- —
Market trends
- HPI YoY
- ▼ -74.09%
- Current HPI
- 165.2146
- Rent YoY
- ▼ -1.54%
- Metro
- St. Louis, MO-IL
- State GDP YoY
- ▲ 1.84%
- F500 in state
- 20
Industry mix (Fortune 500 HQ in MO)
| Industry | F500 HQs | Revenue |
|---|---|---|
| Healthcare | 1 | $163B |
|
||
| Insurance | 1 | $21B |
|
||
| Industrial Technology | 1 | $17B |
|
||
| Retail | 1 | $16B |
|
||
| Industrial Distribution | 1 | $10B |
|
||
| Utilities | 1 | $9B |
|
||
Price history
+85.4% since first listed6 events — show timeline
- 2026-06-12 Listed $89,900 MARIS as Distributed by MLS Grid
- 2018-04-30 Sold (Public Records) $600,000 Public Records
- 2010-12-22 Sold (Public Records) $369,000 Public Records
- 1999-04-05 Sold (Public Records) $48,500 Public Records
- 1992-10-09 Sold (Public Records) — Public Records
- 1959-06-15 Sold (Public Records) — Public Records
Property tax history
-6.2%/yrLatest (2022): $792 · +1.4% YoY. Source: county tax records.
Cash-flow waterfall
monthlySold comps — $/sqft
last 12 mo · ≤1 miLoading sold comps…