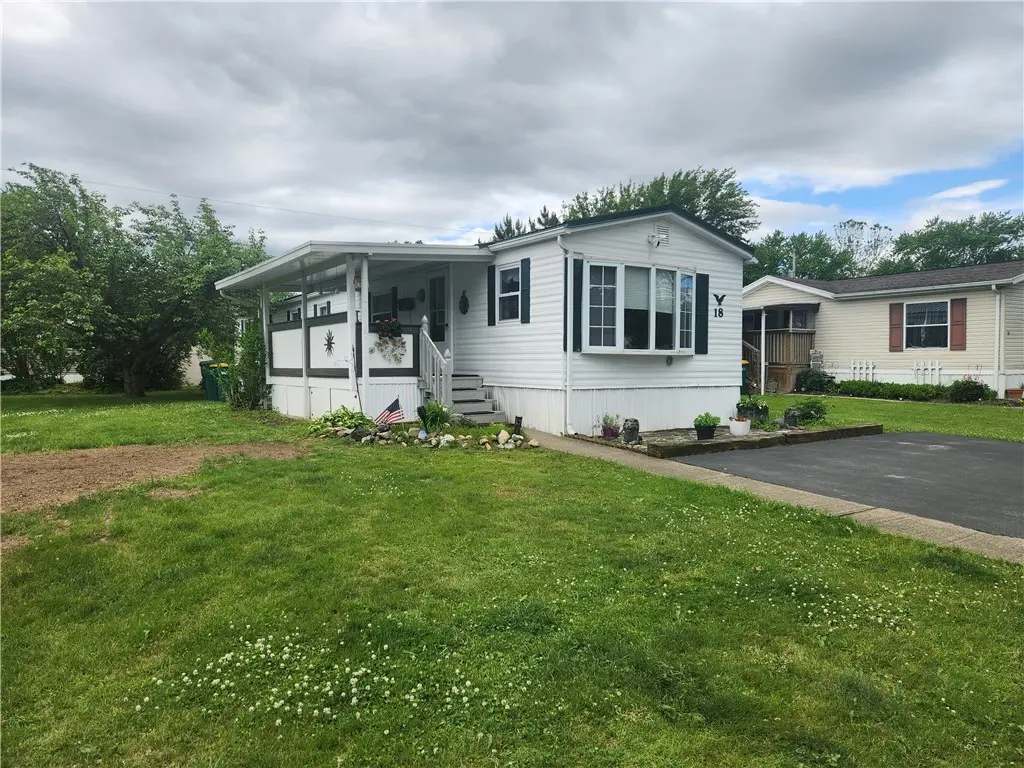
18 Meadowlark Dr · East Avon, NY
Flood risk 1/10 · Minimal
- FEMA flood zone
- —
- Chance of flooding over 30 yrs
- 0.0%
- Est. flood insurance / yr
- —
Fire risk 1/10 · Minimal
- Est. fire insurance / yr
- $691 – $1,283
Heat risk 2/10 · Minimal
- Hot days now (above 95°F)
- 7 days/yr
- Hot days in 30 yrs
- 15 days/yr
Wind risk 1/10 · Minimal
- Chance of severe wind over 30 yrs
- —
Air-quality risk 2/10 · Minimal
- Unhealthy air days now
- 0 days/yr
- Unhealthy air days in 30 yrs
- 1 days/yr
Risk factors via First Street. Map © Google.
Why this score? — see what drove the B grade
The composite is a weighted blend of 9 inputs, each scored 0–100. Each bar is that input's sub-score; the figure is the points it added to the 100-point composite (weight × sub-score).
- Cash flow +30.0/30.0
- 1% rule +10.0/10.0
- DSCR +10.0/10.0
- ARV discount +7.5/15.0
- Schools +4.5/10.0
- Livability +3.0/5.0
- Condition / age +2.8/5.0
- Rent growth +2.5/5.0
- Appreciation +0.0/10.0
$49,900
🖨 Deal sheet (PDF) 📄 Offer letter ✓ Due diligence
Listing remarks
This well-maintained three bedroom, one bath single wide mobile home offers comfortable and affordable living in a quiet community park. The home features a functional layout with an eat-in kitchen. It also offers storage with a built-in cabinet. Oven is AS IS. Come make this ready to move in home yours! Will need to be park approved.
Key facts
- Quiet community park
- Built-in cabinet
- Eat-in kitchen
Tags
Property features AI
Finance
- HOA & community: Land lease $660
Exterior
- Parking: No garage
- Utilities: Public water (connected); Sewer connected
- Home design: Single-wide mobile home (Hallmark); 1 story; Resale
- Construction: Aluminum siding; Metal roof; Block foundation; Existing structure
- Exterior features: Blacktop driveway; Covered porch; Leased propane tank
Interior
- Kitchen: Dishwasher
- Bedrooms: 3 bedrooms on the main level
- Flooring: Carpet; Laminate; Varies
- Bathrooms: 1 full bathroom on the main level
- Heating & cooling: Propane heating; Central air conditioning
- Interior features: Eat-in kitchen
- Laundry & utility: Laundry on the main level; Propane water heater
Neighborhood map
What this means for you Summary
Snapshot
- This is a 3-bed/1.0-bath manufactured listed at $50k. Condition is rated average.
Deal economics
- At list price, monthly cash flow is $936 ($11k/yr) — positive.
- The deal already cash-flows at list — no discount required.
- Meets the 1% rule at list price ($2k rent vs $50k).
Location & tenants
- Location reads 60/100 on livability (#1,004 in NY) — a middle-class / working-renter tenant base. Strengths: housing A+, employment A-, cost of living B; Watch: schools F, crime F, amenities F.
- Avon Central School District (town): math 53% / reading 50% proficiency, ranked #349 of 590 in NY (top 59%) — acceptable for families but not a draw, mixed tenant base, ~2y average lease.
- Market conditions: 37 active listings in the ZIP; 86 units permitted in Livingston County in 2024 (0 in 5+ unit buildings).
Forward outlook
- Local home prices are declining (-3.0%/yr); year-one equity from $345 of loan paydown is wiped out by about $1k of value loss. Plan a longer hold.
- Livingston County population projected at -13% by 2050 — secular population decline; favor cash flow + early exit over multi-decade hold.
- At projected returns (-3.0% appreciation + 3.0% rent growth), your $14k cash investment doubles in ~2 years — after that, you're playing with house money.
Negotiation context
- Only 6 days on market — expect competitive offers; lowballing is unlikely to land.
Questions for the listing agent
- Is there a deadline driving the sale (1031 exchange, divorce, estate, relocation)? That informs how much negotiation room exists.
- Schools are F-rated, which usually means shorter tenancies and higher turnover. Who's the typical renter profile here, and what's been the actual vacancy rate?
- Crime grade is F in this area — have there been break-ins, vandalism, or insurance claims at this property in the last 3 years? What carrier currently insures it and at what premium?
- What's the average days-on-market for RENTAL listings here right now (not sales)? A rising rental-DOM trend means longer vacancies and softer asking-rent achievability than the comps imply.
- What's the recent tenant-quality profile in this submarket — average credit score on applications, eviction rate, late-payment / NSF rate, and stable-employment percentage? A property-management company in the area should have these aggregated.
- How much new for-sale + rental construction is in the pipeline within 1–3 miles? Heavy new supply typically softens prices + rents 12–24 months out; constrained supply supports both.
Investment metrics
- 1% rule
- 3.25% ✓
- Cap rate
- 28.79%
- Cash-on-cash
- 80.36%
- DSCR
- 4.58
- GRM
- 2.6
CMA / ARV
- ARV (on-the-fly)
- $30,492
- Comps found
- 5
Show comp detail 5 sales within ~0.75 mi
| Address | Dist | Beds/Ba | Sqft | Sold | Price | $/sf | Match |
|---|---|---|---|---|---|---|---|
| 9 Parkview | 0.17mi | 3/2.0 | 920 (-0%) | 2mo | $14,500 | $16 | 86 |
| 26 Meadowlark Dr | 0.05mi | 2/2.0 (-1) | 980 (+6%) | 2mo | $27,000 | $28 | 77 |
| 33 Harper Pkwy | 0.12mi | 2/1.5 (-1) | 980 (+6%) | 12mo | $35,500 | $36 | 67 |
| 68 Parkview Dr | 0.15mi | 2/1.0 (-1) | 980 (+6%) | 20mo | $45,900 | $47 | 61 |
| 43 Sycamore Drive Dr | 0.19mi | 2/2.0 (-1) | 980 (+6%) | 15mo | $32,000 | $33 | 60 |
Match score weights: distance 35% · size 25% · config 20% · recency 20%. Top-matched comps best support the ARV.
Projected returns pro-forma
-3.0% appreciation · 3.0% rent growth · sell at horizon
- IRR
- 80.6%
- Equity multiple
- 4.69×
- Total profit
- $51,533
- Equity at exit
- $7,440
- IRR
- 84.0%
- Equity multiple
- 9.71×
- Total profit
- $121,711
- Equity at exit
- $4,314
Cash invested: $13,972 (down + closing). Projections, not guarantees.
Landlord ↔ Tenant lean methodology
- Overall (STATE)
- 15 Strongly Tenant-Friendly
- State New York
- 15 Strongly Tenant-Friendly · D+10
- County
- — inherits STATE
- City
- — inherits STATE
ZIP-level market 14414
- Home prices YoY
- -14.1%
- Active inventory
- 37
- Price-to-rent
- 2.6×
Monthly cashflow live
- Estimated rent
- $1,621 medium interval (Pro) →
- Mortgage (P&I)
- −$262
- Tax est. 1.5%
- −$62 /mo · $748/yr
- Insurance
- −$21
- HOA
- −$0
- Vacancy / Maint / Mgmt
- −$340
- Net cashflow
- $936
Break-even live
Sensitivity live
| Price | -10% $970 | -5% $953 | +0% $936 | +5% $918 | +10% $901 |
|---|---|---|---|---|---|
| Rent | -10% $808 | -5% $872 | +0% $936 | +5% $1,000 | +10% $1,064 |
| Rate | -1.0pp $961 | -0.5pp $948 | base $936 | +0.5pp $923 | +1.0pp $910 |
UW: 25.0% down · 7.5% · 30yr · 1.5% tax · 5.0% vac · 8.0% maint · 8.0% mgmt
Financing live
Cash to close
- Down payment
- $12,475
- Closing costs
- $1,497
- Reserves months
- —
- Total cash needed
- —
Loan-product check · same deal, 3 products live
Conventional
25% down · 7.5% · 30yr
- Down + closing
- —
- Monthly P&I
- —
- Monthly cashflow
- —
- DSCR
- —
- Eligible?
- —
Personal DTI + credit; lowest rate.
DSCR
20% down · 8.5% · 30yr
- Down + closing
- —
- Monthly P&I
- —
- Monthly cashflow
- —
- DSCR
- —
- Eligible?
- —
No personal income docs; deal must DSCR.
Hard money
10% down · 12.0% · 12mo
- Down + closing
- —
- Monthly P&I
- —
- Monthly cashflow
- —
- DSCR
- —
- Eligible?
- —
Short-term bridge; refi at stabilization.
Listing history 6 events
-
2026-06-18days on market $49,900 Active 6 DOM
-
2026-06-17days on market $49,900 Active 5 DOM
-
2026-06-16days on market $49,900 Active 4 DOM
-
2026-06-15days on market $49,900 Active 3 DOM
-
2026-06-13remarks 336-char remark
-
2026-06-13$49,900 Active 1 DOM
ⓘ Source: listings_history table (triggers on properties + properties_extension) + one-shot
backfill from property_details.listing_events for pre-trigger history.
Climate risk First Street
- Flood 1/10 Low 0% chance over 30 yrs
- Wildfire 1/10 Low
- Heat 2/10 Low 7 d/yr ≥95°F today · 15 d/yr by 30 yrs out
- Wind 1/10 Low
- Air quality 2/10 Low 0 unhealthy d/yr today · 1 by 30 yrs out
Nearby sold comps map
Loading sold comps map…
Walkable amenities ~0.75 mi
Loading nearby amenities…
Taxation est. · year 1
- Rental income
- $19,451
- − Mortgage interest
- −$2,795
- − Property taxes
- −$748
- − Insurance
- −$250
- − Repairs & maintenance
- −$1,556
- − Management
- −$1,556
- − Depreciation
- −$1,452
- Taxable income
- $11,094
- Est. tax owed @ 24.0%
- −$2,663
- After-tax cash flow
- $8,566/yr
For passive investors: Depreciation is non-cash, so a rental often shows a tax loss while cash-flowing — sheltering income. Rental losses are passive: they offset passive income freely, and up to $25,000/yr can offset ordinary (W-2) income if you actively participate and your MAGI is under $100k (phasing out to $0 by $150k); unused losses carry forward. On sale, claimed depreciation is recaptured at up to 25%, and gains may owe capital-gains tax (a 1031 exchange can defer both). Figures are a year-1 estimate at your 24.0% rate — not tax advice; consult a CPA.
Condition & rehab AI · 1 photo
This well-maintained mobile home is ready for a fresh coat of paint and new windows to enhance its curb appeal and value.
Repairs flagged
- Minor Paint — Paint appears worn
- Minor Windows — Standard windows
Value-add opportunities
- Both Paint — Fresh paint enhances curb appeal and interior aesthetics
- Both Windows — New windows improve energy efficiency and curb appeal
Renovation cost estimate screening
| Repair item | Severity | Est. cost |
|---|---|---|
| Paint · Paint appears worn | Minor | $500–3,000 |
| Windows · Standard windows | Minor | $500–3,000 |
| Total estimated repair cost · 2 items | $1,000–6,000 |
Value-add ROI direction
- Both Paint — Fresh paint enhances curb appeal and interior aesthetics ↑
- Both Windows — New windows improve energy efficiency and curb appeal ↑
ⓘ Cost ranges are severity-bucket heuristics (US national rule-of-thumb). Get contractor quotes + a written scope before underwriting a rehab budget.
Schools (NCES district)
- District
- Avon Central School District
- NCES district ID
- 3603660
- Math proficiency
- 53% ▬ 0.00%
- Reading proficiency
- 50% ▲ 12.00%
- Median HH income
- $55,407
- Composite
- 44.56/100
- National rank
- #2786
- State rank
- #349 of 590 in NY
Livability — East Avon
- Score
- 60/100
- State rank
- #1004
- US rank
- #19541
Category grades
Schools grade is shown separately in the Schools card above.
Census & demographics
- County
- Livingston County · 6,576 people
- Metro
- Rochester, NY
- Population (ZIP)
- 6,576
- Household income
- $72,006
- Rent vs Own
- Severe rent burden
- 100.0
Population outlook (Livingston County) Hauer SSP2
- Today (2025)
- 63,466 people
- By 2030
- 61,966 · -2.4%
- By 2040
- 58,398 · -8.0%
- By 2050
- 54,955 · -13.4%
- By 2075
- 49,958 · -21.3%
- By 2100
- 43,944 · -30.8%
Race, ethnicity, and origin ACS 2023
- Neighborhood character
- Predominantly White (92%)
- Race & ethnicity
- White 92% Two or more races 4% Hispanic / Latino 2% Black 1%
- Common ancestry
- Romanian 6% Italian 4% Lithuanian 2%
- Foreign-born
- 2% · China, Canada
- Languages at home
- 98% English-only · Spanish 1%
Political lean MEDSL · Livingston
- 2024 margin
- Strong R (+21.4) · D 39.3% · R 60.7%
- 2008→2024 swing
- -13.6pp toward R · 2008: -7.9pp · 2024: -21.4pp
- All cycles
- 2024: R+21.4 2020: R+18.2 2016: R+27.8 2012: R+9.4 2008: R+7.9
Not yet ingested
- Civics
- —
Market trends
- HPI YoY
- ▼ -40.57%
- Current HPI
- 247.7027
- Rent YoY
- —
- Metro
- Rochester, NY
- State GDP YoY
- ▲ 2.60%
- F500 in state
- 92
Industry mix (Fortune 500 HQ in NY)
| Industry | F500 HQs | Revenue |
|---|---|---|
| Financial Services | 10 | $950B |
|
||
| Consumer Goods | 9 | $162B |
|
||
| Insurance | 4 | $225B |
|
||
| Telecommunications | 2 | $144B |
|
||
| Pharmaceuticals | 2 | $112B |
|
||
| Media / Entertainment | 2 | $69B |
|
||
Price history
1 event — show timeline
- 2026-06-12 Listed $49,900 UNYREIS
Cash-flow waterfall
monthlySold comps — $/sqft
last 12 mo · ≤1 miLoading sold comps…