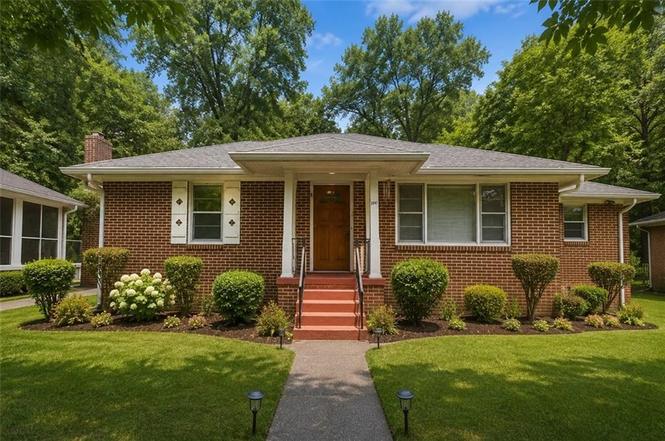
2647 Elsinore St · East Point, GA
Flood risk 1/10 · Minimal
- FEMA flood zone
- X (unshaded)
- Chance of flooding over 30 yrs
- 0.0%
- Est. flood insurance / yr
- $473 – $860
Fire risk 1/10 · Minimal
- Est. fire insurance / yr
- $963 – $1,789
Heat risk 5/10 · Moderate
- Hot days now (above 104°F)
- 7 days/yr
- Hot days in 30 yrs
- 18 days/yr
Wind risk 6/10 · Moderate
- Chance of severe wind over 30 yrs
- 27.0%
Air-quality risk 4/10 · Minor
- Unhealthy air days now
- 4 days/yr
- Unhealthy air days in 30 yrs
- 6 days/yr
Risk factors via First Street. Map © Google.
Why this score? — see what drove the D+ grade
The composite is a weighted blend of 9 inputs, each scored 0–100. Each bar is that input's sub-score; the figure is the points it added to the 100-point composite (weight × sub-score).
- Cash flow +13.4/30.0
- ARV discount +12.2/15.0
- Schools +4.5/10.0
- DSCR +4.0/10.0
- Livability +3.6/5.0
- 1% rule +3.4/10.0
- Rent growth +2.8/5.0
- Condition / age +2.5/5.0
- Appreciation +0.0/10.0
$225,000
🖨 Deal sheet (PDF) 📄 Offer letter ✓ Due diligence
Listing remarks
Opportunity awaits in East Point, Georgia with this 3-bedroom, 1.5-bath home situated on a generous 0.33-acre lot. Built in 1950, this property offers solid construction, great bones, and plenty of potential for homeowners, investors, or renovators looking to add value through cosmetic improvements. The functional floor plan provides comfortable living space, while the large lot offers room to expand, entertain, or create your ideal outdoor retreat. A standout feature is the detached garage, presenting exciting possibilities for a workshop, storage, or potential future ADU conversion, subject to local zoning and permitting requirements. With a roof approximately 15 years old and a strong st
Key facts
- Generous lot
- Conveniently located
- Detached garage
Tags
Property features AI
Exterior
- Parking: Detached garage; Driveway parking; On-street parking; One garage space; Open parking available
- Utilities: Public water; Public sewer; Electric service available; Electricity available; Water available
- Home design: One level; Block construction; Shingle roof; Resale property
- Construction: Block construction; Shingle roof; Slab foundation; Body type: Other (mobile-home category noted)
- Exterior features: Backyard fencing; City street and other road frontage; Asphalt road surface
Interior
- Kitchen: Electric range; Range hood; Microwave; Refrigerator
- Bedrooms: Three main-level bedrooms; No special bedroom features listed
- Flooring: Other flooring
- Bathrooms: One full bathroom; One half bathroom; One main-level full bathroom; One main-level half bathroom; Master bathroom has no special features listed
- Heating & cooling: Forced-air heating; Central air conditioning
- Interior features: One fireplace; Wood window frames; Other interior features; Crawl space basement
- Laundry & utility: Laundry room; Washer; Dryer
Neighborhood map
What this means for you Summary
Snapshot
- This is a 3-bed/1.5-bath single-family listed at $225k.
Deal economics
- At list price, monthly cash flow is $4 ($47/yr) — positive.
- The deal already cash-flows at list — no discount required.
- To meet the 1% rule (rent ≥ 1% of price), the offer needs to be $189k (16.1% below list).
- Recommended offer: $189k (16.1% below list) — sets the bar for 1% rule.
- Cap rate 6.3% vs local median 5.1% in East Point — meaningfully above typical; check what's discounted (condition, days-on-market, listing class) to confirm the premium yield is real.
Location & tenants
- Location reads 72/100 on livability (#72 in GA) — a middle-class / working-renter tenant base. Strengths: commute A+, cost of living A+, housing A+; Watch: employment D+, crime F, amenities F.
- Fulton County (suburban): math 49% / reading 53% proficiency, ranked #12 of 174 in GA (top 7%) — acceptable for families but not a draw, mixed tenant base, ~2y average lease.
- Zoned schools: Parklane Elementary School (math 24% / reading 24%, grade F, #753 of 1,228 statewide, top 64%, 320 students, 100% FRL); Paul D. West Middle School (math 17% / reading 17%, grade F, #381 of 470 statewide, top 82%, 803 students, 100% FRL); Tri-Cities High School (math 5% / reading 30%, grade F, #264 of 424 statewide, top 63%, 1,483 students, 100% FRL) — zoned schools average 100% FRL vs 41% district-wide (59 pts higher); higher-poverty schools than district average — tighter screening recommended.
- Zoned-school proficiency averages 20% at this address vs 51% district-wide (-31 pts) — the specific schools serving this property underperform the Fulton County average; the district grade overstates school quality for this exact location.
- Market conditions: Rents rising (+1.4%/yr); 283 active listings in the ZIP; 40 comparable units currently listed for rent nearby; rentals at typical pace (median 25d on market — plan ~3-4 weeks tenant-placement turnaround); 11,565 units permitted in Fulton County in 2024 (8,159 in 5+ unit buildings).
- This rent runs 33% of the median local income ($68k/yr) — at the standard rent-burdened threshold; future hikes will face affordability resistance.
Forward outlook
- Local home prices are declining (-3.0%/yr); year-one equity from $2k of loan paydown is wiped out by about $7k of value loss. Plan a longer hold.
- Fulton County population projected at +38% by 2050 — long-run rental-demand tailwind backs the buy-and-hold thesis.
Negotiation context
- Only 7 days on market — expect competitive offers; lowballing is unlikely to land.
- Current owner paid $59k; list at $225k implies a 281% gain — meaningful room to come down on a strong offer.
Risks & watch-outs
- Watch-outs: built in 1950 — expect roof / HVAC / electrical / plumbing capex.
- Climate carrying-cost: major wind risk, 27% chance of damaging wind over 30y; extreme-heat days projected 7→18/yr by 2055 (HVAC capex compounding) — expect insurance premiums to compound above CPI over the hold.
Questions for the listing agent
- Built in 1950 — when were the roof, HVAC, electrical panel, plumbing, and water heater last replaced?
- Is there a deadline driving the sale (1031 exchange, divorce, estate, relocation)? That informs how much negotiation room exists.
- Schools are F-rated, which usually means shorter tenancies and higher turnover. Who's the typical renter profile here, and what's been the actual vacancy rate?
- Crime grade is F in this area — have there been break-ins, vandalism, or insurance claims at this property in the last 3 years? What carrier currently insures it and at what premium?
- The area grade is low — what's the realistic commute time and amenity access for the typical tenant pool here? Any planned neighborhood developments (good or bad) we should know about?
- What's the average days-on-market for RENTAL listings here right now (not sales)? A rising rental-DOM trend means longer vacancies and softer asking-rent achievability than the comps imply.
- What's the recent tenant-quality profile in this submarket — average credit score on applications, eviction rate, late-payment / NSF rate, and stable-employment percentage? A property-management company in the area should have these aggregated.
- How much new for-sale + rental construction is in the pipeline within 1–3 miles? Heavy new supply typically softens prices + rents 12–24 months out; constrained supply supports both.
Investment metrics
- 1% rule
- 0.84% ✗
- Cap rate
- 6.31%
- Cash-on-cash
- 0.07%
- DSCR
- 1.00
- GRM
- 9.9
CMA / ARV
- ARV (on-the-fly)
- $251,514
- Comps found
- 12
Show comp detail 12 sales within ~0.75 mi
| Address | Dist | Beds/Ba | Sqft | Sold | Price | $/sf | Match |
|---|---|---|---|---|---|---|---|
| 1001 Winburn Dr | 0.16mi | 3/2.0 | 1,536 (-4%) | 14mo | $354,000 | $230 | 72 |
| 752 Jefferson Ave SW | 0.46mi | 4/2.0 (+1) | 1,552 (-3%) | 1mo | $205,000 | $132 | 66 |
| 2385 Perkerson Rd SW | 0.70mi | 3/2.0 | 1,624 (+1%) | 2mo | $267,900 | $165 | 61 |
| 2991 Sylvan Rd | 0.64mi | 3/1.0 | 1,663 (+4%) | 4mo | $69,000 | $41 | 59 |
| 2425 Hanford Dr SW | 0.47mi | 3/1.0 | 1,424 (-11%) | 2mo | $185,000 | $130 | 55 |
| 1269 Spencer Ave | 0.62mi | 2/2.0 (-1) | 1,567 (-2%) | 8mo | $375,000 | $239 | 54 |
| 2669 Jefferson Terrace Ter | 0.42mi | 2/1.0 (-1) | 1,456 (-9%) | 12mo | $275,000 | $189 | 49 |
| 733 Pegg Rd SW | 0.65mi | 3/2.0 | 1,429 (-11%) | 3mo | $280,000 | $196 | 47 |
| 2324 Springdale Cir SW | 0.66mi | 3/2.0 | 1,384 (-14%) | 8mo | $155,000 | $112 | 38 |
| 767 Vinson Pl | 0.66mi | 3/2.0 | 1,408 (-12%) | 12mo | $190,000 | $135 | 38 |
| 2431 W Woodland Cir | 0.63mi | 2/2.0 (-1) | 1,400 (-13%) | 10mo | $219,900 | $157 | 35 |
| 2346 Springdale Cir SW | 0.62mi | 4/2.0 (+1) | 1,384 (-14%) | 9mo | $160,000 | $116 | 34 |
Match score weights: distance 35% · size 25% · config 20% · recency 20%. Top-matched comps best support the ARV.
Projected returns pro-forma
-3.0% appreciation · 1.35% rent growth · sell at horizon
- IRR
- -18.0%
- Equity multiple
- 0.38×
- Total profit
- $-39,308
- Equity at exit
- $33,548
- IRR
- -13.6%
- Equity multiple
- 0.27×
- Total profit
- $-46,202
- Equity at exit
- $19,454
Cash invested: $63,000 (down + closing). Projections, not guarantees.
Landlord ↔ Tenant lean methodology
- Overall (STATE)
- 90 Strongly Landlord-Friendly
- State Georgia
- 90 Strongly Landlord-Friendly · R+3
- County
- — inherits STATE
- City
- — inherits STATE
ZIP-level market 30344
- Home prices YoY
- -31.0%
- Rents YoY
- 1.4%
- Active inventory
- 283
- Price-to-rent
- 9.9×
Monthly cashflow live
- Estimated rent
- $1,888 high interval (Pro) →
- Mortgage (P&I)
- −$1,180
- Tax from tax record
- −$214 /mo · $2,567/yr
- Insurance
- −$94
- HOA
- −$0
- Vacancy / Maint / Mgmt
- −$396
- Net cashflow
- $4
Break-even live
Sensitivity live
| Price | -10% $131 | -5% $68 | +0% $4 | +5% $-60 | +10% $-123 |
|---|---|---|---|---|---|
| Rent | -10% $-145 | -5% $-71 | +0% $4 | +5% $78 | +10% $153 |
| Rate | -1.0pp $117 | -0.5pp $61 | base $4 | +0.5pp $-54 | +1.0pp $-114 |
UW: 25.0% down · 7.5% · 30yr · 1.5% tax · 5.0% vac · 8.0% maint · 8.0% mgmt
Financing live
Cash to close
- Down payment
- $56,250
- Closing costs
- $6,750
- Reserves months
- —
- Total cash needed
- —
Loan-product check · same deal, 3 products live
Conventional
25% down · 7.5% · 30yr
- Down + closing
- —
- Monthly P&I
- —
- Monthly cashflow
- —
- DSCR
- —
- Eligible?
- —
Personal DTI + credit; lowest rate.
DSCR
20% down · 8.5% · 30yr
- Down + closing
- —
- Monthly P&I
- —
- Monthly cashflow
- —
- DSCR
- —
- Eligible?
- —
No personal income docs; deal must DSCR.
Hard money
10% down · 12.0% · 12mo
- Down + closing
- —
- Monthly P&I
- —
- Monthly cashflow
- —
- DSCR
- —
- Eligible?
- —
Short-term bridge; refi at stabilization.
Rent comps 40 comps
| Address | Beds | Baths | Sqft | Rent | $/sqft | DOM | Units | Dist |
|---|---|---|---|---|---|---|---|---|
| 2636 Acadia St Atlanta, GA | 3.0 | 2.0 | 1300 | $1,800 | $1.38 | 24d | 1 | 0.13mi |
| 2626 Blount St Atlanta, GA | 2.0 | 1.0 | 1314 | $1,460 | $1.11 | 24d | 1 | 0.17mi |
| 2533 Sylvan Rd Atlanta, GA | 3.0 | 2.0 | 1692 | $1,995 | $1.18 | 24d | 1 | 0.21mi |
| 2663 Blount St Atlanta, GA | 3.0 | 2.0 | 1168 | $1,650 | $1.41 | 17d | 1 | 0.22mi |
| 2748 Blount St Atlanta, GA | 3.0 | 1.0 | 1068 | $1,850 | $1.73 | 44d | 1 | 0.27mi |
| 2801 Palm Dr Atlanta, GA | 3.0 | 1.0 | 1064 | $1,550 | $1.46 | 13d | 1 | 0.30mi |
| 2456 Harwood Dr Atlanta, GA | 2.0 | 2.0 | 1176 | $1,995 | $1.70 | 44d | 1 | 0.37mi |
| 2874 Blount St Atlanta, GA | 3.0 | 1.0 | 1190 | $1,750 | $1.47 | 5d | 1 | 0.45mi |
| 2932 Palm Dr Atlanta, GA | 3.0 | 2.5 | 1589 | $3,200 | $2.01 | 5d | 1 | 0.55mi |
| 2710 Winburn Ter Atlanta, GA | 3.0 | 2.0 | 1500 | $1,800 | $1.20 | 44d | 1 | 0.56mi |
| 2952 Palm Dr Atlanta, GA | 3.0 | 2.0 | 1120 | $1,875 | $1.67 | 5d | 1 | 0.59mi |
| 1100 Washington Cir Atlanta, GA | 1.0–4.0 | 1.0–1.5 | 1000 | $1,617 | $1.62 | 3d | 1 | 0.71mi |
| 751 Yale Pl SW Atlanta, GA | 3.0 | 2.0 | 1230 | $1,499 | $1.22 | 24d | 1 | 0.71mi |
| 1344 Winburn Dr Atlanta, GA | 3.0 | 2.0 | 1388 | $2,100 | $1.51 | 24d | 1 | 0.74mi |
| 1354 Winburn Dr Atlanta, GA | 2.0 | 1.0 | 1089 | $1,750 | $1.61 | 24d | 1 | 0.76mi |
| 1366 Bryan Ave Unit A Atlanta, GA | 2.0 | 1.5 | 1181 | $1,600 | $1.35 | 44d | 1 | 0.81mi |
| 1369 Bryan Ave Atlanta, GA | 2.0 | 2.5 | 2000 | $3,250 | $1.62 | 44d | 1 | 0.83mi |
| 1377 Pine Ave Atlanta, GA | 3.0 | 2.0 | 1100 | $1,675 | $1.52 | 22d | 1 | 0.86mi |
| 1329 Washington Rd Atlanta, GA | 4.0 | 2.0 | 1600 | $2,250 | $1.41 | 44d | 1 | 0.86mi |
| 1244 Calhoun Ave Atlanta, GA | 3.0 | 1.5 | 1072 | $1,673 | $1.56 | 44d | 1 | 0.88mi |
| 1347 Washington Rd Unit A East Point, GA | 2.0 | 1.0 | 1250 | $1,049 | $0.84 | 44d | 1 | 0.89mi |
| 2894 Randall St Atlanta, GA | 4.0 | 2.0 | 1225 | $1,850 | $1.51 | 44d | 1 | 0.90mi |
| 486 Pegg Rd SW Atlanta, GA | 4.0 | 1.5 | 1750 | $2,000 | $1.14 | 24d | 1 | 0.94mi |
| 1455 Bryan Ave Unit B Atlanta, GA | 2.0 | 1.0 | 1482 | $1,300 | $0.88 | 24d | 1 | 1.00mi |
| 1493 Ashley Way Atlanta, GA | 3.0 | 2.5 | 1646 | $1,900 | $1.15 | 44d | 1 | 1.05mi |
| 643 Langston Dr SW Atlanta, GA | 3.0 | 2.0 | 1180 | $2,000 | $1.69 | 24d | 1 | 1.06mi |
| 1352 Elizabeth Ln Atlanta, GA | 3.0 | 2.0 | 1654 | $1,745 | $1.06 | 10d | 1 | 1.08mi |
| 2340 Newnan St Atlanta, GA | 4.0 | 2.0 | 1598 | $775 | $0.48 | 44d | 1 | 1.09mi |
| 3160 Lake Ave Unit NA Hapeville, GA | 4.0 | 1.5 | 1680 | $2,095 | $1.25 | 24d | 1 | 1.13mi |
| 735 Oak Dr Hapeville, GA | 2.0 | 1.0 | 1053 | $1,550 | $1.47 | 22d | 1 | 1.15mi |
| 2874 Grand Ave SW Atlanta, GA | 3.0 | 2.0 | 2166 | $3,999 | $1.85 | 24d | 1 | 1.16mi |
| 2783 Grand Ave SW Atlanta, GA | 4.0 | 2.0 | 1644 | $2,600 | $1.58 | 24d | 1 | 1.16mi |
| 3165 Dogwood Dr #108 Hapeville, GA | 4.0 | 3.5 | 2200 | $2,850 | $1.30 | 3d | 1 | 1.20mi |
| 3165 Dogwood Dr Hapeville, GA | 4.0 | 3.0 | 2187 | $2,999 | $1.37 | 24d | 1 | 1.20mi |
| 2627 N Church St East Point, GA | 2.0–3.0 | 1.0–2.0 | 1020 | $1,375 | $1.35 | 22d | 2 | 1.21mi |
| 2021 Brewer Blvd SW Atlanta, GA | 3.0 | 2.0 | 1178 | $1,795 | $1.52 | 8d | 1 | 1.22mi |
| 1060 Regent St SW Atlanta, GA | 3.0 | 2.0 | 1390 | $2,500 | $1.80 | 24d | 1 | 1.22mi |
| 1026 Astor Ave SW Atlanta, GA | 3.0 | 2.0 | 1116 | $2,500 | $2.24 | 24d | 1 | 1.27mi |
| 2036 McPherson Dr Atlanta, GA | 2.0 | 1.0 | 1743 | $1,590 | $0.91 | 5d | 1 | 1.28mi |
| 3166 Jackson St Atlanta, GA | 3.0 | 2.0 | 1650 | $1,595 | $0.97 | 24d | 1 | 1.30mi |
Listing history 6 events
-
2026-06-18days on market $225,000 Active 7 DOM
-
2026-06-17days on market $225,000 Active 6 DOM
-
2026-06-16days on market $225,000 Active 5 DOM
-
2026-06-15days on market $225,000 Active 4 DOM
-
2026-06-13remarks 699-char remark
-
2026-06-13$225,000 Active 2 DOM
ⓘ Source: listings_history table (triggers on properties + properties_extension) + one-shot
backfill from property_details.listing_events for pre-trigger history.
Tax reassessment forecast GA · Resets to sale price
- Current annual tax
- $2,567 · $214/mo
- Projected year-2 tax
- $2,567 · $214/mo
- Expected delta
- $0/yr ($0/mo · 0.0%)
ⓘ Screening estimate from a state-policy table — verify with the county assessor before closing.
Climate risk First Street
- Flood 1/10 Low FEMA zone X (unshaded) · 0% chance over 30 yrs
- Wildfire 1/10 Low
- Heat 5/10 Major 7 d/yr ≥104°F today · 18 d/yr by 30 yrs out
- Wind 6/10 Major 27% chance of damaging wind over 30 yrs
- Air quality 4/10 Moderate 4 unhealthy d/yr today · 6 by 30 yrs out
Nearby sold comps map
Loading sold comps map…
Walkable amenities ~0.75 mi
Loading nearby amenities…
Taxation est. · year 1
- Rental income
- $22,656
- − Mortgage interest
- −$12,603
- − Property taxes
- −$2,567
- − Insurance
- −$1,125
- − Repairs & maintenance
- −$1,812
- − Management
- −$1,812
- − Depreciation
- −$6,545
- Taxable loss
- −$3,810
- Est. tax savings @ 24.0%
- +$914
- After-tax cash flow
- $961/yr
For passive investors: Depreciation is non-cash, so a rental often shows a tax loss while cash-flowing — sheltering income. Rental losses are passive: they offset passive income freely, and up to $25,000/yr can offset ordinary (W-2) income if you actively participate and your MAGI is under $100k (phasing out to $0 by $150k); unused losses carry forward. On sale, claimed depreciation is recaptured at up to 25%, and gains may owe capital-gains tax (a 1031 exchange can defer both). Figures are a year-1 estimate at your 24.0% rate — not tax advice; consult a CPA.
Schools (NCES district)
- District
- Fulton County
- NCES district ID
- 1302280
- Math proficiency
- 49% ▼ -2.00%
- Reading proficiency
- 53% ▬ 0.00%
- Median HH income
- $68,035
- Composite
- 45.33/100
- National rank
- #2640
- State rank
- #12 of 174 in GA
Livability — East Point
- Score
- 72/100
- State rank
- #72
- US rank
- #6314
Category grades
Schools grade is shown separately in the Schools card above.
Census & demographics
- Census place
- East Point, GA
- County
- Fulton County · 1,094,430 people
- City population
- 35,456
- Metro
- Atlanta-Sandy Springs-Alpharetta, GA
- Population (ZIP)
- 35,456
- Household income
- $68,380
- Rent vs Own
- Severe rent burden
- 2226.0
Population outlook (Fulton County) Hauer SSP2
- Today (2025)
- 1,203,707 people
- By 2030
- 1,299,706 · +8.0%
- By 2040
- 1,488,256 · +23.6%
- By 2050
- 1,664,580 · +38.3%
- By 2075
- 2,036,072 · +69.2%
- By 2100
- 2,222,402 · +84.6%
Race, ethnicity, and origin ACS 2023
- Neighborhood character
- Predominantly Black (74%)
- Race & ethnicity
- Black 74% White 11% Hispanic / Latino 11% Two or more races 6%
- Hispanic origin (detail)
- Mexican 7% Puerto Rican 1%
- Common ancestry
- Italian 1% Swiss 1% Russian 1%
- Foreign-born
- 6% · Canada, Jamaica
- Languages at home
- 87% English-only · Spanish 9% Other Indo-European 1% German/W. Germanic 1%
Political lean MEDSL · Fulton
- 2024 margin
- Solid D (+44.9) · D 71.9% · R 27.0% · Other 1.1%
- 2008→2024 swing
- +9.8pp toward D · 2008: 35.0pp · 2024: 44.9pp
- All cycles
- 2024: D+44.9 2020: D+46.4 2016: D+42.1 2012: D+29.6 2008: D+35.0
Not yet ingested
- Civics
- —
Market trends
- HPI YoY
- ▼ -113.15%
- Current HPI
- 251.7916
- Rent YoY
- ▲ 1.35%
- Metro
- Atlanta-Sandy Springs-Alpharetta, GA
- State GDP YoY
- ▲ 2.66%
- F500 in state
- 28
Industry mix (Fortune 500 HQ in GA)
| Industry | F500 HQs | Revenue |
|---|---|---|
| Paper / Packaging | 2 | $29B |
|
||
| Retail | 1 | $160B |
|
||
| Transportation / Logistics | 1 | $91B |
|
||
| Airlines | 1 | $62B |
|
||
| Consumer Goods | 1 | $47B |
|
||
| Utilities | 1 | $25B |
|
||
Price history
+281.4% since first listed2 events — show timeline
- 2026-06-11 Listed $225,000 FMLS
- 1988-06-30 Sold (Public Records) $59,000 Public Records
Property tax history
+3.8%/yrLatest (2025): $2,567 · +1479.7% YoY. Source: county tax records.
Cash-flow waterfall
monthlySold comps — $/sqft
last 12 mo · ≤1 miLoading sold comps…