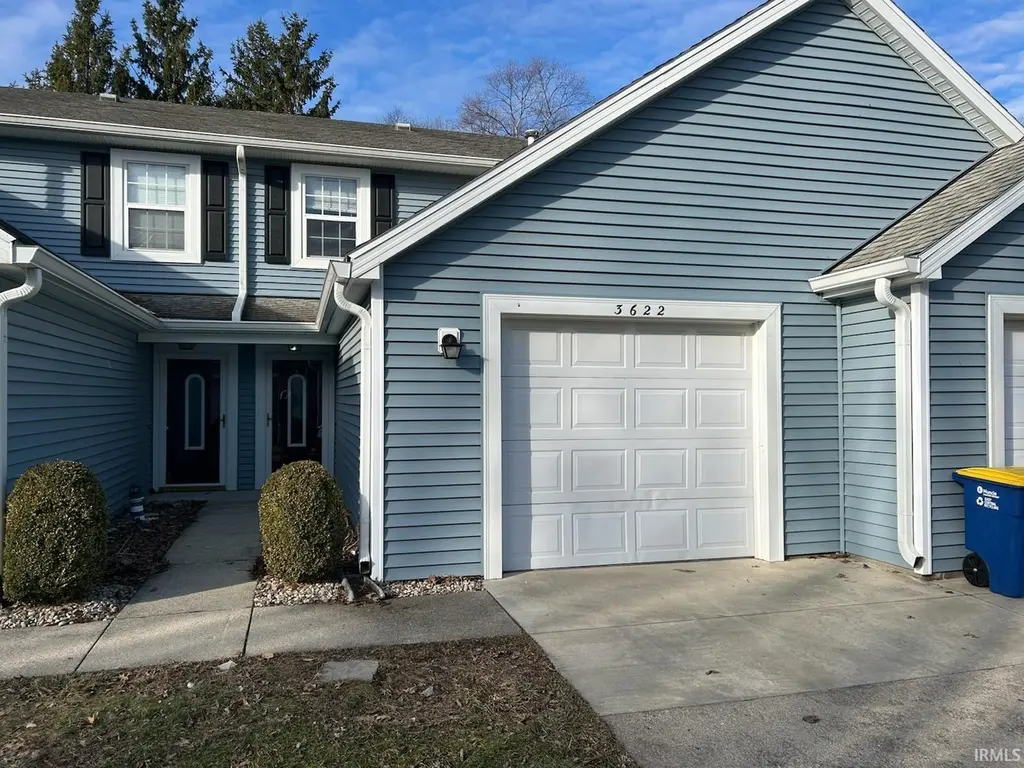
3622 N Lakeside Dr · Muncie, IN
Flood risk 1/10 · Minimal
- FEMA flood zone
- X (unshaded)
- Chance of flooding over 30 yrs
- 0.0%
- Est. flood insurance / yr
- $507 – $1,088
Fire risk 1/10 · Minimal
- Est. fire insurance / yr
- $717 – $1,331
Heat risk 3/10 · Minor
- Hot days now (above 100°F)
- 7 days/yr
- Hot days in 30 yrs
- 18 days/yr
Wind risk 2/10 · Minimal
- Chance of severe wind over 30 yrs
- 1.0%
Air-quality risk 3/10 · Minor
- Unhealthy air days now
- 2 days/yr
- Unhealthy air days in 30 yrs
- 3 days/yr
Risk factors via First Street. Map © Google.
Why this score? — see what drove the D grade
The composite is a weighted blend of 9 inputs, each scored 0–100. Each bar is that input's sub-score; the figure is the points it added to the 100-point composite (weight × sub-score).
- ARV discount +15.0/15.0
- Cash flow +7.5/30.0
- 1% rule +4.9/10.0
- Rent growth +4.5/5.0
- Livability +4.0/5.0
- Condition / age +2.5/5.0
- DSCR +1.7/10.0
- Schools +1.7/10.0
- Appreciation +0.0/10.0
$120,000
🖨 Deal sheet (PDF) 📄 Offer letter ✓ Due diligence
Listing remarks MLS
Low-maintenance living awaits at 3622 N. Lakeside Dr. in the quiet and comfortable Sandpiper Lake community! This 2-bedroom, 1 full bath, 2 half bath condo offers 1,296 sq. ft. of living space with an open floor plan, main-floor laundry, and attached one-car garage. HOA covers exterior maintenance, repairs, lawn care, and snow removal, allowing you to spend more time enjoying life. Conveniently located on Muncie's northwest side just minutes from shopping, dining, and Ball State University. A great opportunity for comfortable, carefree living!
Key facts
- $295 HOA
- Garage
- Built 1986
Property features AI
Finance
- Other: Condo description location: Other/See Remarks; Property ownership interest: Mandatory fee
- HOA & community: Homeowners association with monthly fee of $295; HOA covers lawn care, grounds maintenance, structure maintenance and general maintenance; HOA governed by covenants and restrictions; Mandatory fee / association
Exterior
- Parking: Attached garage with one garage space and garage door opener
- Utilities: Public water; Municipal sewer connection; No solid waste service listed
- Home design: Residential condominium; Attached property with 1 common wall; Vertical condo type; Multi/split levels; Low-maintenance lifestyle
- Construction: Vinyl siding; Slab foundation
- Exterior features: Patio; Property on a cul-de-sac
Interior
- Kitchen: Dishwasher; Microwave; Electric oven; Refrigerator; Gas water heater
- Bedrooms: Two bedrooms located on the upper level
- Flooring: Floor number: 1
- Bathrooms: One full bathroom (upper level); Two half bathrooms (one on main level, one upper)
- Heating & cooling: Forced air heating (natural gas); Central air conditioning
- Interior features: Attic access with pull-down stairs; Cathedral ceilings and high ceilings; One wood-burning fireplace in the living room; 6 rooms on main level, 2 rooms on upper level (6 total)
- Laundry & utility: Main level laundry
Neighborhood map
What this means for you Summary
Snapshot
- This is a 2-bed/2.0-bath condo listed at $120k.
Deal economics
- At list price, monthly cash flow is $-147 ($-2k/yr) — negative.
- To cash-flow at today's rent, offer at most $94k (21.7% below list).
- To meet the 1% rule (rent ≥ 1% of price), the offer needs to be $119k (1.0% below list).
- Recommended offer: $94k (21.7% below list) — sets the bar for cash-flow.
Location & tenants
- Location reads 80/100 on livability (#18 in IN, #1,654 nationally) — a professional / high-income tenant draw. Strengths: amenities A+, commute A+, cost of living A+; Watch: crime F, employment F.
- Muncie Community Schools (urban): math 18% / reading 25% proficiency, ranked #275 of 301 in IN (top 91%) — low school quality limits family demand, transient renter base, plan for 1-2y turnover; 68% free/reduced lunch — lower-income household profile, screen leases tightly.
- Zoned schools: North View Elementary School (math 27% / reading 27%, grade F, #737 of 994 statewide, top 76%, 371 students, 69% FRL); Northside Middle School (math 17% / reading 36%, grade F, #236 of 330 statewide, top 72%, 583 students, 70% FRL); Muncie Central High School (math 20% / reading 39%, 1,326 students, 70% FRL) — zoned schools at 70% FRL track the district average.
- Market conditions: Rents rising fast (+8.1%/yr); 203 active listings in the ZIP; 4 comparable units currently listed for rent nearby; rentals lingering (median 46d on market — plan ~5-8 weeks vacancy on turnover, expect pricing pressure); 100% of comp listings sitting > 30 days — soft ceiling on asking rent; 171 units permitted in Delaware County in 2024 (57 in 5+ unit buildings).
Forward outlook
- Local home prices are declining (-3.0%/yr); year-one equity from $830 of loan paydown is wiped out by about $4k of value loss. Plan a longer hold.
- Delaware County population projected at -11% by 2050 — secular population decline; favor cash flow + early exit over multi-decade hold.
Negotiation context
- Only 9 days on market — expect competitive offers; lowballing is unlikely to land.
- 8 sale attempts since 14y ago with the ask held roughly flat each time — persistent listings suggest the price (not the market) is what's stuck; bring a comps-based counter.
- Current owner paid $88k; 36% above their basis — modest negotiation headroom, anchor on the comps not their cost.
Risks & watch-outs
- Watch-outs: HOA is 25% of rent.
Questions for the listing agent
- What do current leases actually rent for vs. the listed asking? Can we see a recent rent roll and the last 12 months of T-12 income?
- What does the HOA fee cover, when was the last increase, and are there any pending special assessments or reserve-fund shortfalls?
- Any open or pending special assessments — roof, HVAC, plumbing, elevator, façade? What's the per-unit balance and payoff schedule, and is the seller paying it off at close or rolling it to the buyer?
- Is there a deadline driving the sale (1031 exchange, divorce, estate, relocation)? That informs how much negotiation room exists.
- Schools are D-rated, which usually means shorter tenancies and higher turnover. Who's the typical renter profile here, and what's been the actual vacancy rate?
- Crime grade is F in this area — have there been break-ins, vandalism, or insurance claims at this property in the last 3 years? What carrier currently insures it and at what premium?
- The area grade is low — what's the realistic commute time and amenity access for the typical tenant pool here? Any planned neighborhood developments (good or bad) we should know about?
- What's the average days-on-market for RENTAL listings here right now (not sales)? A rising rental-DOM trend means longer vacancies and softer asking-rent achievability than the comps imply.
- What's the recent tenant-quality profile in this submarket — average credit score on applications, eviction rate, late-payment / NSF rate, and stable-employment percentage? A property-management company in the area should have these aggregated.
- How much new apartment / multifamily construction is in the pipeline within 1–3 miles? Heavy new supply (>2% of stock underway) typically softens rents 12–24 months out; light construction supports rent growth.
Investment metrics
- 1% rule
- 0.99% ✗
- Cap rate
- 4.82%
- Cash-on-cash
- -5.27%
- DSCR
- 0.77
- GRM
- 8.4
CMA / ARV
- ARV (median comp)
- $198,917
- List price
- $120,000
- Delta
- -36.41%
- Verdict
- UNDERPRICED
- Comps
- 20 within 1.0 mi
Projected returns pro-forma
-3.0% appreciation · 8.0% rent growth · sell at horizon
- IRR
- -17.9%
- Equity multiple
- 0.33×
- Total profit
- $-22,379
- Equity at exit
- $17,892
- IRR
- -0.8%
- Equity multiple
- 0.93×
- Total profit
- $-2,281
- Equity at exit
- $10,375
Cash invested: $33,600 (down + closing). Projections, not guarantees.
Landlord ↔ Tenant lean methodology
- Overall (STATE)
- 90 Strongly Landlord-Friendly
- State Indiana
- 90 Strongly Landlord-Friendly · R+11
- County
- — inherits STATE
- City
- — inherits STATE
ZIP-level market 47304
- Home prices YoY
- -28.4%
- Rents YoY
- 8.1%
- Active inventory
- 203
- Price-to-rent
- 8.4×
Monthly cashflow live
- Estimated rent
- $1,188 medium interval (Pro) →
- Mortgage (P&I)
- −$629
- Tax from tax record
- −$112 /mo · $1,343/yr
- Insurance
- −$50
- HOA
- −$295
- Lot rent
- −$0
- Vacancy / Maint / Mgmt
- −$250
- Net cashflow
- $-147
Break-even live
Sensitivity live
| Price | -10% $-79 | -5% $-113 | +0% $-147 | +5% $-181 | +10% $-215 |
|---|---|---|---|---|---|
| Rent | -10% $-241 | -5% $-194 | +0% $-147 | +5% $-100 | +10% $-54 |
| Rate | -1.0pp $-87 | -0.5pp $-117 | base $-147 | +0.5pp $-179 | +1.0pp $-210 |
UW: 25.0% down · 7.5% · 30yr · 1.5% tax · 5.0% vac · 8.0% maint · 8.0% mgmt
Financing live
Cash to close
- Down payment
- $30,000
- Closing costs
- $3,600
- Reserves months
- —
- Total cash needed
- —
Loan-product check · same deal, 3 products live
Conventional
25% down · 7.5% · 30yr
- Down + closing
- —
- Monthly P&I
- —
- Monthly cashflow
- —
- DSCR
- —
- Eligible?
- —
Personal DTI + credit; lowest rate.
DSCR
20% down · 8.5% · 30yr
- Down + closing
- —
- Monthly P&I
- —
- Monthly cashflow
- —
- DSCR
- —
- Eligible?
- —
No personal income docs; deal must DSCR.
Hard money
10% down · 12.0% · 12mo
- Down + closing
- —
- Monthly P&I
- —
- Monthly cashflow
- —
- DSCR
- —
- Eligible?
- —
Short-term bridge; refi at stabilization.
Rent comps 4 comps
| Address | Beds | Baths | Sqft | Rent | $/sqft | DOM | Units | Dist |
|---|---|---|---|---|---|---|---|---|
| 3601 N Chadam Ln Muncie, IN | 1.0–2.0 | 1.0–2.0 | 822 | $2,600 | $3.16 | 46d | 33 | 0.04mi |
| 4500 W Bethel Ave Muncie, IN | 2.0–4.0 | 2.0–4.0 | 1207 | $449 | $0.37 | 46d | 26 | 0.34mi |
| 3000 W Cypress Dr Unit 3008 Muncie, IN | 2.0 | 1.0 | 1200 | $1,000 | $0.83 | 46d | 1 | 1.21mi |
| 1810 W Northfield Dr Muncie, IN | 2.0 | 1.5 | 1418 | $1,300 | $0.92 | 46d | 1 | 1.24mi |
HOA detail condo
- Monthly dues
- $295 · $3,540/yr
- Likely covers
- landscapingsnow removalexterior maint.
- Assessments
- None detected in remarks — confirm with the listing agent.
Listing history 22 events
-
2026-06-22days on market $120,000 Active 9 DOM
-
2026-06-19days on market $120,000 Active 7 DOM
-
2026-06-18days on market $120,000 Active 6 DOM
-
2026-06-17days on market $120,000 Active 5 DOM
-
2026-06-16days on market $120,000 Active 4 DOM
-
2026-06-15days on market $120,000 Active 3 DOM
-
2026-06-13pricedays on market $120,000 Active 1 DOM
-
2026-05-31days on market $126,500 Active 114 DOM
-
2026-05-30days on market $126,500 Active 113 DOM
-
2026-04-29price $126,500 900-char remark
-
2026-03-04price $129,000 900-char remark
-
2026-02-06$132,500 Active 900-char remark
-
2019-12-02soldstatus $88,000 330-char remark
-
2019-12-02soldstatus $88,000
-
2019-10-10$90,000
-
2019-10-10$90,000 330-char remark
-
2018-08-08soldstatus $78,500
-
2018-04-13$84,900
-
2017-02-28soldstatus $73,500
-
2016-12-29$76,900
-
2012-07-15historical
-
2012-01-24$79,900
ⓘ Source: listings_history table (triggers on properties + properties_extension) + one-shot
backfill from property_details.listing_events for pre-trigger history.
Tax reassessment forecast IN · Partial reset (capped growth)
- Current annual tax
- $1,343 · $112/mo
- Projected year-2 tax
- $1,343 · $112/mo
- Expected delta
- $0/yr ($0/mo · 0.0%)
ⓘ Screening estimate from a state-policy table — verify with the county assessor before closing.
Climate risk First Street
- Flood 1/10 Low FEMA zone X (unshaded) · 0% chance over 30 yrs
- Wildfire 1/10 Low
- Heat 3/10 Moderate 7 d/yr ≥100°F today · 18 d/yr by 30 yrs out
- Wind 2/10 Low 100% chance of damaging wind over 30 yrs
- Air quality 3/10 Moderate 2 unhealthy d/yr today · 3 by 30 yrs out
Nearby sold comps map
Loading sold comps map…
Walkable amenities ~0.75 mi
Loading nearby amenities…
Taxation est. · year 1
- Rental income
- $14,260
- − Mortgage interest
- −$6,722
- − Property taxes
- −$1,343
- − Insurance
- −$600
- − Repairs & maintenance
- −$1,141
- − Management
- −$1,141
- − HOA
- −$3,540
- − Depreciation
- −$3,491
- Taxable loss
- −$3,717
- Est. tax savings @ 24.0%
- +$892
- After-tax cash flow
- $-877/yr
For passive investors: Depreciation is non-cash, so a rental often shows a tax loss while cash-flowing — sheltering income. Rental losses are passive: they offset passive income freely, and up to $25,000/yr can offset ordinary (W-2) income if you actively participate and your MAGI is under $100k (phasing out to $0 by $150k); unused losses carry forward. On sale, claimed depreciation is recaptured at up to 25%, and gains may owe capital-gains tax (a 1031 exchange can defer both). Figures are a year-1 estimate at your 24.0% rate — not tax advice; consult a CPA.
Schools (NCES district)
- District
- Muncie Community Schools
- NCES district ID
- 1807320
- Math proficiency
- 18% ▼ -9.00%
- Reading proficiency
- 25% ▼ -4.00%
- Median HH income
- $30,052
- Composite
- 17.22/100
- National rank
- #9099
- State rank
- #275 of 301 in IN
Livability — Muncie
- Score
- 80/100
- State rank
- #18
- US rank
- #1654
Category grades
Schools grade is shown separately in the Schools card above.
Census & demographics
- Census place
- Muncie, IN
- County
- Delaware County · 84,658 people
- City population
- 84,658
- Metro
- Muncie, IN
- Population (ZIP)
- 31,237
- Household income
- $63,215
- Rent vs Own
- Severe rent burden
- 1141.0
Population outlook (Delaware County) Hauer SSP2
- Today (2025)
- 113,036 people
- By 2030
- 111,313 · -1.5%
- By 2040
- 106,432 · -5.8%
- By 2050
- 100,747 · -10.9%
- By 2075
- 91,000 · -19.5%
- By 2100
- 80,687 · -28.6%
Race, ethnicity, and origin ACS 2023
- Neighborhood character
- Predominantly White (85%)
- Race & ethnicity
- White 85% Two or more races 5% Black 4% Asian 4% Hispanic / Latino 3%
- Common ancestry
- Lithuanian 2% Romanian 2% Slovak 1%
- Foreign-born
- 5% · Canada, Vietnam, China
- Languages at home
- 94% English-only · Spanish 2% Other Indo-European 1% Vietnamese 1%
Political lean MEDSL · Delaware
- 2024 margin
- R (+15.8) · D 41.2% · R 57.0% · Other 1.8%
- 2008→2024 swing
- -30.8pp toward R · 2008: 15.0pp · 2024: -15.8pp
- All cycles
- 2024: R+15.8 2020: R+13.2 2016: R+13.7 2012: D+3.1 2008: D+15.0
Not yet ingested
- Civics
- —
Market trends
- HPI YoY
- ▼ -78.53%
- Current HPI
- 197.5213
- Rent YoY
- ▲ 8.08%
- Metro
- Muncie, IN
- State GDP YoY
- ▲ 2.90%
- F500 in state
- 18
Industry mix (Fortune 500 HQ in IN)
| Industry | F500 HQs | Revenue |
|---|---|---|
| Industrial Machinery | 2 | $37B |
|
||
| Healthcare | 1 | $177B |
|
||
| Pharmaceuticals | 1 | $45B |
|
||
| Metals / Steel | 1 | $18B |
|
||
| Agriculture | 1 | $17B |
|
||
| Packaging | 1 | $12B |
|
||
Price history
+50.2% since first listed15 events — show timeline
- 2026-06-11 Listed $120,000 IRMLS
- 2026-06-11 Listed $120,000 MIBOR as Distributed by MLS Grid
- 2026-04-29 Price Changed $126,500 IRMLS
- 2026-03-04 Price Changed $129,000 IRMLS
- 2026-02-06 Listed $132,500 IRMLS
- 2019-12-02 Sold (MLS) $88,000 IRMLS
- 2019-12-02 Sold (MLS) $88,000 MIBOR as Distributed by MLS Grid
- 2019-10-10 Listed $90,000 MIBOR as Distributed by MLS Grid
- 2019-10-10 Listed $90,000 IRMLS
- 2018-08-08 Sold (MLS) $78,500 IRMLS
- 2018-04-13 Listed $84,900 IRMLS
- 2017-02-28 Sold (MLS) $73,500 IRMLS
- 2016-12-29 Listed $76,900 IRMLS
- 2012-07-15 Listing Removed — MIBOR as Distributed by MLS Grid
- 2012-01-24 Listed $79,900 MIBOR as Distributed by MLS Grid
Property tax history
-9.2%/yrLatest (2024): $1,343 · +11.6% YoY. Source: county tax records.
Cash-flow waterfall
monthlySold comps — $/sqft
last 12 mo · ≤1 miLoading sold comps…