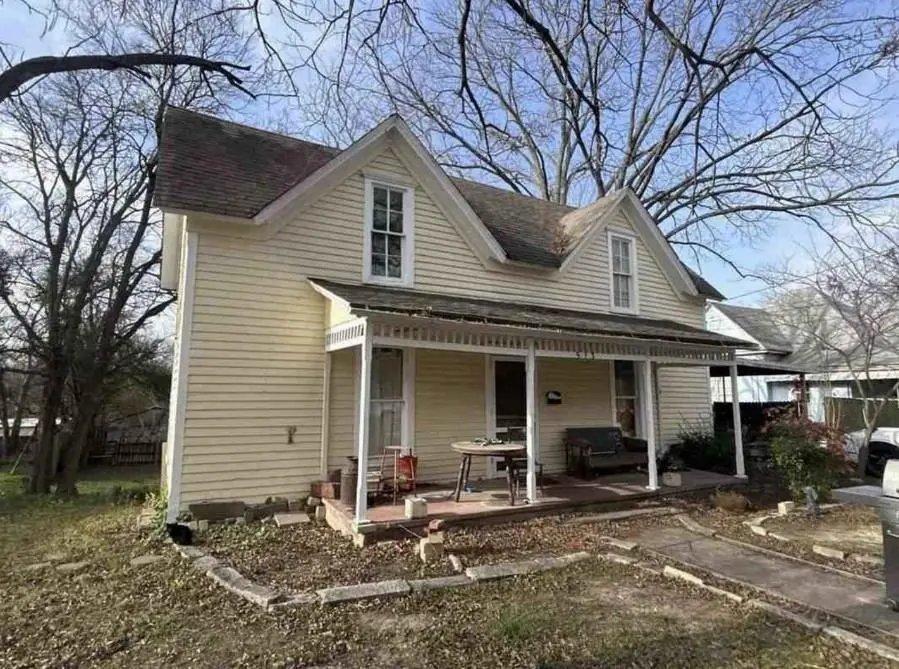
513 W Jefferson St · Waxahachie, TX
Flood risk 1/10 · Minimal
- FEMA flood zone
- X (unshaded)
- Chance of flooding over 30 yrs
- 0.0%
- Est. flood insurance / yr
- $507 – $1,088
Fire risk 4/10 · Minor
- Est. fire insurance / yr
- $1,222 – $2,270
Heat risk 7/10 · Major
- Hot days now (above 110°F)
- 7 days/yr
- Hot days in 30 yrs
- 24 days/yr
Wind risk 6/10 · Moderate
- Chance of severe wind over 30 yrs
- 27.0%
Air-quality risk 2/10 · Minimal
- Unhealthy air days now
- 1 days/yr
- Unhealthy air days in 30 yrs
- 2 days/yr
Risk factors via First Street. Map © Google.
Why this score? — see what drove the C grade
The composite is a weighted blend of 9 inputs, each scored 0–100. Each bar is that input's sub-score; the figure is the points it added to the 100-point composite (weight × sub-score).
- Cash flow +18.5/30.0
- ARV discount +15.0/15.0
- DSCR +5.8/10.0
- 1% rule +5.7/10.0
- Schools +3.9/10.0
- Livability +3.9/5.0
- Rent growth +3.4/5.0
- Condition / age +2.5/5.0
- Appreciation +0.0/10.0
$199,900
🖨 Deal sheet 📄 Offer letter ✓ Due diligence
Listing remarks
INVESTOR SPECIAL in the heart of Waxahachie, listed $15k UNDER APPRAISED VALUE!! The home is back on the market at no fault of the seller after the buyer exercised their contingency due to their current home not selling. Don’t miss this opportunity to snag up a piece of historic charm just minutes from downtown dining, shopping, and entertainment. This 1910 Craftsman-style home offers approximately 1,891 sq ft, 3 bedrooms, 1 bathroom, and sits on a spacious lot complete with 3 additional outbuildings (2 sheds and 1 barn), providing incredible value-add potential. Located just one street over from some of Waxahachie’s most beautiful historic homes, this property is full of opport
Key facts
- Downtown waxahachie
- 9,235 sq ft lot
- 2 parking spots
Tags
Property features AI
Finance
- Other: Possession: Negotiable; Listing status: Active; Special listing conditions: Standard
- Financial info: Listing terms: Cash or Conventional
- HOA & community: No association
Exterior
- Parking: Attached carport; 2 covered parking spaces; 2 carport spaces
- Utilities: City water; City sewer; Not in a municipal utility district
- Home design: Single family residence; Residential property; Built in 1910; Not attached
- Construction: Year built: 1910
- Exterior features: Lot under 0.5 acre; Lot approx. 0.212 acres; Subdivision: Town
Interior
- Kitchen: Gas range
- Bedrooms: 3 bedrooms (primary bedroom on main level)
- Bathrooms: 1 full bathroom
- Heating & cooling: Central heating; Central air conditioning
- Interior features: High speed internet available; Two levels; Two living areas; One dining area; Total rooms: 2
- Laundry & utility: No specific laundry details provided
Neighborhood map
What this means for you Summary
Snapshot
- This is a 3-bed/1.0-bath single-family listed at $200k.
Deal economics
- At list price, monthly cash flow is $190 ($2k/yr) — positive.
- The deal already cash-flows at list — no discount required.
- Meets the 1% rule at list price ($2k rent vs $200k).
- Recommended offer: $194k (3.0% below list) — sets the bar for market timing.
- Cap rate 7.4% vs local median 3.3% in Waxahachie — top-decile yield for the area; either an underpriced asset or a hidden risk that comps aren't pricing in. Stress-test before assuming the spread holds.
Location & tenants
- Location reads 78/100 on livability (#71 in TX, #2,592 nationally) — a middle-class / working-renter tenant base. Strengths: cost of living A+, housing A+, employment A-; Watch: commute F.
- Waxahachie ISD (suburban): math 45% / reading 44% proficiency, ranked #253 of 826 in TX (top 31%) — families likely to look elsewhere, expect single-tenant / working-renter base with shorter leases.
- Zoned schools: Marvin Biomedical Academy (math 27% / reading 32%, grade F, #2,525 of 4,322 statewide, top 62%, 456 students, 75% FRL) — zoned schools average 75% FRL vs 48% district-wide (28 pts higher); higher-poverty schools than district average — tighter screening recommended.
- Zoned-school proficiency averages 30% at this address vs 44% district-wide (-15 pts) — the specific schools serving this property underperform the Waxahachie ISD average; the district grade overstates school quality for this exact location.
- Market conditions: Rents rising (+3.4%/yr); 854 active listings in the ZIP; 14 comparable units currently listed for rent nearby; rentals at typical pace (median 19d on market — plan ~3-4 weeks tenant-placement turnaround); solid renter incomes; 3,016 units permitted in Ellis County in 2024 (20 in 5+ unit buildings).
Forward outlook
- Local home prices are declining (-3.0%/yr); year-one equity from $1k of loan paydown is wiped out by about $6k of value loss. Plan a longer hold.
- Ellis County population projected at +36% by 2050 — long-run rental-demand tailwind backs the buy-and-hold thesis.
Negotiation context
- It's been on market 49 days — a 3% lower offer ($194k) is reasonable based on typical stale-listing flexibility.
- 2 sale attempts; this cycle's ask has dropped $15k (7%) from the opening price — seller is motivated, your offer sets the floor, not the list.
- Current owner paid $45k; list at $200k implies a 344% gain — meaningful room to come down on a strong offer.
Risks & watch-outs
- Watch-outs: built in 1910 — expect roof / HVAC / electrical / plumbing capex.
- Climate carrying-cost: major wind risk, 27% chance of damaging wind over 30y; extreme-heat days projected 7→24/yr by 2055 (HVAC capex compounding) — expect insurance premiums to compound above CPI over the hold.
Questions for the listing agent
- It's been on market 49 days. Have you received any prior offers? Is the seller open to a 3% concession, seller financing, or rate buy-down credit?
- Built in 1910 — when were the roof, HVAC, electrical panel, plumbing, and water heater last replaced?
- Is there a deadline driving the sale (1031 exchange, divorce, estate, relocation)? That informs how much negotiation room exists.
- Schools are B-rated — typically a magnet for longer-tenancy family renters. What's the average tenant stay here, and is there a school-zone premium baked into asking?
- What's the average days-on-market for RENTAL listings here right now (not sales)? A rising rental-DOM trend means longer vacancies and softer asking-rent achievability than the comps imply.
- What's the recent tenant-quality profile in this submarket — average credit score on applications, eviction rate, late-payment / NSF rate, and stable-employment percentage? A property-management company in the area should have these aggregated.
- How much new for-sale + rental construction is in the pipeline within 1–3 miles? Heavy new supply typically softens prices + rents 12–24 months out; constrained supply supports both.
Investment metrics
- 1% rule
- 1.07% ✓
- Cap rate
- 7.43%
- Cash-on-cash
- 4.07%
- DSCR
- 1.18
- GRM
- 7.8
CMA / ARV
- ARV (median comp)
- $337,594
- List price
- $199,900
- Delta
- -40.79%
- Verdict
- UNDERPRICED
- Comps
- 20 within 1.0 mi
Show comp detail 12 sales within ~0.75 mi
| Address | Dist | Beds/Ba | Sqft | Sold | Price | $/sf | Match |
|---|---|---|---|---|---|---|---|
| 520 Blackwater Trl | 0.17mi | 3/2.0 | 2,002 (+8%) | 8mo | $349,990 | $175 | 68 |
| 407 W Light St | 0.46mi | 4/2.0 (+1) | 1,773 (-4%) | 8mo | $365,000 | $206 | 56 |
| 505 Grace St | 0.39mi | 3/2.5 | 1,679 (-9%) | 6mo | $409,000 | $244 | 56 |
| 113 Williams St | 0.65mi | 3/1.5 | 1,987 (+8%) | 1mo | $255,000 | $128 | 54 |
| 514 N Rogers St | 0.48mi | 3/2.0 | 2,050 (+11%) | 5mo | $394,500 | $192 | 51 |
| 513 Dillon St | 0.41mi | 3/2.0 | 1,649 (-11%) | 10mo | $300,000 | $182 | 51 |
| 604 Dr Martin Luther King Jr Blvd | 0.72mi | 4/2.0 (+1) | 1,852 (+0%) | 12mo | $319,900 | $173 | 47 |
| 606 Dr Martin Luther King Jr Blvd | 0.73mi | 4/2.0 (+1) | 1,852 (+0%) | 13mo | $319,900 | $173 | 46 |
| 207 Brown St | 0.74mi | 3/2.0 | 1,800 (-3%) | 16mo | $350,000 | $194 | 44 |
| 300 Haley Dr | 0.41mi | 3/2.5 | 1,633 (-12%) | 14mo | $365,000 | $224 | 44 |
| 209 Williams St | 0.71mi | 3/3.0 | 1,614 (-13%) | 1mo | $375,000 | $232 | 36 |
| 700 Ellis St | 0.63mi | 4/2.0 (+1) | 1,608 (-13%) | 7mo | $235,000 | $146 | 34 |
Match score weights: distance 35% · size 25% · config 20% · recency 20%. Top-matched comps best support the ARV.
Projected returns pro-forma
-3.0% appreciation · 3.4% rent growth · sell at horizon
- IRR
- -9.4%
- Equity multiple
- 0.65×
- Total profit
- $-19,352
- Equity at exit
- $29,806
- IRR
- 0.7%
- Equity multiple
- 1.05×
- Total profit
- $2,670
- Equity at exit
- $17,284
Cash invested: $55,972 (down + closing). Projections, not guarantees.
Landlord ↔ Tenant lean methodology
- Overall (STATE)
- 87 Strongly Landlord-Friendly
- State Texas
- 87 Strongly Landlord-Friendly · R+5
- County
- — inherits STATE
- City
- — inherits STATE
ZIP-level market 75165
- Home prices YoY
- -24.5%
- Rents YoY
- 3.4%
- Active inventory
- 854
- Price-to-rent
- 7.8×
Monthly cashflow live
- Estimated rent
- $2,129 high interval (Pro) →
- Mortgage (P&I)
- −$1,048
- Tax from tax record
- −$361 /mo · $4,330/yr
- Insurance
- −$83
- HOA
- −$0
- Vacancy / Maint / Mgmt
- −$447
- Net cashflow
- $190
Break-even live
UW: 25.0% down · 7.5% · 30yr · 1.5% tax · 5.0% vac · 8.0% maint · 8.0% mgmt
Financing live
Cash to close
- Down payment
- $49,975
- Closing costs
- $5,997
- Reserves months
- —
- Total cash needed
- —
Loan-product check · same deal, 3 products live
Conventional
25% down · 7.5% · 30yr
- Down + closing
- —
- Monthly P&I
- —
- Monthly cashflow
- —
- DSCR
- —
- Eligible?
- —
Personal DTI + credit; lowest rate.
DSCR
20% down · 8.5% · 30yr
- Down + closing
- —
- Monthly P&I
- —
- Monthly cashflow
- —
- DSCR
- —
- Eligible?
- —
No personal income docs; deal must DSCR.
Hard money
10% down · 12.0% · 12mo
- Down + closing
- —
- Monthly P&I
- —
- Monthly cashflow
- —
- DSCR
- —
- Eligible?
- —
Short-term bridge; refi at stabilization.
Rent comps 14 comps
| Address | Beds | Baths | Sqft | Rent | $/sqft | DOM | Units | Dist |
|---|---|---|---|---|---|---|---|---|
| 420 W Franklin St Unit 3 Waxahachie, TX | 2.0 | 1.0 | 1440 | $1,625 | $1.13 | 43d | 1 | 0.07mi |
| 224 Patrick St Waxahachie, TX | 3.0 | 2.0 | 1766 | $2,250 | $1.27 | 7d | 1 | 0.56mi |
| 510 Woodside Trl Waxahachie, TX | 3.0 | 2.0 | 1472 | $2,650 | $1.80 | 1d | 1 | 0.62mi |
| 115 Church St Waxahachie, TX | 4.0 | 3.5 | 1914 | $2,800 | $1.46 | 7d | 1 | 0.96mi |
| 113 Church St Waxahachie, TX | 4.0 | 3.5 | 1892 | $2,800 | $1.48 | 1d | 1 | 0.96mi |
| 112 Savannah St Waxahachie, TX | 3.0 | 2.0 | 1359 | $1,950 | $1.43 | 18d | 1 | 1.11mi |
| 807 Wyatt St Waxahachie, TX | 4.0 | 3.0 | 2592 | $1,900 | $0.73 | 43d | 1 | 1.16mi |
| 101 Wilmington Ave Waxahachie, TX | 3.0 | 2.0 | 1624 | $2,124 | $1.31 | 20d | 1 | 1.25mi |
| 207 Kirksey St Waxahachie, TX | 3.0 | 1.0 | 1436 | $1,795 | $1.25 | 20d | 1 | 1.30mi |
| 208 Lewis St Waxahachie, TX | 3.0 | 2.0 | 1236 | $2,100 | $1.70 | 43d | 1 | 1.32mi |
| 113 Monticello Dr Waxahachie, TX | 3.0 | 2.0 | 1404 | $1,995 | $1.42 | 22d | 1 | 1.36mi |
| 113 Monticello Dr Waxahachie, TX | 3.0 | 2.0 | 1404 | $1,995 | $1.42 | 13d | 1 | 1.36mi |
| 710 Perry Ave Unit 1324866P Waxahachie, TX | 3.0 | 2.5 | 1894 | $4,304 | $2.27 | 7d | 1 | 1.39mi |
| 1334 Wyatt St Waxahachie, TX | 3.0 | 2.0 | 1650 | $2,200 | $1.33 | 7d | 1 | 1.50mi |
Listing history 21 events
-
2026-06-18days on market $199,900 Active 49 DOM
-
2026-06-17days on market $199,900 Active 48 DOM
-
2026-06-16days on market $199,900 Active 47 DOM
-
2026-06-15days on market $199,900 Active 46 DOM
-
2026-06-13days on market $199,900 Active 44 DOM
-
2026-06-13days on market $199,900 Active 43 DOM
-
2026-06-09days on market $199,900 Active 40 DOM
-
2026-06-08days on market $199,900 Active 39 DOM
-
2026-06-07days on market $199,900 Active 38 DOM
-
2026-06-04days on market $199,900 Active 35 DOM
-
2026-06-03days on market $199,900 Active 34 DOM
-
2026-06-02days on market $199,900 Active 33 DOM
-
2026-06-01days on market $199,900 Active 32 DOM
-
2026-05-31days on market $199,900 Active 31 DOM
-
2026-05-18historical Active Option Contract 998-char remark
-
2026-04-30$215,000 Active 998-char remark
-
2025-08-27soldstatus
-
2018-08-24soldstatus
-
2014-12-23soldstatus
-
1995-04-04soldstatus $45,000
-
1989-07-21soldstatus $41,900
ⓘ Source: listings_history table (triggers on properties + properties_extension) + one-shot
backfill from property_details.listing_events for pre-trigger history.
Tax reassessment forecast TX · Resets to sale price
- Current annual tax
- $4,330 · $361/mo
- Projected year-2 tax
- $4,330 · $361/mo
- Expected delta
- $0/yr ($0/mo · 0.0%)
ⓘ Screening estimate from a state-policy table — verify with the county assessor before closing.
Climate risk First Street
- Flood 1/10 Low FEMA zone X (unshaded) · 0% chance over 30 yrs
- Wildfire 4/10 Moderate
- Heat 7/10 Severe 7 d/yr ≥110°F today · 24 d/yr by 30 yrs out
- Wind 6/10 Major 27% chance of damaging wind over 30 yrs
- Air quality 2/10 Low 1 unhealthy d/yr today · 2 by 30 yrs out
Nearby sold comps map
Loading sold comps map…
Walkable amenities ~0.75 mi
Loading nearby amenities…
Taxation est. · year 1
- Rental income
- $25,551
- − Mortgage interest
- −$11,198
- − Property taxes
- −$4,330
- − Insurance
- −$1,000
- − Repairs & maintenance
- −$2,044
- − Management
- −$2,044
- − Depreciation
- −$5,815
- Taxable loss
- −$880
- Est. tax savings @ 24.0%
- +$211
- After-tax cash flow
- $2,487/yr
For passive investors: Depreciation is non-cash, so a rental often shows a tax loss while cash-flowing — sheltering income. Rental losses are passive: they offset passive income freely, and up to $25,000/yr can offset ordinary (W-2) income if you actively participate and your MAGI is under $100k (phasing out to $0 by $150k); unused losses carry forward. On sale, claimed depreciation is recaptured at up to 25%, and gains may owe capital-gains tax (a 1031 exchange can defer both). Figures are a year-1 estimate at your 24.0% rate — not tax advice; consult a CPA.
Schools (NCES district)
- District
- Waxahachie ISD
- NCES district ID
- 4844730
- Math proficiency
- 45% ▼ -7.00%
- Reading proficiency
- 44% ▼ -6.00%
- Median HH income
- $59,434
- Composite
- 39.14/100
- National rank
- #4034
- State rank
- #253 of 826 in TX
Livability — Waxahachie
- Score
- 78/100
- State rank
- #71
- US rank
- #2592
Category grades
Schools grade is shown separately in the Schools card above.
Census & demographics
- Census place
- Waxahachie, TX
- County
- Ellis County · 199,237 people
- City population
- 67,417
- Metro
- Dallas-Fort Worth-Arlington, TX
- Population (ZIP)
- 53,513
- Household income
- $86,391
- Rent vs Own
- Severe rent burden
- 1365.0
Population outlook (Ellis County) Hauer SSP2
- Today (2025)
- 194,556 people
- By 2030
- 209,679 · +7.8%
- By 2040
- 238,837 · +22.8%
- By 2050
- 265,451 · +36.4%
- By 2075
- 326,571 · +67.9%
- By 2100
- 362,156 · +86.1%
Race, ethnicity, and origin ACS 2023
- Neighborhood character
- Diverse neighborhood (Simpson 0.60)
- Race & ethnicity
- White 56% Hispanic / Latino 26% Black 14% Two or more races 13%
- Hispanic origin (detail)
- Mexican 22%
- Common ancestry
- Slovak 2% Lithuanian 2% Italian 2%
- Foreign-born
- 7% · Canada
- Languages at home
- 84% English-only · Spanish 15%
Political lean MEDSL · Ellis
- 2024 margin
- Solid R (+31.1) · D 34.0% · R 65.1%
- 2008→2024 swing
- +11.2pp toward D · 2008: -42.2pp · 2024: -31.1pp
- All cycles
- 2024: R+31.1 2020: R+34.1 2016: R+45.4 2012: R+47.5 2008: R+42.2
Not yet ingested
- Civics
- —
Market trends
- HPI YoY
- ▼ -82.58%
- Current HPI
- 255.0247
- Rent YoY
- ▲ 3.40%
- Metro
- Dallas-Fort Worth-Arlington, TX
- State GDP YoY
- ▲ 3.95%
- F500 in state
- 110
Industry mix (Fortune 500 HQ in TX)
| Industry | F500 HQs | Revenue |
|---|---|---|
| Energy | 16 | $1,198B |
|
||
| Technology | 5 | $198B |
|
||
| Engineering / Construction | 4 | $72B |
|
||
| Energy Services | 3 | $60B |
|
||
| Utilities | 3 | $41B |
|
||
| Healthcare | 2 | $330B |
|
||
Price history
+377.1% since first listed9 events — show timeline
- 2026-05-25 Price Changed $199,900 NTREIS
- 2026-05-22 Relisted — NTREIS
- 2026-05-18 Contingent — NTREIS
- 2026-04-30 Listed $215,000 NTREIS
- 2025-08-27 Sold (Public Records) — Public Records
- 2018-08-24 Sold (Public Records) — Public Records
- 2014-12-23 Sold (Public Records) — Public Records
- 1995-04-04 Sold (Public Records) $45,000 Public Records
- 1989-07-21 Sold (Public Records) $41,900 Public Records
Property tax history
+4.2%/yrLatest (2025): $4,330 · -19.6% YoY. Source: county tax records.
Cash-flow waterfall
monthlySold comps — $/sqft
last 12 mo · ≤1 miLoading sold comps…