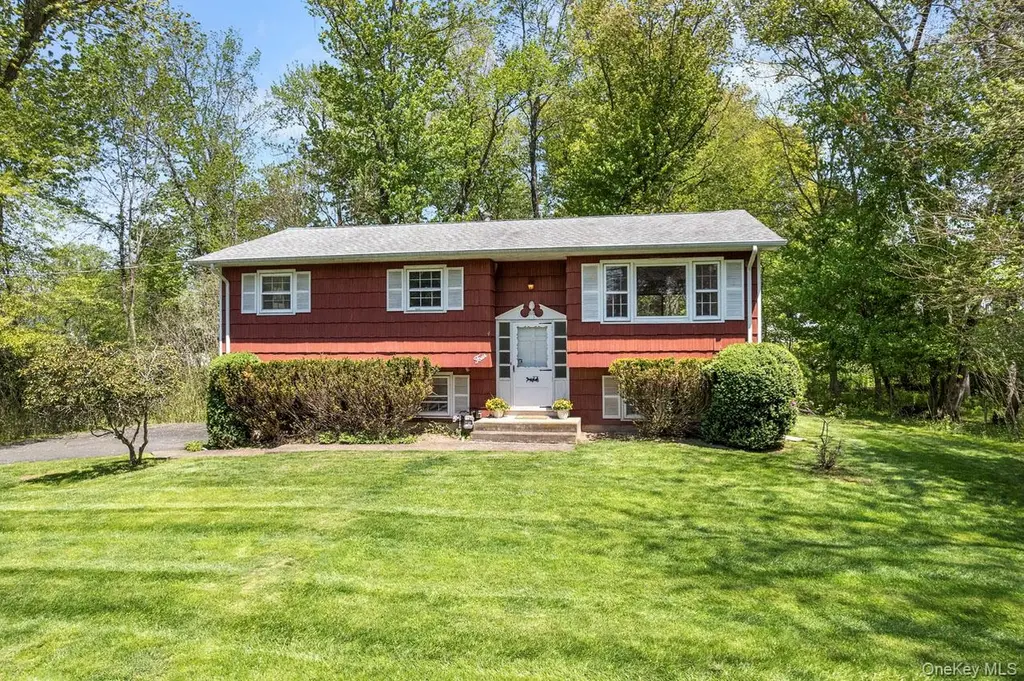
4 Brentwood Dr · New City, NY
Flood risk 1/10 · Minimal
- FEMA flood zone
- X (unshaded)
- Chance of flooding over 30 yrs
- 0.0%
- Est. flood insurance / yr
- $473 – $860
Fire risk 2/10 · Minimal
- Est. fire insurance / yr
- $691 – $1,283
Heat risk 6/10 · Moderate
- Hot days now (above 99°F)
- 7 days/yr
- Hot days in 30 yrs
- 15 days/yr
Wind risk 5/10 · Moderate
- Chance of severe wind over 30 yrs
- 26.0%
Air-quality risk 3/10 · Minor
- Unhealthy air days now
- 2 days/yr
- Unhealthy air days in 30 yrs
- 3 days/yr
Risk factors via First Street. Map © Google.
Why this score? — see what drove the D grade
The composite is a weighted blend of 9 inputs, each scored 0–100. Each bar is that input's sub-score; the figure is the points it added to the 100-point composite (weight × sub-score).
- ARV discount +15.0/15.0
- Cash flow +7.7/30.0
- Schools +6.9/10.0
- Livability +4.0/5.0
- 1% rule +2.9/10.0
- Rent growth +2.5/5.0
- Condition / age +2.5/5.0
- DSCR +1.8/10.0
- Appreciation +0.0/10.0
$624,900
🖨 Deal sheet (PDF) 📄 Offer letter ✓ Due diligence
Listing remarks
Opportunity knocks with this 4-bedroom, 1.5-bath raised ranch, ideally situated on a quiet dead-end street just moments from Route 304—offering easy access for commuters while maintaining a peaceful neighborhood setting. This home is ready for its next chapter and is being sold as-is, making it a perfect fit for buyers with vision. Freshly painted throughout, with carpeting removed to reveal hardwood floors waiting to be restored, the groundwork has already begun. Natural light pours into the living room through a large picture window, creating a warm and inviting space. Sliding glass doors lead to the deck, offering a seamless connection to the outdoors and great potential for entert
Key facts
- 0.59 acre lot
- Garage
- Built 1969
Property features AI
Exterior
- Parking: Driveway; 1-car garage
- Utilities: Public sewer; Electricity connected; Natural gas connected; Public water
- Home design: Single family residence; Living area per public records
- Construction: Frame construction
- Exterior features: Frame construction; Not waterfront
Interior
- Kitchen: Gas cooktop; Gas oven; Refrigerator
- Bedrooms: Total rooms: 8; Full attic
- Flooring: Hardwood floors
- Bathrooms: 1 full bathroom; 1 half bathroom
- Heating & cooling: Baseboard heating; Central air conditioning
- Interior features: Eat-in kitchen; Formal dining room; Deck
- Laundry & utility: Laundry room
Neighborhood map
What this means for you Summary
Snapshot
- This is a 4-bed/1.5-bath single-family listed at $625k.
Deal economics
- At list price, monthly cash flow is $-719 ($-9k/yr) — negative.
- To cash-flow at today's rent, offer at most $498k (20.3% below list).
- To meet the 1% rule (rent ≥ 1% of price), the offer needs to be $492k (21.2% below list).
- Recommended offer: $492k (21.2% below list) — sets the bar for 1% rule.
- Cap rate 4.9% vs local median 2.8% in New City — top-decile yield for the area; either an underpriced asset or a hidden risk that comps aren't pricing in. Stress-test before assuming the spread holds.
Location & tenants
- Location reads 80/100 on livability (#111 in NY, #1,835 nationally) — a professional / high-income tenant draw. Strengths: commute A+, employment A+, housing A+; Watch: amenities F, cost of living F.
- Clarkstown Central School District (suburban): math 72% / reading 75% proficiency, ranked #66 of 590 in NY (top 11%) — strong family-tenant draw, lease renewals of 3-5y typical; only 8% free/reduced lunch — higher-income household profile.
- Zoned schools: New City Elementary School (math 67% / reading 72%, grade A-, #447 of 2,108 statewide, top 24%, 435 students, 0% FRL); Felix Festa Achievement Middle School (math 57% / reading 77%, grade A-, #101 of 729 statewide, top 15%, 640 students, 19% FRL); Clarkstown North Senior High School (math 97% / reading 87%, grade A+, #171 of 1,100 statewide, top 18%, 1,234 students, 21% FRL) — zoned schools at 13% FRL track the district average.
- Market conditions: 185 active listings in the ZIP; 1 comparable units currently listed for rent nearby; 429 units permitted in Rockland County in 2024 (231 in 5+ unit buildings).
Forward outlook
- Local home prices are declining (-3.0%/yr); year-one equity from $4k of loan paydown is wiped out by about $19k of value loss. Plan a longer hold.
- Rockland County population projected at +7% by 2050 — modest demand growth; plan on rents tracking national, not racing it.
Negotiation context
- Only 6 days on market — expect competitive offers; lowballing is unlikely to land.
Risks & watch-outs
- Climate carrying-cost: moderate wind risk, 26% chance of damaging wind over 30y; extreme-heat days projected 7→15/yr by 2055 (HVAC capex compounding) — expect insurance premiums to compound above CPI over the hold.
Questions for the listing agent
- What do current leases actually rent for vs. the listed asking? Can we see a recent rent roll and the last 12 months of T-12 income?
- Built in 1969 — when were the roof, HVAC, electrical panel, plumbing, and water heater last replaced?
- Is there a deadline driving the sale (1031 exchange, divorce, estate, relocation)? That informs how much negotiation room exists.
- Schools are A-rated — typically a magnet for longer-tenancy family renters. What's the average tenant stay here, and is there a school-zone premium baked into asking?
- The area grade is low — what's the realistic commute time and amenity access for the typical tenant pool here? Any planned neighborhood developments (good or bad) we should know about?
- What's the average days-on-market for RENTAL listings here right now (not sales)? A rising rental-DOM trend means longer vacancies and softer asking-rent achievability than the comps imply.
- What's the recent tenant-quality profile in this submarket — average credit score on applications, eviction rate, late-payment / NSF rate, and stable-employment percentage? A property-management company in the area should have these aggregated.
- How much new for-sale + rental construction is in the pipeline within 1–3 miles? Heavy new supply typically softens prices + rents 12–24 months out; constrained supply supports both.
Investment metrics
- 1% rule
- 0.79% ✗
- Cap rate
- 4.91%
- Cash-on-cash
- -4.93%
- DSCR
- 0.78
- GRM
- 10.6
CMA / ARV
- ARV (median comp)
- $799,650
- List price
- $624,900
- Delta
- -21.85%
- Verdict
- UNDERPRICED
- Comps
- 20 within 1.0 mi
Show comp detail 3 sales within ~0.75 mi
| Address | Dist | Beds/Ba | Sqft | Sold | Price | $/sf | Match |
|---|---|---|---|---|---|---|---|
| 1 Brookside Ave | 0.20mi | 3/2.0 (-1) | 1,500 (-6%) | 0mo | $655,000 | $437 | 72 |
| 5 Brookside Ave | 0.21mi | 3/2.0 (-1) | 1,764 (+10%) | 4mo | $740,000 | $420 | 63 |
| 24 Scher Dr | 0.20mi | 4/2.0 | 1,788 (+12%) | 18mo | $700,000 | $391 | 54 |
Match score weights: distance 35% · size 25% · config 20% · recency 20%. Top-matched comps best support the ARV.
Projected returns pro-forma
-3.0% appreciation · 3.0% rent growth · sell at horizon
- IRR
- -24.6%
- Equity multiple
- 0.16×
- Total profit
- $-146,832
- Equity at exit
- $93,175
- IRR
- -20.1%
- Equity multiple
- -0.06×
- Total profit
- $-185,835
- Equity at exit
- $54,030
Cash invested: $174,972 (down + closing). Projections, not guarantees.
Landlord ↔ Tenant lean methodology
- Overall (STATE)
- 15 Strongly Tenant-Friendly
- State New York
- 15 Strongly Tenant-Friendly · D+10
- County
- — inherits STATE
- City
- — inherits STATE
ZIP-level market 10956
- Active inventory
- 185
- Price-to-rent
- 10.6×
Monthly cashflow live
- Estimated rent
- $4,925 medium interval (Pro) →
- Mortgage (P&I)
- −$3,277
- Tax from tax record
- −$1,073 /mo · $12,874/yr
- Insurance
- −$260
- HOA
- −$0
- Vacancy / Maint / Mgmt
- −$1,034
- Net cashflow
- $-719
Break-even live
Sensitivity live
| Price | -10% $-366 | -5% $-543 | +0% $-719 | +5% $-896 | +10% $-1,073 |
|---|---|---|---|---|---|
| Rent | -10% $-1,109 | -5% $-914 | +0% $-719 | +5% $-525 | +10% $-330 |
| Rate | -1.0pp $-405 | -0.5pp $-561 | base $-719 | +0.5pp $-881 | +1.0pp $-1,046 |
UW: 25.0% down · 7.5% · 30yr · 1.5% tax · 5.0% vac · 8.0% maint · 8.0% mgmt
Financing live
Cash to close
- Down payment
- $156,225
- Closing costs
- $18,747
- Reserves months
- —
- Total cash needed
- —
Loan-product check · same deal, 3 products live
Conventional
25% down · 7.5% · 30yr
- Down + closing
- —
- Monthly P&I
- —
- Monthly cashflow
- —
- DSCR
- —
- Eligible?
- —
Personal DTI + credit; lowest rate.
DSCR
20% down · 8.5% · 30yr
- Down + closing
- —
- Monthly P&I
- —
- Monthly cashflow
- —
- DSCR
- —
- Eligible?
- —
No personal income docs; deal must DSCR.
Hard money
10% down · 12.0% · 12mo
- Down + closing
- —
- Monthly P&I
- —
- Monthly cashflow
- —
- DSCR
- —
- Eligible?
- —
Short-term bridge; refi at stabilization.
Rent comps 1 comps
| Address | Beds | Baths | Sqft | Rent | $/sqft | DOM | Units | Dist |
|---|---|---|---|---|---|---|---|---|
| 16 Elmwood Dr New City, NY | 3.0 | 2.0 | 1250 | $4,925 | $3.94 | 0d | 1 | 1.32mi |
Listing history 2 events
-
2026-05-09$624,900 Active
-
2026-05-04historical
ⓘ Source: listings_history table (triggers on properties + properties_extension) + one-shot
backfill from property_details.listing_events for pre-trigger history.
Tax reassessment forecast NY · Partial reset (capped growth)
- Current annual tax
- $12,874 · $1,073/mo
- Projected year-2 tax
- $12,874 · $1,073/mo
- Expected delta
- $0/yr ($0/mo · 0.0%)
ⓘ Screening estimate from a state-policy table — verify with the county assessor before closing.
Climate risk First Street
- Flood 1/10 Low FEMA zone X (unshaded) · 0% chance over 30 yrs
- Wildfire 2/10 Low
- Heat 6/10 Major 7 d/yr ≥99°F today · 15 d/yr by 30 yrs out
- Wind 5/10 Major 26% chance of damaging wind over 30 yrs
- Air quality 3/10 Moderate 2 unhealthy d/yr today · 3 by 30 yrs out
Nearby sold comps map
Loading sold comps map…
Walkable amenities ~0.75 mi
Loading nearby amenities…
Taxation est. · year 1
- Rental income
- $59,100
- − Mortgage interest
- −$35,004
- − Property taxes
- −$12,874
- − Insurance
- −$3,124
- − Repairs & maintenance
- −$4,728
- − Management
- −$4,728
- − Depreciation
- −$18,179
- Taxable loss
- −$19,537
- Est. tax savings @ 24.0%
- +$4,689
- After-tax cash flow
- $-3,945/yr
For passive investors: Depreciation is non-cash, so a rental often shows a tax loss while cash-flowing — sheltering income. Rental losses are passive: they offset passive income freely, and up to $25,000/yr can offset ordinary (W-2) income if you actively participate and your MAGI is under $100k (phasing out to $0 by $150k); unused losses carry forward. On sale, claimed depreciation is recaptured at up to 25%, and gains may owe capital-gains tax (a 1031 exchange can defer both). Figures are a year-1 estimate at your 24.0% rate — not tax advice; consult a CPA.
Schools (NCES district)
- District
- Clarkstown Central School District
- NCES district ID
- 3620340
- Math proficiency
- 72% ▼ -1.00%
- Reading proficiency
- 75% ▲ 6.00%
- Median HH income
- $115,765
- Composite
- 68.55/100
- National rank
- #342
- State rank
- #66 of 590 in NY
Livability — New City
- Score
- 80/100
- State rank
- #111
- US rank
- #1835
Category grades
Schools grade is shown separately in the Schools card above.
Census & demographics
- Census place
- New City, NY
- City population
- 31,420
- Population (ZIP)
- 31,420
Population outlook (Rockland County) Hauer SSP2
- Today (2025)
- 339,642 people
- By 2030
- 345,987 · +1.9%
- By 2040
- 357,178 · +5.2%
- By 2050
- 362,456 · +6.7%
- By 2075
- 367,281 · +8.1%
- By 2100
- 328,211 · -3.4%
Race, ethnicity, and origin ACS 2023
- Neighborhood character
- Diverse neighborhood (Simpson 0.60)
- Race & ethnicity
- White 58% Hispanic / Latino 19% Asian 13% Two or more races 10% Black 6%
- Hispanic origin (detail)
- Puerto Rican 7% Dominican 5%
- Common ancestry
- Romanian 4% Scotch-Irish 4% Italian 1%
- Foreign-born
- 23% · Canada, China, South Korea
- Languages at home
- 68% English-only · Spanish 13% Other Indo-European 5% Other Asian/Pacific 4%
Political lean MEDSL · Rockland
- 2024 margin
- R (+11.8) · D 44.1% · R 55.9%
- 2008→2024 swing
- -17.7pp toward R · 2008: 5.9pp · 2024: -11.8pp
- All cycles
- 2024: R+11.8 2020: D+1.7 2016: D+5.1 2012: D+6.6 2008: D+5.9
Not yet ingested
- Civics
- —
Market trends
- HPI YoY
- ▼ -530.90%
- Current HPI
- 261.6277
- Rent YoY
- —
- Metro
- —
- State GDP YoY
- ▲ 2.60%
- F500 in state
- 92
Industry mix (Fortune 500 HQ in NY)
| Industry | F500 HQs | Revenue |
|---|---|---|
| Financial Services | 10 | $950B |
|
||
| Consumer Goods | 9 | $162B |
|
||
| Insurance | 4 | $225B |
|
||
| Telecommunications | 2 | $144B |
|
||
| Pharmaceuticals | 2 | $112B |
|
||
| Media / Entertainment | 2 | $69B |
|
||
Price history
+0.0% since first listed3 events — show timeline
- 2026-05-26 Pending — OneKey® MLS as Distributed by MLS Grid
- 2026-05-09 Listed $624,900 OneKey® MLS as Distributed by MLS Grid
- 2026-05-04 Coming Soon $624,900 OneKey® MLS as Distributed by MLS Grid
Property tax history
+4.0%/yrLatest (2025): $12,874 · -1.4% YoY. Source: county tax records.
Cash-flow waterfall
monthlySold comps — $/sqft
last 12 mo · ≤1 miLoading sold comps…