920 W Tony St Unit B · Gonzales, LA
Flood risk 4/10 · Minor
- FEMA flood zone
- X
- Chance of flooding over 30 yrs
- 0.22%
- Est. flood insurance / yr
- $507 – $1,088
Fire risk 1/10 · Minimal
- Est. fire insurance / yr
- $1,269 – $2,357
Heat risk 8/10 · Major
- Hot days now (above 107°F)
- 7 days/yr
- Hot days in 30 yrs
- 22 days/yr
Wind risk 9/10 · Severe
- Chance of severe wind over 30 yrs
- 99.0%
Air-quality risk 2/10 · Minimal
- Unhealthy air days now
- 2 days/yr
- Unhealthy air days in 30 yrs
- 2 days/yr
Risk factors via First Street. Map © Google.
Why this score? — see what drove the D grade
The composite is a weighted blend of 9 inputs, each scored 0–100. Each bar is that input's sub-score; the figure is the points it added to the 100-point composite (weight × sub-score).
- Cash flow +16.0/30.0
- 1% rule +6.3/10.0
- DSCR +4.9/10.0
- Schools +4.7/10.0
- Rent growth +3.3/5.0
- Livability +3.2/5.0
- Condition / age +2.5/5.0
- ARV discount +1.4/15.0
- Appreciation +0.0/10.0
$134,500
🖨 Deal sheet (PDF) 📄 Offer letter ✓ Due diligence
Listing remarks MLS
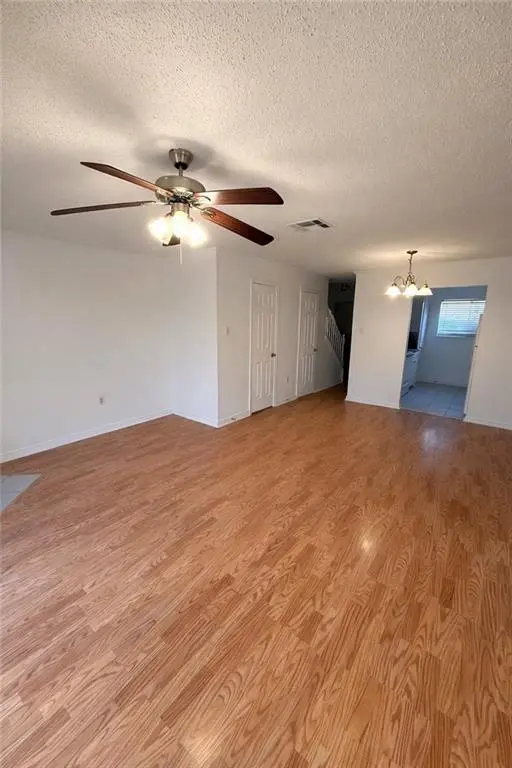
Well positioned for convenient access to major shopping destinations, restaurants, and daily necessities. This well-maintained condo features warm plank flooring throughout the main living areas with ceramic tile in the kitchen and baths. Refrigerator, washer, and dryer are included for added convenience.
Key facts
- Dryer included
- Ceramic tile
- Warm plank flooring
Tags
Neighborhood map
What this means for you Summary
Snapshot
- This is a 2-bed/1.5-bath townhouse listed at $134k.
Deal economics
- At list price, monthly cash flow is $66 ($797/yr) — positive.
- The deal already cash-flows at list — no discount required.
- Meets the 1% rule at list price ($2k rent vs $134k).
- Recommended offer: $118k (12.0% below list) — sets the bar for market timing.
- Cap rate 6.9% vs local median 4.5% in Gonzales — top-decile yield for the area; either an underpriced asset or a hidden risk that comps aren't pricing in. Stress-test before assuming the spread holds.
Location & tenants
- Location reads 65/100 on livability (#135 in LA) — a middle-class / working-renter tenant base. Strengths: cost of living A+, housing A+; Watch: employment D, crime F, amenities F.
- Ascension Parish (suburban): math 48% / reading 58% proficiency, ranked #7 of 98 in LA (top 7%) — acceptable for families but not a draw, mixed tenant base, ~2y average lease.
- Zoned schools: Pecan Grove Primary School (math 35% / reading 51%, grade F, #197 of 646 statewide, top 31%, 643 students, 71% FRL); Gonzales Middle School (math 18% / reading 33%, grade F, #139 of 218 statewide, top 64%, 781 students, 69% FRL); East Ascension High School (math 47% / reading 49%, grade D, #43 of 265 statewide, top 16%, 2,098 students, 55% FRL) — zoned schools average 65% FRL vs 44% district-wide (21 pts higher); higher-poverty schools than district average — tighter screening recommended.
- Zoned-school proficiency averages 39% at this address vs 53% district-wide (-14 pts) — the specific schools serving this property underperform the Ascension Parish average; the district grade overstates school quality for this exact location.
- Market conditions: Rents rising (+3.3%/yr); 571 active listings in the ZIP; 7 comparable units currently listed for rent nearby; rentals at typical pace (median 17d on market — plan ~3-4 weeks tenant-placement turnaround); solid renter incomes; 579 units permitted in Ascension Parish in 2024 (0 in 5+ unit buildings).
Forward outlook
- Local home prices are declining (-3.0%/yr); year-one equity from $930 of loan paydown is wiped out by about $4k of value loss. Plan a longer hold.
- Ascension County population projected at +43% by 2050 — long-run rental-demand tailwind backs the buy-and-hold thesis.
Negotiation context
- It's been on market 142 days — a 12% lower offer ($118k) is reasonable based on typical stale-listing flexibility.
- 9 sale attempts since 7y ago; this cycle's ask is 9507% above the opening price — seller raised mid-cycle; expect resistance to lowballs.
- Current owner paid $86k; list at $134k implies a 57% gain — meaningful room to come down on a strong offer.
Risks & watch-outs
- Climate carrying-cost: severe wind risk, 99% chance of damaging wind over 30y; extreme-heat days projected 7→22/yr by 2055 (HVAC capex compounding) — expect insurance premiums to compound above CPI over the hold.
Questions for the listing agent
- It's been on market 142 days. Have you received any prior offers? Is the seller open to a 12% concession, seller financing, or rate buy-down credit?
- What does the HOA fee cover, when was the last increase, and are there any pending special assessments or reserve-fund shortfalls?
- Why hasn't it sold? Are there any deal-killer items the seller is aware of (foundation, flood, title, zoning, code violations)?
- Is there a deadline driving the sale (1031 exchange, divorce, estate, relocation)? That informs how much negotiation room exists.
- Schools are B-rated — typically a magnet for longer-tenancy family renters. What's the average tenant stay here, and is there a school-zone premium baked into asking?
- Crime grade is F in this area — have there been break-ins, vandalism, or insurance claims at this property in the last 3 years? What carrier currently insures it and at what premium?
- The area grade is low — what's the realistic commute time and amenity access for the typical tenant pool here? Any planned neighborhood developments (good or bad) we should know about?
- What's the average days-on-market for RENTAL listings here right now (not sales)? A rising rental-DOM trend means longer vacancies and softer asking-rent achievability than the comps imply.
- What's the recent tenant-quality profile in this submarket — average credit score on applications, eviction rate, late-payment / NSF rate, and stable-employment percentage? A property-management company in the area should have these aggregated.
- How much new for-sale + rental construction is in the pipeline within 1–3 miles? Heavy new supply typically softens prices + rents 12–24 months out; constrained supply supports both.
Investment metrics
- 1% rule
- 1.13% ✓
- Cap rate
- 6.89%
- Cash-on-cash
- 2.12%
- DSCR
- 1.09
- GRM
- 7.4
CMA / ARV
- ARV (median comp)
- $118,414
- List price
- $134,500
- Delta
- 13.58%
- Verdict
- OVERPRICED
- Comps
- 20 within 1.0 mi
Show comp detail 12 sales within ~0.75 mi
| Address | Dist | Beds/Ba | Sqft | Sold | Price | $/sf | Match |
|---|---|---|---|---|---|---|---|
| 919 W Rothland St Unit 5B | 0.02mi | 2/1.5 | 1,088 (0%) | 6mo | $125,000 | $115 | 94 |
| 919 W Rothland St Unit D | 0.02mi | 2/1.5 | 1,088 (0%) | 7mo | $130,000 | $119 | 93 |
| 913 W Rothland St Unit 6-C | 0.02mi | 2/1.5 | 1,088 (0%) | 7mo | $124,900 | $115 | 93 |
| 2715 S Roth Ave Unit 9B | 0.02mi | 2/1.5 | 1,088 (0%) | 12mo | $119,000 | $109 | 89 |
| 2817 S Roth Ave Unit 17-C | 0.06mi | 2/1.5 | 1,108 (+2%) | 7mo | $114,900 | $104 | 88 |
| 919 W Rothland St Unit 5-C | 0.02mi | 2/1.5 | 1,088 (0%) | 14mo | $111,900 | $103 | 88 |
| 910 W Macci St Unit B | 0.08mi | 2/1.5 | 1,108 (+2%) | 12mo | $109,000 | $98 | 83 |
| 2628 S Roth Ave Unit 31B | 0.09mi | 2/1.0 | 1,035 (-5%) | 13mo | $116,000 | $112 | 75 |
| 921 W Macci St Unit 21C | 0.11mi | 2/2.0 | 975 (-10%) | 2mo | $115,000 | $118 | 74 |
| 921 W Tony St Unit 13 - C | 0.05mi | 2/2.0 | 975 (-10%) | 14mo | $114,900 | $118 | 66 |
| 921 W Tony St Unit 13D | 0.04mi | 2/2.0 | 975 (-10%) | 16mo | $112,500 | $115 | 66 |
| 921 W Elrem St Unit 25-A | 0.15mi | 2/2.0 | 975 (-10%) | 11mo | $110,000 | $113 | 65 |
Match score weights: distance 35% · size 25% · config 20% · recency 20%. Top-matched comps best support the ARV.
Projected returns pro-forma
-3.0% appreciation · 3.26% rent growth · sell at horizon
- IRR
- -12.5%
- Equity multiple
- 0.55×
- Total profit
- $-17,017
- Equity at exit
- $20,054
- IRR
- -2.8%
- Equity multiple
- 0.81×
- Total profit
- $-7,118
- Equity at exit
- $11,629
Cash invested: $37,660 (down + closing). Projections, not guarantees.
Landlord ↔ Tenant lean methodology
- Overall (STATE)
- 90 Strongly Landlord-Friendly
- State Louisiana
- 90 Strongly Landlord-Friendly · R+12
- County
- — inherits STATE
- City
- — inherits STATE
ZIP-level market 70737
- Rents YoY
- 3.3%
- Active inventory
- 571
- Price-to-rent
- 7.4×
Monthly cashflow live
- Estimated rent
- $1,522 high interval (Pro) →
- Mortgage (P&I)
- −$705
- Tax from tax record
- −$83 /mo · $992/yr
- Insurance
- −$56
- HOA
- −$292
- Lot rent
- −$0
- Vacancy / Maint / Mgmt
- −$320
- Net cashflow
- $66
Break-even live
Sensitivity live
| Price | -10% $143 | -5% $104 | +0% $66 | +5% $28 | +10% $-10 |
|---|---|---|---|---|---|
| Rent | -10% $-54 | -5% $6 | +0% $66 | +5% $127 | +10% $187 |
| Rate | -1.0pp $134 | -0.5pp $101 | base $66 | +0.5pp $32 | +1.0pp $-4 |
UW: 25.0% down · 7.5% · 30yr · 1.5% tax · 5.0% vac · 8.0% maint · 8.0% mgmt
Financing live
Cash to close
- Down payment
- $33,625
- Closing costs
- $4,035
- Reserves months
- —
- Total cash needed
- —
Loan-product check · same deal, 3 products live
Conventional
25% down · 7.5% · 30yr
- Down + closing
- —
- Monthly P&I
- —
- Monthly cashflow
- —
- DSCR
- —
- Eligible?
- —
Personal DTI + credit; lowest rate.
DSCR
20% down · 8.5% · 30yr
- Down + closing
- —
- Monthly P&I
- —
- Monthly cashflow
- —
- DSCR
- —
- Eligible?
- —
No personal income docs; deal must DSCR.
Hard money
10% down · 12.0% · 12mo
- Down + closing
- —
- Monthly P&I
- —
- Monthly cashflow
- —
- DSCR
- —
- Eligible?
- —
Short-term bridge; refi at stabilization.
Rent comps 7 comps
| Address | Beds | Baths | Sqft | Rent | $/sqft | DOM | Units | Dist |
|---|---|---|---|---|---|---|---|---|
| 920 W Tony St Unit 12-D Gonzales, LA | 2.0 | 1.5 | 1088 | $1,425 | $1.31 | 25d | 1 | 0.01mi |
| 910 W Macci St Unit 18D Gonzales, LA | 2.0 | 1.5 | 1108 | $1,375 | $1.24 | 25d | 1 | 0.07mi |
| 609 Saint Francis Pkwy Gonzales, LA | 1.0–3.0 | 1.0–2.0 | 1104 | $1,706 | $1.55 | 16d | 15 | 0.34mi |
| 2020 S Veterans Blvd Gonzales, LA | 1.0–2.0 | 1.0–2.0 | 895 | $1,653 | $1.85 | 16d | 14 | 0.92mi |
| 2009 S Veterans Blvd Gonzales, LA | 2.0–3.0 | 2.0 | 1191 | $2,020 | $1.70 | 16d | 13 | 1.11mi |
| 2419 W Orice Roth Rd Gonzales, LA | 1.0–3.0 | 1.0–2.0 | 1084 | $1,318 | $1.22 | 16d | 19 | 1.20mi |
| 1018 S Mire Ave Gonzales, LA | 3.0 | 1.0 | 1106 | $1,350 | $1.22 | 46d | 1 | 1.21mi |
HOA detail
- Monthly dues
- $292 · $3,504/yr
Listing history 34 events
-
2026-06-21days on market $134,500 Active 142 DOM
-
2026-06-18days on market $134,500 Active 139 DOM
-
2026-06-17days on market $134,500 Active 138 DOM
-
2026-06-16days on market $134,500 Active 137 DOM
-
2026-06-15days on market $134,500 Active 136 DOM
-
2026-06-14days on market $134,500 Active 134 DOM
-
2026-06-10days on market $134,500 Active 131 DOM
-
2026-06-09days on market $134,500 Active 130 DOM
-
2026-06-08days on market $134,500 Active 129 DOM
-
2026-06-07days on market $134,500 Active 128 DOM
-
2026-06-05days on market $134,500 Active 125 DOM
-
2026-06-03days on market $134,500 Active 124 DOM
-
2026-06-02days on market $134,500 Active 123 DOM
-
2026-06-01days on market $134,500 Active 122 DOM
-
2026-05-31days on market $134,500 Active 121 DOM
-
2026-05-31days on market $134,500 Active 120 DOM
-
2026-03-29historical $1,400
-
2026-03-01$1,400
-
2026-02-28historical $1,400
-
2026-01-30$134,500 Active 306-char remark
Show marketing remark (306 chars)
Well positioned for convenient access to major shopping destinations, restaurants, and daily necessities. This well-maintained condo features warm plank flooring throughout the main living areas with ceramic tile in the kitchen and baths. Refrigerator, washer, and dryer are included for added convenience.
-
2026-01-21$1,400
-
2023-08-07soldstatus
-
2023-04-24$1,350
-
2022-01-17soldstatus
-
2022-01-10$1,100
-
2019-08-01soldstatus
-
2019-07-08$1,020
-
2019-04-23soldstatus $85,500
-
2019-04-19soldstatus Sold
-
2019-03-19status Pending
-
2019-03-11$90,000 Active
-
2019-03-11$90,000
-
2006-01-03soldstatus $86,900
ⓘ Source: listings_history table (triggers on properties + properties_extension) + one-shot
backfill from property_details.listing_events for pre-trigger history.
Tax reassessment forecast LA · Resets to sale price
- Current annual tax
- $992 · $83/mo
- Projected year-2 tax
- $992 · $83/mo
- Expected delta
- $0/yr ($0/mo · 0.0%)
ⓘ Screening estimate from a state-policy table — verify with the county assessor before closing.
Climate risk First Street
- Flood 4/10 Moderate FEMA zone X · 22% chance over 30 yrs
- Wildfire 1/10 Low
- Heat 8/10 Severe 7 d/yr ≥107°F today · 22 d/yr by 30 yrs out
- Wind 9/10 Extreme 99% chance of damaging wind over 30 yrs
- Air quality 2/10 Low 2 unhealthy d/yr today · 2 by 30 yrs out
Nearby sold comps map
Loading sold comps map…
Walkable amenities ~0.75 mi
Loading nearby amenities…
Taxation est. · year 1
- Rental income
- $18,265
- − Mortgage interest
- −$7,534
- − Property taxes
- −$992
- − Insurance
- −$672
- − Repairs & maintenance
- −$1,461
- − Management
- −$1,461
- − HOA
- −$3,504
- − Depreciation
- −$3,913
- Taxable loss
- −$1,273
- Est. tax savings @ 24.0%
- +$305
- After-tax cash flow
- $1,102/yr
For passive investors: Depreciation is non-cash, so a rental often shows a tax loss while cash-flowing — sheltering income. Rental losses are passive: they offset passive income freely, and up to $25,000/yr can offset ordinary (W-2) income if you actively participate and your MAGI is under $100k (phasing out to $0 by $150k); unused losses carry forward. On sale, claimed depreciation is recaptured at up to 25%, and gains may owe capital-gains tax (a 1031 exchange can defer both). Figures are a year-1 estimate at your 24.0% rate — not tax advice; consult a CPA.
Schools (NCES district)
- District
- Ascension Parish
- NCES district ID
- 2200090
- Math proficiency
- 48% ▼ -31.00%
- Reading proficiency
- 58% ▼ -25.00%
- Median HH income
- $68,423
- Composite
- 47.0/100
- National rank
- #2347
- State rank
- #7 of 98 in LA
Livability — Gonzales
- Score
- 65/100
- State rank
- #135
- US rank
- #12429
Category grades
Schools grade is shown separately in the Schools card above.
Census & demographics
- Census place
- Gonzales, LA
- County
- Ascension Parish · 98,362 people
- City population
- 49,084
- Metro
- Baton Rouge, LA
- Population (ZIP)
- 49,084
- Household income
- $82,521
- Rent vs Own
- Severe rent burden
- 863.0
Population outlook (Ascension County) Hauer SSP2
- Today (2025)
- 145,480 people
- By 2030
- 158,329 · +8.8%
- By 2040
- 183,741 · +26.3%
- By 2050
- 207,615 · +42.7%
- By 2075
- 260,244 · +78.9%
- By 2100
- 289,576 · +99.0%
Race, ethnicity, and origin ACS 2023
- Neighborhood character
- Diverse neighborhood (Simpson 0.57)
- Race & ethnicity
- White 59% Black 26% Hispanic / Latino 10% Two or more races 7%
- Hispanic origin (detail)
- Mexican 6%
- Common ancestry
- Lithuanian 15% Serbian 1% Slovak 1%
- Foreign-born
- 7% · Canada
- Languages at home
- 89% English-only · Spanish 9% French/Haitian/Cajun 1% Other Indo-European 1%
Political lean MEDSL · Ascension
- 2024 margin
- Solid R (+34.0) · D 32.2% · R 66.1% · Other 1.7%
- 2008→2024 swing
- +1.7pp toward D · 2008: -35.7pp · 2024: -34.0pp
- All cycles
- 2024: R+34.0 2020: R+32.5 2016: R+36.0 2012: R+34.3 2008: R+35.7
Not yet ingested
- Civics
- —
Market trends
- HPI YoY
- ▼ -89.49%
- Current HPI
- 145.3384
- Rent YoY
- ▲ 3.26%
- Metro
- Baton Rouge, LA
- State GDP YoY
- ▲ 3.29%
- F500 in state
- 10
Industry mix (Fortune 500 HQ in LA)
| Industry | F500 HQs | Revenue |
|---|---|---|
| Telecommunications | 2 | $23B |
|
||
| Utilities | 1 | $12B |
|
||
| Wholesale / Distribution | 1 | $5B |
|
||
| Advertising | 1 | $2B |
|
||
Price history
-98.4% since first listed18 events — show timeline
- 2026-03-29 Rental Removed $1,400 RENTSPREE
- 2026-03-01 Listed for Rent $1,400 RENTSPREE
- 2026-02-28 Rental Removed $1,400 GSREIN
- 2026-01-30 Listed $134,500 GSREIN
- 2026-01-30 Listed $134,500 AcadianaMLS
- 2026-01-21 Listed for Rent $1,400 GSREIN
- 2023-08-07 Sold (MLS) — GBRMLS
- 2023-04-24 Listed $1,350 GBRMLS
- 2022-01-17 Sold (MLS) — GBRMLS
- 2022-01-10 Listed $1,100 GBRMLS
- 2019-08-01 Sold (MLS) — GBRMLS
- 2019-07-08 Listed $1,020 GBRMLS
- 2019-04-23 Sold (Public Records) $85,500 Public Records
- 2019-04-19 Sold (MLS) — GBRMLS
- 2019-03-19 Pending — GBRMLS
- 2019-03-11 Listed $90,000 AcadianaMLS
- 2019-03-11 Listed $90,000 GBRMLS
- 2006-01-03 Sold (Public Records) $86,900 Public Records
Property tax history
+0.2%/yrLatest (2025): $992 · -1.6% YoY. Source: county tax records.
Cash-flow waterfall
monthlySold comps — $/sqft
last 12 mo · ≤1 miLoading sold comps…