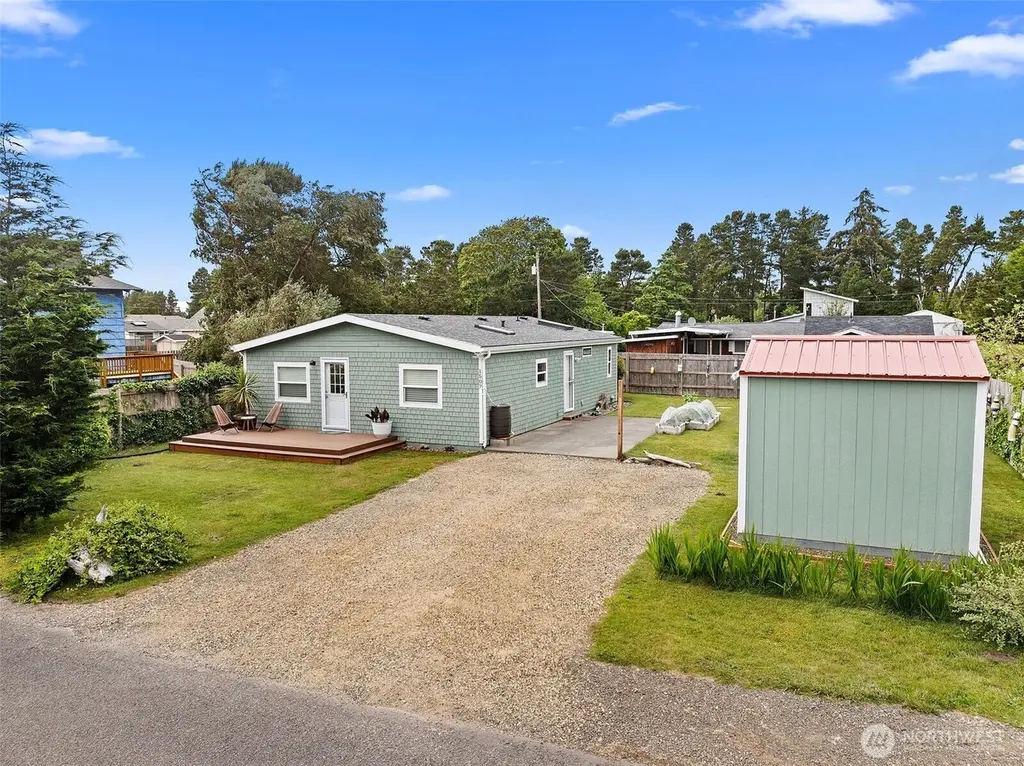
1507 198 Pl · Long Beach, WA
Flood risk 1/10 · Minimal
- FEMA flood zone
- X (unshaded)
- Chance of flooding over 30 yrs
- 0.0%
- Est. flood insurance / yr
- $507 – $1,088
Fire risk 2/10 · Minimal
- Est. fire insurance / yr
- $604 – $1,122
Heat risk 1/10 · Minimal
- Hot days now (above 74°F)
- 8 days/yr
- Hot days in 30 yrs
- 17 days/yr
Wind risk 1/10 · Minimal
- Chance of severe wind over 30 yrs
- —
Air-quality risk 5/10 · Moderate
- Unhealthy air days now
- 6 days/yr
- Unhealthy air days in 30 yrs
- 6 days/yr
Risk factors via First Street. Map © Google.
Why this score? — see what drove the F grade
The composite is a weighted blend of 9 inputs, each scored 0–100. Each bar is that input's sub-score; the figure is the points it added to the 100-point composite (weight × sub-score).
- Cash flow +14.6/30.0
- DSCR +4.4/10.0
- Livability +3.9/5.0
- Schools +3.7/10.0
- 1% rule +3.0/10.0
- Rent growth +2.5/5.0
- Condition / age +2.5/5.0
- ARV discount +0.0/15.0
- Appreciation +0.0/10.0
$325,000
🖨 Deal sheet (PDF) 📄 Offer letter ✓ Due diligence
Listing remarks MLS
West side cutie on board! You'll be pleased to see this 2 bed, 2 bath nicely maintained home complimented by a great yard, 320 sq ft. front deck, & a path to the beach at the end of the road! Inside find nicely done laminate flooring, new backsplash tiles in kitchen & bathrooms, new ceramic tile in 2nd shower/bath. Main bedroom an ensuite w/2 seperate closets. Skylight in the kitchen & bathroom add an extra rays of light into the home. An Outdoor structure has been converted into a guest room.
Key facts
- Detached studio
- Covered garden
- 6,098 sq ft lot
Tags
Property features AI
Finance
- Other: Lot on a dead-end street; Garden space; Lot dimensions approximately 75 x 80 ft
- Financial info: Listing terms: Cash or Conventional
Exterior
- Parking: Driveway; Off-street parking
- Utilities: Electric service; Community water; Septic tank; Internet available (Choice); Power provided by PUD #2
- Home design: Manufactured on land (double wide); One level; Main entry; Faces south
- Construction: Built/Effective year 1992; Cement plank and wood construction; Composition roof; Poured concrete foundation
- Exterior features: Deck; Cement planked and wood exterior
Interior
- Kitchen: Dishwasher; Stove/Range; Refrigerator
- Bedrooms: 3 bedrooms (all on the main level)
- Flooring: Vinyl plank; Carpet
- Bathrooms: 2 full bathrooms; 2 bathtubs
- Heating & cooling: Forced air heating; Wall furnace; Forced air cooling
- Interior features: Ceiling fans; Skylights
- Laundry & utility: Washer; Dryer
Neighborhood map
What this means for you Summary
Snapshot
- This is a 2-bed/2.0-bath manufactured listed at $325k.
Deal economics
- At list price, monthly cash flow is $75 ($901/yr) — positive.
- The deal already cash-flows at list — no discount required.
- To meet the 1% rule (rent ≥ 1% of price), the offer needs to be $260k (20.0% below list).
- Recommended offer: $260k (20.0% below list) — sets the bar for 1% rule.
- Cap rate 6.6% vs local median 3.0% in Long Beach — top-decile yield for the area; either an underpriced asset or a hidden risk that comps aren't pricing in. Stress-test before assuming the spread holds.
Location & tenants
- Location reads 78/100 on livability (#133 in WA, #2,635 nationally) — a middle-class / working-renter tenant base. Strengths: health & safety A+, crime A-, amenities A-; Watch: employment C-, commute F.
- Ocean Beach School District (rural): math 34% / reading 50% proficiency, ranked #212 of 291 in WA (top 73%) — families likely to look elsewhere, expect single-tenant / working-renter base with shorter leases.
- Zoned schools: Ocean Park Elementary (196 students, 76% FRL); Hilltop Elementary School (236 students, 70% FRL); Ilwaco High School (296 students, 64% FRL).
- Market conditions: 122 active listings in the ZIP; 1 comparable units currently listed for rent nearby; 90 units permitted in Pacific County in 2024 (0 in 5+ unit buildings).
Forward outlook
- Local home prices are declining (-3.0%/yr); year-one equity from $2k of loan paydown is wiped out by about $10k of value loss. Plan a longer hold.
- Pacific County population projected at -10% by 2050 — secular population decline; favor cash flow + early exit over multi-decade hold.
Negotiation context
- It's been on market 16 days — a 2% lower offer ($320k) is reasonable based on typical stale-listing flexibility.
- 6 sale attempts since 11y ago with the ask held roughly flat each time — persistent listings suggest the price (not the market) is what's stuck; bring a comps-based counter.
- Current owner paid $255k; 27% above their basis — modest negotiation headroom, anchor on the comps not their cost.
Questions for the listing agent
- Is there a deadline driving the sale (1031 exchange, divorce, estate, relocation)? That informs how much negotiation room exists.
- The area grade is low — what's the realistic commute time and amenity access for the typical tenant pool here? Any planned neighborhood developments (good or bad) we should know about?
- What's the average days-on-market for RENTAL listings here right now (not sales)? A rising rental-DOM trend means longer vacancies and softer asking-rent achievability than the comps imply.
- What's the recent tenant-quality profile in this submarket — average credit score on applications, eviction rate, late-payment / NSF rate, and stable-employment percentage? A property-management company in the area should have these aggregated.
- How much new for-sale + rental construction is in the pipeline within 1–3 miles? Heavy new supply typically softens prices + rents 12–24 months out; constrained supply supports both.
Investment metrics
- 1% rule
- 0.80% ✗
- Cap rate
- 6.57%
- Cash-on-cash
- 0.99%
- DSCR
- 1.04
- GRM
- 10.4
CMA / ARV
- ARV (on-the-fly)
- $259,200
- Comps found
- 4
Show comp detail 4 sales within ~0.75 mi
| Address | Dist | Beds/Ba | Sqft | Sold | Price | $/sf | Match |
|---|---|---|---|---|---|---|---|
| 1525 197th St | 0.10mi | 2/1.0 | 952 (-12%) | 21mo | $125,500 | $132 | 54 |
| 20203 Crane Pl | 0.68mi | 3/2.0 (+1) | 1,120 (+4%) | 7mo | $235,000 | $210 | 51 |
| 1213 196th Pl | 0.17mi | 3/2.0 (+1) | 1,200 (+11%) | 23mo | $346,000 | $288 | 49 |
| 20205 Crane Pl | 0.68mi | 2/2.0 | 1,188 (+10%) | 14mo | $285,000 | $240 | 40 |
Match score weights: distance 35% · size 25% · config 20% · recency 20%. Top-matched comps best support the ARV.
Projected returns pro-forma
-3.0% appreciation · 3.0% rent growth · sell at horizon
- IRR
- -14.8%
- Equity multiple
- 0.47×
- Total profit
- $-48,008
- Equity at exit
- $48,459
- IRR
- -6.2%
- Equity multiple
- 0.60×
- Total profit
- $-36,156
- Equity at exit
- $28,100
Cash invested: $91,000 (down + closing). Projections, not guarantees.
Landlord ↔ Tenant lean methodology
- Overall (STATE)
- 28 Tenant-Leaning
- State Washington
- 28 Tenant-Leaning · D+8
- County
- — inherits STATE
- City
- — inherits STATE
ZIP-level market 98631
- Home prices YoY
- -17.6%
- Active inventory
- 122
- Price-to-rent
- 10.4×
Monthly cashflow live
- Estimated rent
- $2,600 medium interval (Pro) →
- Mortgage (P&I)
- −$1,704
- Tax from tax record
- −$139 /mo · $1,670/yr
- Insurance
- −$135
- HOA
- −$0
- Vacancy / Maint / Mgmt
- −$546
- Net cashflow
- $75
Break-even live
Sensitivity live
| Price | -10% $259 | -5% $167 | +0% $75 | +5% $-17 | +10% $-109 |
|---|---|---|---|---|---|
| Rent | -10% $-130 | -5% $-28 | +0% $75 | +5% $178 | +10% $280 |
| Rate | -1.0pp $239 | -0.5pp $158 | base $75 | +0.5pp $-9 | +1.0pp $-95 |
UW: 25.0% down · 7.5% · 30yr · 1.5% tax · 5.0% vac · 8.0% maint · 8.0% mgmt
Financing live
Cash to close
- Down payment
- $81,250
- Closing costs
- $9,750
- Reserves months
- —
- Total cash needed
- —
Loan-product check · same deal, 3 products live
Conventional
25% down · 7.5% · 30yr
- Down + closing
- —
- Monthly P&I
- —
- Monthly cashflow
- —
- DSCR
- —
- Eligible?
- —
Personal DTI + credit; lowest rate.
DSCR
20% down · 8.5% · 30yr
- Down + closing
- —
- Monthly P&I
- —
- Monthly cashflow
- —
- DSCR
- —
- Eligible?
- —
No personal income docs; deal must DSCR.
Hard money
10% down · 12.0% · 12mo
- Down + closing
- —
- Monthly P&I
- —
- Monthly cashflow
- —
- DSCR
- —
- Eligible?
- —
Short-term bridge; refi at stabilization.
Rent comps 1 comps
| Address | Beds | Baths | Sqft | Rent | $/sqft | DOM | Units | Dist |
|---|---|---|---|---|---|---|---|---|
| 1509 178th Pl Long Beach, WA | 2.0 | 1.0 | 896 | $2,600 | $2.90 | 45d | 1 | 1.00mi |
Listing history 14 events
-
2026-06-21days on market $325,000 Active 16 DOM
-
2026-06-21days on market $325,000 Active 15 DOM
-
2026-06-18days on market $325,000 Active 13 DOM
-
2026-06-17days on market $325,000 Active 12 DOM
-
2026-06-16days on market $325,000 Active 11 DOM
-
2026-06-15days on market $325,000 Active 10 DOM
-
2026-06-15days on market $325,000 Active 9 DOM
-
2026-06-13days on market $325,000 Active 8 DOM
-
2026-06-12days on market $325,000 Active 7 DOM
-
2026-06-09days on market $325,000 Active 4 DOM
-
2026-06-08days on market $325,000 Active 3 DOM
-
2026-06-08days on market $325,000 Active 2 DOM
-
2026-06-07remarks 699-char remark
-
2026-06-07$325,000 Active 1 DOM
ⓘ Source: listings_history table (triggers on properties + properties_extension) + one-shot
backfill from property_details.listing_events for pre-trigger history.
Tax reassessment forecast WA · Resets to sale price
- Current annual tax
- $1,670 · $139/mo
- Projected year-2 tax
- $3,185 · $265/mo
- Expected delta
- +$1,515/yr (+$126/mo · 90.7%)
ⓘ Screening estimate from a state-policy table — verify with the county assessor before closing.
Climate risk First Street
- Flood 1/10 Low FEMA zone X (unshaded) · 0% chance over 30 yrs
- Wildfire 2/10 Low
- Heat 1/10 Low 8 d/yr ≥74°F today · 17 d/yr by 30 yrs out
- Wind 1/10 Low
- Air quality 5/10 Major 6 unhealthy d/yr today · 6 by 30 yrs out
Nearby sold comps map
Loading sold comps map…
Walkable amenities ~0.75 mi
Loading nearby amenities…
Taxation est. · year 1
- Rental income
- $31,200
- − Mortgage interest
- −$18,205
- − Property taxes
- −$1,670
- − Insurance
- −$1,625
- − Repairs & maintenance
- −$2,496
- − Management
- −$2,496
- − Depreciation
- −$9,455
- Taxable loss
- −$4,747
- Est. tax savings @ 24.0%
- +$1,139
- After-tax cash flow
- $2,040/yr
For passive investors: Depreciation is non-cash, so a rental often shows a tax loss while cash-flowing — sheltering income. Rental losses are passive: they offset passive income freely, and up to $25,000/yr can offset ordinary (W-2) income if you actively participate and your MAGI is under $100k (phasing out to $0 by $150k); unused losses carry forward. On sale, claimed depreciation is recaptured at up to 25%, and gains may owe capital-gains tax (a 1031 exchange can defer both). Figures are a year-1 estimate at your 24.0% rate — not tax advice; consult a CPA.
Schools (NCES district)
- District
- Ocean Beach School District
- NCES district ID
- 5306060
- Math proficiency
- 34% ▼ -1.00%
- Reading proficiency
- 50% ▲ 1.00%
- Median HH income
- $38,549
- Composite
- 37.37/100
- National rank
- #8929
- State rank
- #212 of 291 in WA
Livability — Long Beach
- Score
- 78/100
- State rank
- #133
- US rank
- #2635
Category grades
Schools grade is shown separately in the Schools card above.
Census & demographics
- Population (ZIP)
- 3,468
Population outlook (Pacific County) Hauer SSP2
- Today (2025)
- 20,636 people
- By 2030
- 20,137 · -2.4%
- By 2040
- 19,041 · -7.7%
- By 2050
- 18,504 · -10.3%
- By 2075
- 17,403 · -15.7%
- By 2100
- 16,241 · -21.3%
Race, ethnicity, and origin ACS 2023
- Neighborhood character
- Predominantly White (81%)
- Race & ethnicity
- White 81% Hispanic / Latino 11% Two or more races 11% Asian 1%
- Hispanic origin (detail)
- Mexican 7% Puerto Rican 1%
- Common ancestry
- Portuguese 5% Slovak 5% Romanian 3%
- Foreign-born
- 5% · Canada, South Korea, Vietnam
- Languages at home
- 93% English-only · Spanish 6%
Political lean MEDSL · Pacific
- 2024 margin
- Toss-up / Even · D 48.1% · R 49.4% · Other 2.4%
- 2008→2024 swing
- -15.4pp toward R · 2008: 14.1pp · 2024: -1.3pp
- All cycles
- 2024: R+1.3 2020: R+1.1 2016: R+6.9 2012: D+11.4 2008: D+14.1
Not yet ingested
- Civics
- —
Market trends
- HPI YoY
- ▼ -51.26%
- Current HPI
- 240.5056
- Rent YoY
- —
- Metro
- —
- State GDP YoY
- ▲ 4.65%
- F500 in state
- 22
Industry mix (Fortune 500 HQ in WA)
| Industry | F500 HQs | Revenue |
|---|---|---|
| Retail | 2 | $269B |
|
||
| Technology / Retail | 1 | $638B |
|
||
| Technology | 1 | $245B |
|
||
| Telecommunications | 1 | $38B |
|
||
| Food / Beverage | 1 | $36B |
|
||
| Automotive / Trucks | 1 | $34B |
|
||
Price history
+333.3% since first listed17 events — show timeline
- 2026-06-05 Listed $325,000 NWMLS as Distributed by MLS Grid
- 2021-12-13 Sold (MLS) $255,000 NWMLS as Distributed by MLS Grid
- 2021-12-13 Sold (MLS) $255,000 RMLS
- 2021-10-12 Pending — NWMLS as Distributed by MLS Grid
- 2021-10-12 Pending — RMLS
- 2021-10-10 Price Changed $255,000 RMLS
- 2021-10-10 Relisted — RMLS
- 2021-10-06 Relisted — NWMLS as Distributed by MLS Grid
- 2021-09-13 Pending — RMLS
- 2021-09-08 Pending — NWMLS as Distributed by MLS Grid
- 2021-09-02 Listed $248,000 NWMLS as Distributed by MLS Grid
- 2021-09-02 Listed $248,000 RMLS
- 2016-04-27 Sold (Public Records) $120,000 Public Records
- 2016-04-27 Sold (MLS) $120,000 NWMLS as Distributed by MLS Grid
- 2016-03-05 Contingent — NWMLS as Distributed by MLS Grid
- 2015-12-14 Listed $125,000 NWMLS as Distributed by MLS Grid
- 2002-12-02 Sold (Public Records) $75,000 Public Records
Property tax history
+2.6%/yrLatest (2026): $1,670 · -11.8% YoY. Source: county tax records.
Cash-flow waterfall
monthlySold comps — $/sqft
last 12 mo · ≤1 miLoading sold comps…