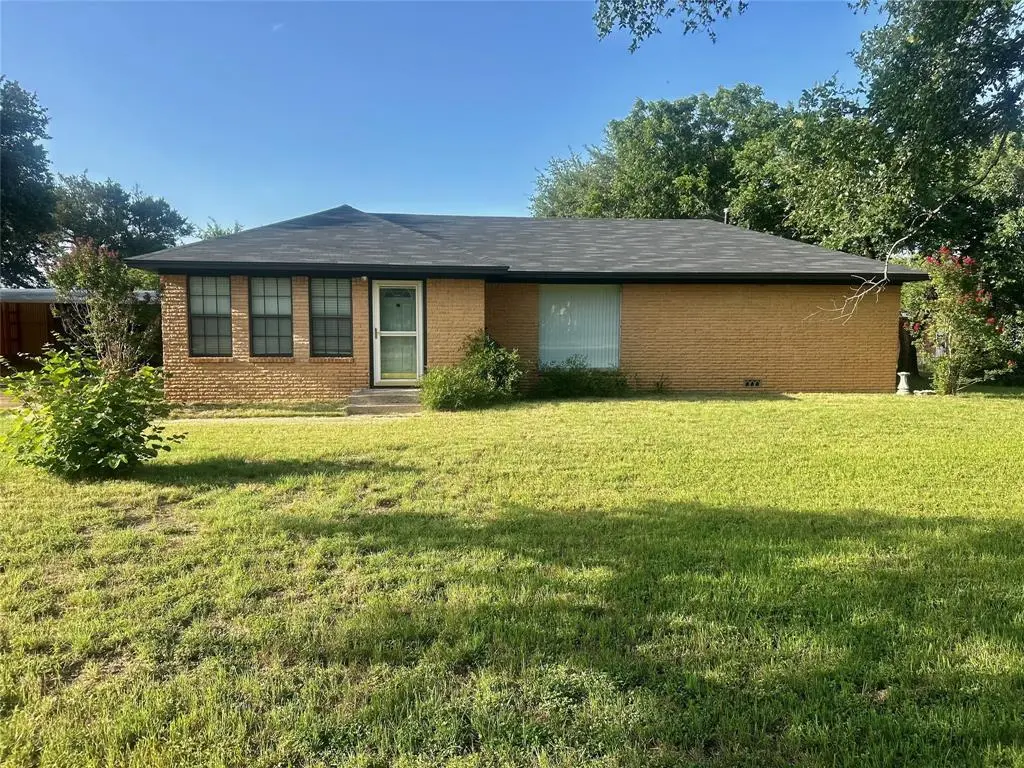
1121 E Coke · Hamilton, TX
Flood risk 1/10 · Minimal
- FEMA flood zone
- —
- Chance of flooding over 30 yrs
- 0.0%
- Est. flood insurance / yr
- —
Fire risk 6/10 · Moderate
- Est. fire insurance / yr
- $1,222 – $2,270
Heat risk 6/10 · Moderate
- Hot days now (above 105°F)
- 7 days/yr
- Hot days in 30 yrs
- 23 days/yr
Wind risk 6/10 · Moderate
- Chance of severe wind over 30 yrs
- 27.0%
Air-quality risk 1/10 · Minimal
- Unhealthy air days now
- 0 days/yr
- Unhealthy air days in 30 yrs
- 0 days/yr
Risk factors via First Street. Map © Google.
Why this score? — see what drove the D+ grade
The composite is a weighted blend of 9 inputs, each scored 0–100. Each bar is that input's sub-score; the figure is the points it added to the 100-point composite (weight × sub-score).
- ARV discount +10.7/15.0
- Appreciation +10.0/10.0
- Cash flow +9.9/30.0
- Schools +4.2/10.0
- Livability +3.7/5.0
- 1% rule +3.5/10.0
- DSCR +2.8/10.0
- Rent growth +2.5/5.0
- Condition / age +2.5/5.0
$165,000
🖨 Deal sheet 📄 Offer letter ✓ Due diligence
Listing remarks MLS
This newly remodeled home is a MUST SEE!!! It has 2 bedrooms and 1 bath. The living room boasts a large picture window that looks out to the street view. This home not only has new flooring, new hot water heater and fresh paint, it also has a new roof!!! There is a nice workroom storage area located off the carport.
Key facts
- Fresh paint
- New flooring
- New hot water heater
Tags
Neighborhood map
What this means for you Summary
Snapshot
- This is a 2-bed/1.0-bath single-family listed at $165k.
Deal economics
- At list price, monthly cash flow is $-104 ($-1k/yr) — negative.
- To cash-flow at today's rent, offer at most $147k (11.1% below list).
- To meet the 1% rule (rent ≥ 1% of price), the offer needs to be $140k (15.5% below list).
- Recommended offer: $140k (15.5% below list) — sets the bar for 1% rule.
- Cap rate 5.5% vs local median 2.9% in Hamilton — top-decile yield for the area; either an underpriced asset or a hidden risk that comps aren't pricing in. Stress-test before assuming the spread holds.
Location & tenants
- Location reads 73/100 on livability (#210 in TX) — a middle-class / working-renter tenant base. Strengths: cost of living A+, housing A+, health & safety A+; Watch: schools C-, employment D, amenities F.
- Hamilton ISD (town): math 50% / reading 50% proficiency, ranked #192 of 826 in TX (top 23%) — acceptable for families but not a draw, mixed tenant base, ~2y average lease.
- Market conditions: 117 active listings in the ZIP; 1 comparable units currently listed for rent nearby; 24 units permitted in Hamilton County in 2024 (0 in 5+ unit buildings).
Forward outlook
- In year one you build about $18k of equity ($1k loan paydown + $16k appreciation (10.0% local appreciation)).
- Hamilton County population projected at -21% by 2050 — secular population decline; favor cash flow + early exit over multi-decade hold.
- By year 3, paydown + projected appreciation supports a ~$45k cash-out refi (75% LTV) — recoverable capital for the next deal without selling this one.
Negotiation context
- It's been on market 163 days — a 12% lower offer ($145k) is reasonable based on typical stale-listing flexibility.
- 2 sale attempts; this cycle's ask has dropped $10k (6%) from the opening price — seller is motivated, your offer sets the floor, not the list.
Risks & watch-outs
- Climate carrying-cost: major wind risk, 27% chance of damaging wind over 30y; major wildfire risk; extreme-heat days projected 7→23/yr by 2055 (HVAC capex compounding) — expect insurance premiums to compound above CPI over the hold.
Questions for the listing agent
- What do current leases actually rent for vs. the listed asking? Can we see a recent rent roll and the last 12 months of T-12 income?
- It's been on market 163 days. Have you received any prior offers? Is the seller open to a 15% concession, seller financing, or rate buy-down credit?
- Built in 1960 — when were the roof, HVAC, electrical panel, plumbing, and water heater last replaced?
- Why hasn't it sold? Are there any deal-killer items the seller is aware of (foundation, flood, title, zoning, code violations)?
- Is there a deadline driving the sale (1031 exchange, divorce, estate, relocation)? That informs how much negotiation room exists.
- The area grade is low — what's the realistic commute time and amenity access for the typical tenant pool here? Any planned neighborhood developments (good or bad) we should know about?
- What's the average days-on-market for RENTAL listings here right now (not sales)? A rising rental-DOM trend means longer vacancies and softer asking-rent achievability than the comps imply.
- What's the recent tenant-quality profile in this submarket — average credit score on applications, eviction rate, late-payment / NSF rate, and stable-employment percentage? A property-management company in the area should have these aggregated.
- How much new for-sale + rental construction is in the pipeline within 1–3 miles? Heavy new supply typically softens prices + rents 12–24 months out; constrained supply supports both.
Investment metrics
- 1% rule
- 0.85% ✗
- Cap rate
- 5.54%
- Cash-on-cash
- -2.69%
- DSCR
- 0.88
- GRM
- 9.9
CMA / ARV
- ARV (median comp)
- $177,721
- List price
- $165,000
- Delta
- -7.16%
- Verdict
- FAIR
- Comps
- 20 within 1.0 mi
Show comp detail 8 sales within ~0.75 mi
| Address | Dist | Beds/Ba | Sqft | Sold | Price | $/sf | Match |
|---|---|---|---|---|---|---|---|
| 402 S Williams St | 0.05mi | 2/2.0 | 1,352 (+0%) | 10mo | $225,000 | $166 | 85 |
| 1202 Oak Ridge Ln | 0.10mi | 3/1.5 (+1) | 1,239 (-8%) | 8mo | $160,000 | $129 | 68 |
| 1006 E Coke St | 0.18mi | 2/2.0 | 1,500 (+11%) | 2mo | $189,000 | $126 | 67 |
| 405 S Bouldin St | 0.37mi | 3/2.0 (+1) | 1,388 (+3%) | 4mo | $239,000 | $172 | 65 |
| 605 S Wieser St | 0.31mi | 3/2.0 (+1) | 1,413 (+5%) | 16mo | $225,000 | $159 | 55 |
| 818 E Boynton | 0.40mi | 2/2.0 | 1,266 (-6%) | 23mo | $150,000 | $118 | 48 |
| 604 E Gentry | 0.58mi | 3/1.0 (+1) | 1,215 (-10%) | 5mo | $125,000 | $103 | 47 |
| 303 S Lloyd St | 0.59mi | 3/2.0 (+1) | 1,458 (+8%) | 5mo | $105,000 | $72 | 46 |
Match score weights: distance 35% · size 25% · config 20% · recency 20%. Top-matched comps best support the ARV.
Projected returns pro-forma
10.0% appreciation · 3.0% rent growth · sell at horizon
- IRR
- 22.4%
- Equity multiple
- 2.80×
- Total profit
- $83,325
- Equity at exit
- $148,645
- IRR
- 20.1%
- Equity multiple
- 6.43×
- Total profit
- $250,690
- Equity at exit
- $320,559
Cash invested: $46,200 (down + closing). Projections, not guarantees.
Landlord ↔ Tenant lean methodology
- Overall (STATE)
- 87 Strongly Landlord-Friendly
- State Texas
- 87 Strongly Landlord-Friendly · R+5
- County
- — inherits STATE
- City
- — inherits STATE
ZIP-level market 76531
- Home prices YoY
- 17.5%
- Active inventory
- 117
- Price-to-rent
- 9.9×
Monthly cashflow live
- Estimated rent
- $1,395 medium interval (Pro) →
- Mortgage (P&I)
- −$865
- Tax from tax record
- −$272 /mo · $3,260/yr
- Insurance
- −$69
- HOA
- −$0
- Vacancy / Maint / Mgmt
- −$293
- Net cashflow
- $-104
Break-even live
UW: 25.0% down · 7.5% · 30yr · 1.5% tax · 5.0% vac · 8.0% maint · 8.0% mgmt
Financing live
Cash to close
- Down payment
- $41,250
- Closing costs
- $4,950
- Reserves months
- —
- Total cash needed
- —
Loan-product check · same deal, 3 products live
Conventional
25% down · 7.5% · 30yr
- Down + closing
- —
- Monthly P&I
- —
- Monthly cashflow
- —
- DSCR
- —
- Eligible?
- —
Personal DTI + credit; lowest rate.
DSCR
20% down · 8.5% · 30yr
- Down + closing
- —
- Monthly P&I
- —
- Monthly cashflow
- —
- DSCR
- —
- Eligible?
- —
No personal income docs; deal must DSCR.
Hard money
10% down · 12.0% · 12mo
- Down + closing
- —
- Monthly P&I
- —
- Monthly cashflow
- —
- DSCR
- —
- Eligible?
- —
Short-term bridge; refi at stabilization.
Rent comps 1 comps
| Address | Beds | Baths | Sqft | Rent | $/sqft | DOM | Units | Dist |
|---|---|---|---|---|---|---|---|---|
| 1115 E Ross St Hamilton, TX | 3.0 | 2.0 | 1341 | $1,395 | $1.04 | 13d | 1 | 0.25mi |
Listing history 21 events
-
2026-06-18days on market $165,000 Active 163 DOM
-
2026-06-17days on market $165,000 Active 162 DOM
-
2026-06-16days on market $165,000 Active 161 DOM
-
2026-06-15days on market $165,000 Active 160 DOM
-
2026-06-13days on market $165,000 Active 158 DOM
-
2026-06-12days on market $165,000 Active 157 DOM
-
2026-06-09days on market $165,000 Active 154 DOM
-
2026-06-08days on market $165,000 Active 153 DOM
-
2026-06-08days on market $165,000 Active 152 DOM
-
2026-06-05days on market $165,000 Active 150 DOM
-
2026-06-03days on market $165,000 Active 148 DOM
-
2026-06-02days on market $165,000 Active 147 DOM
-
2026-06-01days on market $165,000 Active 146 DOM
-
2026-05-31days on market $165,000 Active 145 DOM
-
2026-02-27price $165,000 318-char remark
Show marketing remark (318 chars)
This newly remodeled home is a MUST SEE!!! It has 2 bedrooms and 1 bath. The living room boasts a large picture window that looks out to the street view. This home not only has new flooring, new hot water heater and fresh paint, it also has a new roof!!! There is a nice workroom storage area located off the carport.
-
2026-01-06$175,000 Active 318-char remark
Show marketing remark (318 chars)
This newly remodeled home is a MUST SEE!!! It has 2 bedrooms and 1 bath. The living room boasts a large picture window that looks out to the street view. This home not only has new flooring, new hot water heater and fresh paint, it also has a new roof!!! There is a nice workroom storage area located off the carport.
-
2026-01-02historical
-
2025-12-02price $175,000
-
2025-07-02$180,000 Active
-
2024-08-21soldstatus
-
1998-08-12soldstatus
ⓘ Source: listings_history table (triggers on properties + properties_extension) + one-shot
backfill from property_details.listing_events for pre-trigger history.
Tax reassessment forecast TX · Resets to sale price
- Current annual tax
- $3,260 · $272/mo
- Projected year-2 tax
- $3,260 · $272/mo
- Expected delta
- $0/yr ($0/mo · 0.0%)
ⓘ Screening estimate from a state-policy table — verify with the county assessor before closing.
Climate risk First Street
- Flood 1/10 Low 0% chance over 30 yrs
- Wildfire 6/10 Major
- Heat 6/10 Major 7 d/yr ≥105°F today · 23 d/yr by 30 yrs out
- Wind 6/10 Major 27% chance of damaging wind over 30 yrs
- Air quality 1/10 Low 0 unhealthy d/yr today · 0 by 30 yrs out
Nearby sold comps map
Loading sold comps map…
Walkable amenities ~0.75 mi
Loading nearby amenities…
Taxation est. · year 1
- Rental income
- $16,740
- − Mortgage interest
- −$9,243
- − Property taxes
- −$3,260
- − Insurance
- −$825
- − Repairs & maintenance
- −$1,339
- − Management
- −$1,339
- − Depreciation
- −$4,800
- Taxable loss
- −$4,066
- Est. tax savings @ 24.0%
- +$976
- After-tax cash flow
- $-268/yr
For passive investors: Depreciation is non-cash, so a rental often shows a tax loss while cash-flowing — sheltering income. Rental losses are passive: they offset passive income freely, and up to $25,000/yr can offset ordinary (W-2) income if you actively participate and your MAGI is under $100k (phasing out to $0 by $150k); unused losses carry forward. On sale, claimed depreciation is recaptured at up to 25%, and gains may owe capital-gains tax (a 1031 exchange can defer both). Figures are a year-1 estimate at your 24.0% rate — not tax advice; consult a CPA.
Schools (NCES district)
- District
- Hamilton ISD
- NCES district ID
- 4822230
- Math proficiency
- 50% ▲ 1.00%
- Reading proficiency
- 50% ▼ -1.00%
- Median HH income
- $43,597
- Composite
- 42.18/100
- National rank
- #3293
- State rank
- #192 of 826 in TX
Livability — Hamilton
- Score
- 73/100
- State rank
- #210
- US rank
- #5259
Category grades
Schools grade is shown separately in the Schools card above.
Census & demographics
- Census place
- Hamilton, TX
- Population (ZIP)
- 4,673
Population outlook (Hamilton County) Hauer SSP2
- Today (2025)
- 7,553 people
- By 2030
- 7,212 · -4.5%
- By 2040
- 6,566 · -13.1%
- By 2050
- 5,976 · -20.9%
- By 2075
- 5,077 · -32.8%
- By 2100
- 4,196 · -44.4%
Race, ethnicity, and origin ACS 2023
- Neighborhood character
- Predominantly White (84%)
- Race & ethnicity
- White 84% Hispanic / Latino 13% Two or more races 11% Black 1%
- Hispanic origin (detail)
- Mexican 12%
- Common ancestry
- Italian 9% Lithuanian 3% Slovak 2%
- Foreign-born
- 5% · Canada
- Languages at home
- 90% English-only · Spanish 9% Russian/Polish/Slavic 1%
Political lean MEDSL · Hamilton
- 2024 margin
- Solid R (+71.3) · D 14.0% · R 85.3%
- 2008→2024 swing
- -18.0pp toward R · 2008: -53.3pp · 2024: -71.3pp
- All cycles
- 2024: R+71.3 2020: R+68.4 2016: R+71.4 2012: R+65.5 2008: R+53.3
Not yet ingested
- Civics
- —
Market trends
- HPI YoY
- ▲ 33.83%
- Current HPI
- 226.8273
- Rent YoY
- —
- Metro
- —
- State GDP YoY
- ▲ 3.95%
- F500 in state
- 110
Industry mix (Fortune 500 HQ in TX)
| Industry | F500 HQs | Revenue |
|---|---|---|
| Energy | 16 | $1,198B |
|
||
| Technology | 5 | $198B |
|
||
| Engineering / Construction | 4 | $72B |
|
||
| Energy Services | 3 | $60B |
|
||
| Utilities | 3 | $41B |
|
||
| Healthcare | 2 | $330B |
|
||
Price history
-8.3% since first listed7 events — show timeline
- 2026-02-27 Price Changed $165,000 NTREIS
- 2026-01-06 Listed $175,000 NTREIS
- 2026-01-02 Listing Removed — NTREIS
- 2025-12-02 Price Changed $175,000 NTREIS
- 2025-07-02 Listed $180,000 NTREIS
- 2024-08-21 Sold (Public Records) — Public Records
- 1998-08-12 Sold (Public Records) — Public Records
Property tax history
+6.2%/yrLatest (2025): $3,260 · +14.0% YoY. Source: county tax records.
Cash-flow waterfall
monthlySold comps — $/sqft
last 12 mo · ≤1 miLoading sold comps…