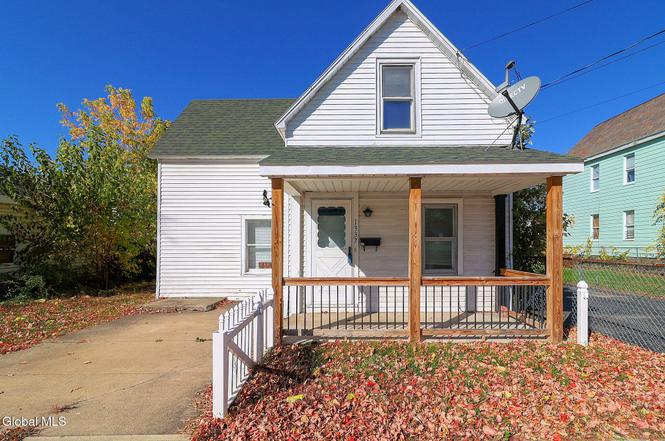
1337 8th Ave · Schenectady, NY
Flood risk 1/10 · Minimal
- FEMA flood zone
- X (unshaded)
- Chance of flooding over 30 yrs
- 0.0%
- Est. flood insurance / yr
- $473 – $860
Fire risk 3/10 · Minor
- Est. fire insurance / yr
- $691 – $1,283
Heat risk 4/10 · Minor
- Hot days now (above 96°F)
- 7 days/yr
- Hot days in 30 yrs
- 16 days/yr
Wind risk 2/10 · Minimal
- Chance of severe wind over 30 yrs
- 4.0%
Air-quality risk 1/10 · Minimal
- Unhealthy air days now
- 0 days/yr
- Unhealthy air days in 30 yrs
- 0 days/yr
Risk factors via First Street. Map © Google.
Why this score? — see what drove the C grade
The composite is a weighted blend of 9 inputs, each scored 0–100. Each bar is that input's sub-score; the figure is the points it added to the 100-point composite (weight × sub-score).
- Cash flow +19.7/30.0
- ARV discount +15.0/15.0
- DSCR +6.3/10.0
- 1% rule +5.5/10.0
- Livability +3.9/5.0
- Schools +3.0/10.0
- Rent growth +2.5/5.0
- Condition / age +2.5/5.0
- Appreciation +0.0/10.0
$150,000
🖨 Deal sheet 📄 Offer letter ✓ Due diligence
Listing remarks
Motivated seller. Centrally located in Schenectady close to 890, downtown Schenectady, Rivers Casino & Union college. Close to all shopping & bus lines. Sold as is. Owner is flexible. Large backyard. Unfinished basement.
Key facts
- Centrally located
- Large backyard
- Unfinished basement
Tags
Neighborhood map
What this means for you Summary
Snapshot
- This is a 3-bed/2.0-bath single-family listed at $150k.
Deal economics
- At list price, monthly cash flow is $177 ($2k/yr) — positive.
- The deal already cash-flows at list — no discount required.
- Meets the 1% rule at list price ($2k rent vs $150k).
- Recommended offer: $132k (12.0% below list) — sets the bar for market timing.
- Cap rate 7.7% vs local median 6.3% in Schenectady — meaningfully above typical; check what's discounted (condition, days-on-market, listing class) to confirm the premium yield is real.
Location & tenants
- Location reads 78/100 on livability (#167 in NY, #2,597 nationally) — a middle-class / working-renter tenant base. Strengths: commute A+, health & safety A+, cost of living A; Watch: employment D+, crime F.
- Schenectady City School District (urban): math 38% / reading 34% proficiency, ranked #556 of 590 in NY (top 94%) — families likely to look elsewhere, expect single-tenant / working-renter base with shorter leases; 65% free/reduced lunch — lower-income household profile, screen leases tightly.
- Zoned schools: Hamilton Elementary School (math 15% / reading 24%, grade F, #1,972 of 2,108 statewide, top 94%, 419 students, 0% FRL); Schenectady High School (math 75% / reading 90%, grade A, #446 of 1,100 statewide, top 41%, 2,743 students, 71% FRL) — zoned schools average 35% FRL vs 65% district-wide (30 pts lower); this property's tenant base skews higher-income than the district average.
- Zoned-school proficiency averages 51% at this address vs 36% district-wide (+15 pts) — the actual schools serving this property are materially stronger than the Schenectady City School District average implies; a family-tenant draw the district grade alone would hide.
- Market conditions: 161 active listings in the ZIP; 15 comparable units currently listed for rent nearby; rentals at typical pace (median 15d on market — plan ~3-4 weeks tenant-placement turnaround); solid renter incomes; 154 units permitted in Schenectady County in 2024 (54 in 5+ unit buildings).
Forward outlook
- Local home prices are declining (-3.0%/yr); year-one equity from $1k of loan paydown is wiped out by about $4k of value loss. Plan a longer hold.
- Schenectady County population projected to shrink 4% by 2050 — rents likely to lag national; underwrite the cash flow, not the appreciation.
Negotiation context
- It's been on market 134 days — a 12% lower offer ($132k) is reasonable based on typical stale-listing flexibility.
- 2 sale attempts; this cycle's ask has dropped $65k (30%) from the opening price — seller is motivated, your offer sets the floor, not the list.
Risks & watch-outs
- Watch-outs: built in 1890 — expect roof / HVAC / electrical / plumbing capex.
Questions for the listing agent
- It's been on market 134 days. Have you received any prior offers? Is the seller open to a 12% concession, seller financing, or rate buy-down credit?
- Built in 1890 — when were the roof, HVAC, electrical panel, plumbing, and water heater last replaced?
- Why hasn't it sold? Are there any deal-killer items the seller is aware of (foundation, flood, title, zoning, code violations)?
- Is there a deadline driving the sale (1031 exchange, divorce, estate, relocation)? That informs how much negotiation room exists.
- Crime grade is F in this area — have there been break-ins, vandalism, or insurance claims at this property in the last 3 years? What carrier currently insures it and at what premium?
- What's the average days-on-market for RENTAL listings here right now (not sales)? A rising rental-DOM trend means longer vacancies and softer asking-rent achievability than the comps imply.
- What's the recent tenant-quality profile in this submarket — average credit score on applications, eviction rate, late-payment / NSF rate, and stable-employment percentage? A property-management company in the area should have these aggregated.
- How much new for-sale + rental construction is in the pipeline within 1–3 miles? Heavy new supply typically softens prices + rents 12–24 months out; constrained supply supports both.
Investment metrics
- 1% rule
- 1.05% ✓
- Cap rate
- 7.71%
- Cash-on-cash
- 5.06%
- DSCR
- 1.23
- GRM
- 7.9
CMA / ARV
- ARV (on-the-fly)
- $225,477
- Comps found
- 12
Show comp detail 12 sales within ~0.75 mi
| Address | Dist | Beds/Ba | Sqft | Sold | Price | $/sf | Match |
|---|---|---|---|---|---|---|---|
| 1337 8th Ave | 0.00mi | 4/2.0 (+1) | 1,193 (0%) | 1mo | $132,500 | $111 | 94 |
| 1084 Webster St | 0.12mi | 3/2.0 | 1,282 (+8%) | 2mo | $230,000 | $179 | 80 |
| 1133 Cutler St | 0.09mi | 4/1.0 (+1) | 1,142 (-4%) | 3mo | $190,000 | $166 | 78 |
| 818 Cutler St | 0.40mi | 3/1.5 | 1,224 (+3%) | 0mo | $165,000 | $135 | 75 |
| 1114 Forest Rd | 0.52mi | 3/1.0 | 1,152 (-3%) | 0mo | $218,000 | $189 | 66 |
| 1067 Cutler St | 0.15mi | 2/1.5 (-1) | 1,352 (+13%) | 2mo | $100,000 | $74 | 62 |
| 1020 Pearl St | 0.38mi | 2/1.5 (-1) | 1,295 (+8%) | 0mo | $152,500 | $118 | 61 |
| 1201 Helderberg Ave Ave | 0.56mi | 3/2.0 | 1,271 (+6%) | 2mo | $252,000 | $198 | 61 |
| 1221 Houlton Ave | 0.58mi | 3/1.0 | 1,232 (+3%) | 5mo | $245,000 | $199 | 60 |
| 1880 Broad St | 0.41mi | 4/1.0 (+1) | 1,255 (+5%) | 5mo | $278,000 | $222 | 59 |
| 1420 Nelson St | 0.32mi | 3/1.0 | 1,057 (-11%) | 4mo | $230,000 | $218 | 58 |
| 2112 Gray St | 0.70mi | 3/1.0 | 1,340 (+12%) | 4mo | $277,650 | $207 | 39 |
Match score weights: distance 35% · size 25% · config 20% · recency 20%. Top-matched comps best support the ARV.
Projected returns pro-forma
-3.0% appreciation · 3.0% rent growth · sell at horizon
- IRR
- -8.4%
- Equity multiple
- 0.69×
- Total profit
- $-12,988
- Equity at exit
- $22,365
- IRR
- 1.1%
- Equity multiple
- 1.08×
- Total profit
- $3,386
- Equity at exit
- $12,969
Cash invested: $42,000 (down + closing). Projections, not guarantees.
Landlord ↔ Tenant lean methodology
- Overall (STATE)
- 15 Strongly Tenant-Friendly
- State New York
- 15 Strongly Tenant-Friendly · D+10
- County
- — inherits STATE
- City
- — inherits STATE
ZIP-level market 12303
- Active inventory
- 161
- Price-to-rent
- 7.9×
Monthly cashflow live
- Estimated rent
- $1,577 high interval (Pro) →
- Mortgage (P&I)
- −$787
- Tax from tax record
- −$220 /mo · $2,639/yr
- Insurance
- −$62
- HOA
- −$0
- Vacancy / Maint / Mgmt
- −$331
- Net cashflow
- $177
Break-even live
UW: 25.0% down · 7.5% · 30yr · 1.5% tax · 5.0% vac · 8.0% maint · 8.0% mgmt
Financing live
Cash to close
- Down payment
- $37,500
- Closing costs
- $4,500
- Reserves months
- —
- Total cash needed
- —
Loan-product check · same deal, 3 products live
Conventional
25% down · 7.5% · 30yr
- Down + closing
- —
- Monthly P&I
- —
- Monthly cashflow
- —
- DSCR
- —
- Eligible?
- —
Personal DTI + credit; lowest rate.
DSCR
20% down · 8.5% · 30yr
- Down + closing
- —
- Monthly P&I
- —
- Monthly cashflow
- —
- DSCR
- —
- Eligible?
- —
No personal income docs; deal must DSCR.
Hard money
10% down · 12.0% · 12mo
- Down + closing
- —
- Monthly P&I
- —
- Monthly cashflow
- —
- DSCR
- —
- Eligible?
- —
Short-term bridge; refi at stabilization.
Rent comps 15 comps
| Address | Beds | Baths | Sqft | Rent | $/sqft | DOM | Units | Dist |
|---|---|---|---|---|---|---|---|---|
| 1130 Pleasant St Schenectady, NY | 2.0 | 1.0 | 1069 | $1,300 | $1.22 | 44d | 1 | 0.11mi |
| 1120 Pleasant St Schenectady, NY | 3.0 | 1.0 | 1000 | $1,500 | $1.50 | 14d | 1 | 0.12mi |
| 1121 10th Ave Schenectady, NY | 2.0 | 1.0 | 800 | $1,250 | $1.56 | 23d | 1 | 0.32mi |
| 418 Third St Schenectady, NY | 3.0 | 1.0 | 1000 | $2,200 | $2.20 | 14d | 1 | 0.74mi |
| 2030 Euclid Ave Schenectady, NY | 3.0 | 1.0 | 1300 | $2,000 | $1.54 | 19d | 1 | 0.75mi |
| 1826 Campbell Ave Schenectady, NY | 3.0 | 1.0 | 1000 | $1,600 | $1.60 | 14d | 1 | 0.78mi |
| 918 Delamont Ave Schenectady, NY | 3.0 | 1.0 | 1192 | $1,600 | $1.34 | 23d | 1 | 0.87mi |
| 2007 Campbell Ave Schenectady, NY | 3.0 | 1.0 | 1272 | $1,600 | $1.26 | 14d | 1 | 0.88mi |
| 1729 Ferguson St Schenectady, NY | 2.0 | 1.0 | 850 | $1,730 | $2.04 | 14d | 1 | 0.99mi |
| 922 State St Schenectady, NY | 1.0–2.0 | 1.0 | 855 | $1,390 | $1.63 | 14d | 6 | 1.14mi |
| 611 Cramer Ave Schenectady, NY | 3.0 | 1.0 | 1100 | $2,295 | $2.09 | 14d | 1 | 1.24mi |
| 23 Hawk St Schenectady, NY | 2.0 | 1.0 | 920 | $1,500 | $1.63 | 19d | 1 | 1.28mi |
| 117 Washington Ave Schenectady, NY | 2.0–4.0 | 1.0–2.0 | 1033 | $1,515 | $1.47 | 14d | 9 | 1.31mi |
| 409 State St Schenectady, NY | 2.0 | 1.0 | 1000 | $1,200 | $1.20 | 19d | 1 | 1.34mi |
| 13 State St Schenectady, NY | 1.0–2.0 | 1.0 | 923 | $1,768 | $1.92 | 14d | 1 | 1.43mi |
Listing history 6 events
-
2026-04-01status Pending
-
2026-02-16status Active
-
2026-02-16price $150,000
-
2026-01-20status Pending
-
2025-11-21price $175,000
-
2025-10-22$215,000 Active
ⓘ Source: listings_history table (triggers on properties + properties_extension) + one-shot
backfill from property_details.listing_events for pre-trigger history.
Tax reassessment forecast NY · Partial reset (capped growth)
- Current annual tax
- $2,639 · $220/mo
- Projected year-2 tax
- $2,639 · $220/mo
- Expected delta
- $0/yr ($0/mo · 0.0%)
ⓘ Screening estimate from a state-policy table — verify with the county assessor before closing.
Climate risk First Street
- Flood 1/10 Low FEMA zone X (unshaded) · 0% chance over 30 yrs
- Wildfire 3/10 Moderate
- Heat 4/10 Moderate 7 d/yr ≥96°F today · 16 d/yr by 30 yrs out
- Wind 2/10 Low 4% chance of damaging wind over 30 yrs
- Air quality 1/10 Low 0 unhealthy d/yr today · 0 by 30 yrs out
Nearby sold comps map
Loading sold comps map…
Walkable amenities ~0.75 mi
Loading nearby amenities…
Taxation est. · year 1
- Rental income
- $18,927
- − Mortgage interest
- −$8,402
- − Property taxes
- −$2,639
- − Insurance
- −$750
- − Repairs & maintenance
- −$1,514
- − Management
- −$1,514
- − Depreciation
- −$4,364
- Taxable loss
- −$256
- Est. tax savings @ 24.0%
- +$61
- After-tax cash flow
- $2,186/yr
For passive investors: Depreciation is non-cash, so a rental often shows a tax loss while cash-flowing — sheltering income. Rental losses are passive: they offset passive income freely, and up to $25,000/yr can offset ordinary (W-2) income if you actively participate and your MAGI is under $100k (phasing out to $0 by $150k); unused losses carry forward. On sale, claimed depreciation is recaptured at up to 25%, and gains may owe capital-gains tax (a 1031 exchange can defer both). Figures are a year-1 estimate at your 24.0% rate — not tax advice; consult a CPA.
Schools (NCES district)
- District
- Schenectady City School District
- NCES district ID
- 3626010
- Math proficiency
- 38% ▲ 12.00%
- Reading proficiency
- 34% ▲ 2.00%
- Median HH income
- $39,453
- Composite
- 30.2/100
- National rank
- #6309
- State rank
- #556 of 590 in NY
Livability — Schenectady
- Score
- 78/100
- State rank
- #167
- US rank
- #2597
Category grades
Schools grade is shown separately in the Schools card above.
Census & demographics
- Census place
- Schenectady, NY
- County
- Schenectady County · 141,369 people
- City population
- 141,369
- Metro
- Albany-Schenectady-Troy, NY
- Population (ZIP)
- 29,360
- Household income
- $84,375
- Rent vs Own
- Severe rent burden
- 1318.0
Population outlook (Schenectady County) Hauer SSP2
- Today (2025)
- 155,046 people
- By 2030
- 154,322 · -0.5%
- By 2040
- 151,796 · -2.1%
- By 2050
- 148,621 · -4.1%
- By 2075
- 141,229 · -8.9%
- By 2100
- 126,014 · -18.7%
Race, ethnicity, and origin ACS 2023
- Neighborhood character
- Predominantly White (66%)
- Race & ethnicity
- White 66% Two or more races 11% Black 10% Hispanic / Latino 9% Asian 4%
- Hispanic origin (detail)
- Mexican 1% Puerto Rican 5%
- Common ancestry
- Romanian 6% Lithuanian 3% Iranian 2%
- Foreign-born
- 10% · Canada, China
- Languages at home
- 90% English-only · Spanish 6% Other Indo-European 2% Chinese 1%
Political lean MEDSL · Schenectady
- 2024 margin
- D (+10.8) · D 55.4% · R 44.6%
- 2008→2024 swing
- -1.8pp toward R · 2008: 12.7pp · 2024: 10.8pp
- All cycles
- 2024: D+10.8 2020: D+15.7 2016: D+5.8 2012: D+15.4 2008: D+12.7
Not yet ingested
- Civics
- —
Market trends
- HPI YoY
- ▼ -151.01%
- Current HPI
- 280.3886
- Rent YoY
- —
- Metro
- Albany-Schenectady-Troy, NY
- State GDP YoY
- ▲ 2.60%
- F500 in state
- 92
Industry mix (Fortune 500 HQ in NY)
| Industry | F500 HQs | Revenue |
|---|---|---|
| Financial Services | 10 | $950B |
|
||
| Consumer Goods | 9 | $162B |
|
||
| Insurance | 4 | $225B |
|
||
| Telecommunications | 2 | $144B |
|
||
| Pharmaceuticals | 2 | $112B |
|
||
| Media / Entertainment | 2 | $69B |
|
||
Price history
-30.2% since first listed6 events — show timeline
- 2026-04-01 Pending — Global MLS
- 2026-02-16 Relisted — Global MLS
- 2026-02-16 Price Changed $150,000 Global MLS
- 2026-01-20 Pending — Global MLS
- 2025-11-21 Price Changed $175,000 Global MLS
- 2025-10-22 Listed $215,000 Global MLS
Property tax history
+0.8%/yrLatest (2025): $2,639 · +4.7% YoY. Source: county tax records.
Cash-flow waterfall
monthlySold comps — $/sqft
last 12 mo · ≤1 miLoading sold comps…