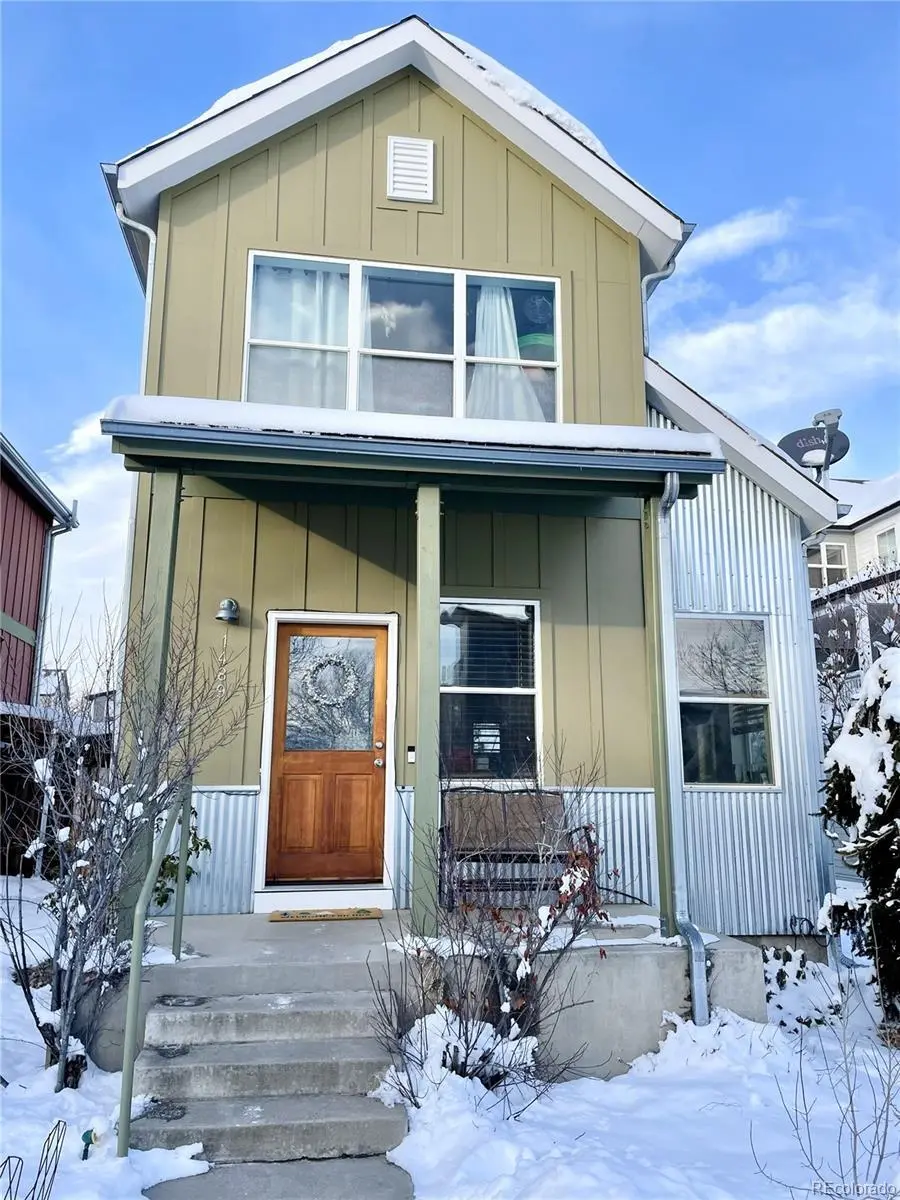
1489 Zamia Ave · Boulder, CO
Flood risk 1/10 · Minimal
- FEMA flood zone
- X (unshaded)
- Chance of flooding over 30 yrs
- 0.0%
- Est. flood insurance / yr
- $507 – $1,088
Fire risk 8/10 · Major
- Est. fire insurance / yr
- $939 – $1,743
Heat risk 3/10 · Minor
- Hot days now (above 92°F)
- 7 days/yr
- Hot days in 30 yrs
- 18 days/yr
Wind risk 1/10 · Minimal
- Chance of severe wind over 30 yrs
- —
Air-quality risk 2/10 · Minimal
- Unhealthy air days now
- 1 days/yr
- Unhealthy air days in 30 yrs
- 1 days/yr
Risk factors via First Street. Map © Google.
Why this score? — see what drove the C- grade
The composite is a weighted blend of 9 inputs, each scored 0–100. Each bar is that input's sub-score; the figure is the points it added to the 100-point composite (weight × sub-score).
- Cash flow +19.2/30.0
- ARV discount +7.5/15.0
- DSCR +6.1/10.0
- Schools +5.1/10.0
- 1% rule +4.3/10.0
- Livability +3.9/5.0
- Rent growth +3.0/5.0
- Condition / age +2.5/5.0
- Appreciation +0.0/10.0
$312,205
🖨 Deal sheet 📄 Offer letter ✓ Due diligence
Listing remarks MLS
**Boulder Homeownership Program** Welcome to the colorful Holiday Park neighborhood in North Boulder. This inviting home features a freshly painted exterior, a bright main-level open floor plan, new carpet, newer flooring, and abundant natural light. A front-facing bedroom offers beautiful views of the Flatirons and Bear Peak. The home includes an unfinished basement that provides excellent storage space and flexibility for use as a workout area, hobby space, or additional storage. The washer and dryer are approximately five years old, and the furnace was replaced in 2018. Outside, the fenced backyard offers private outdoor space with a storage structure that is great for bicycles, tools, and seasonal items. The yard also includes peach and plum trees, adding character and charm to the property. The Holiday Park neighborhood is known for its colorful homes, community feel, and convenient North Boulder location. Close to coffee shops, restaurants, bakeries, a brewery, and the new North Boulder Library, with easy access to nearby recreation, parks, trails, bus lines, and other neighborhood amenities.
Key facts
- Unfinished basement
- Peach and plum trees
- Fenced backyard
Tags
Property features AI
Finance
- Financial info: Property is a single-unit residential condominium
- HOA & community: HOA present (Holiday Neigborhood Association), professionally managed; HOA fee $33 per month ($396 annually); Pets allowed
Exterior
- Parking: Brick driveway
- Security: Smoke detectors; Video doorbell
- Utilities: Public water; Public sewer
- Home design: Residential condominium; Low-rise (1-3) building; Two levels with entry on level 1; Unit faces south; Individually owned
- Construction: Frame construction; Other roof type; Unfinished below-grade area (basement present)
- Exterior features: Private yard; Patio; Brick driveway
Interior
- Kitchen: Dishwasher; Disposal; Refrigerator
- Bedrooms: 2 bedrooms (both on the upper level)
- Flooring: Carpet; Concrete; Vinyl
- Bathrooms: 2 bathrooms (1 full, 1 half; one on the main level and one on the upper level)
- Heating & cooling: Forced air heating; Central air conditioning
- Interior features: Dishwasher; Disposal; Dryer; Refrigerator; Washer; Fireplace located outside; Unfinished basement
- Laundry & utility: Washer and dryer included
Neighborhood map
What this means for you Summary
Snapshot
- This is a 2-bed/1.5-bath condo listed at $312k.
Deal economics
- At list price, monthly cash flow is $339 ($4k/yr) — positive.
- The deal already cash-flows at list — no discount required.
- To meet the 1% rule (rent ≥ 1% of price), the offer needs to be $289k (7.3% below list).
- Recommended offer: $289k (7.3% below list) — sets the bar for 1% rule.
- Cap rate 7.6% vs local median 1.7% in Boulder — top-decile yield for the area; either an underpriced asset or a hidden risk that comps aren't pricing in. Stress-test before assuming the spread holds.
Location & tenants
- Location reads 77/100 on livability (#24 in CO, #2,958 nationally) — a middle-class / working-renter tenant base. Strengths: amenities A+, commute A+, health & safety A+; Watch: crime D+, cost of living F.
- Boulder Valley School District No. Re2 (urban): math 49% / reading 67% proficiency, ranked #6 of 86 in CO (top 7%) — acceptable for families but not a draw, mixed tenant base, ~2y average lease; only 16% free/reduced lunch — higher-income household profile.
- Zoned schools: Crest View Elementary School (math 47% / reading 47%, grade D-, #249 of 966 statewide, top 27%, 435 students, 32% FRL); Centennial Middle School (math 42% / reading 47%, grade D, #56 of 270 statewide, top 23%, 567 students, 30% FRL); Boulder High School (math 64% / reading 81%, grade B+, #18 of 381 statewide, top 4%, 2,074 students, 28% FRL).
- Market conditions: Rents rising (+1.8%/yr); 256 active listings in the ZIP; 6 comparable units currently listed for rent nearby; rentals leasing fast (median 14d on market — plan ~1-2 weeks tenant-placement turnaround); high-income renter base; 1,688 units permitted in Boulder County in 2024 (1,136 in 5+ unit buildings).
Forward outlook
- Local home prices are declining (-3.0%/yr); year-one equity from $2k of loan paydown is wiped out by about $9k of value loss. Plan a longer hold.
- Boulder County population projected at +40% by 2050 — long-run rental-demand tailwind backs the buy-and-hold thesis.
Negotiation context
- Only 13 days on market — expect competitive offers; lowballing is unlikely to land.
- 4 sale attempts since 20y ago with the ask held roughly flat each time — persistent listings suggest the price (not the market) is what's stuck; bring a comps-based counter.
- Current owner paid $246k; 27% above their basis — modest negotiation headroom, anchor on the comps not their cost.
Risks & watch-outs
- Climate carrying-cost: severe wildfire risk — expect insurance premiums to compound above CPI over the hold.
Questions for the listing agent
- What does the HOA fee cover, when was the last increase, and are there any pending special assessments or reserve-fund shortfalls?
- Any open or pending special assessments — roof, HVAC, plumbing, elevator, façade? What's the per-unit balance and payoff schedule, and is the seller paying it off at close or rolling it to the buyer?
- Is there a deadline driving the sale (1031 exchange, divorce, estate, relocation)? That informs how much negotiation room exists.
- Schools are B-rated — typically a magnet for longer-tenancy family renters. What's the average tenant stay here, and is there a school-zone premium baked into asking?
- Crime grade is D in this area — have there been break-ins, vandalism, or insurance claims at this property in the last 3 years? What carrier currently insures it and at what premium?
- What's the average days-on-market for RENTAL listings here right now (not sales)? A rising rental-DOM trend means longer vacancies and softer asking-rent achievability than the comps imply.
- What's the recent tenant-quality profile in this submarket — average credit score on applications, eviction rate, late-payment / NSF rate, and stable-employment percentage? A property-management company in the area should have these aggregated.
- How much new apartment / multifamily construction is in the pipeline within 1–3 miles? Heavy new supply (>2% of stock underway) typically softens rents 12–24 months out; light construction supports rent growth.
Investment metrics
- 1% rule
- 0.93% ✗
- Cap rate
- 7.60%
- Cash-on-cash
- 4.66%
- DSCR
- 1.21
- GRM
- 9.0
CMA / ARV
No comps found within radius.
Projected returns pro-forma
-3.0% appreciation · 1.82% rent growth · sell at horizon
- IRR
- -10.3%
- Equity multiple
- 0.63×
- Total profit
- $-32,460
- Equity at exit
- $46,551
- IRR
- -2.6%
- Equity multiple
- 0.84×
- Total profit
- $-14,394
- Equity at exit
- $26,994
Cash invested: $87,417 (down + closing). Projections, not guarantees.
Landlord ↔ Tenant lean methodology
- Overall (STATE)
- 38 Tenant-Leaning
- State Colorado
- 38 Tenant-Leaning · D+4
- County
- — inherits STATE
- City
- — inherits STATE
ZIP-level market 80304
- Rents YoY
- 1.8%
- Active inventory
- 256
- Price-to-rent
- 9.0×
Monthly cashflow live
- Estimated rent
- $2,894 high interval (Pro) →
- Mortgage (P&I)
- −$1,637
- Tax from tax record
- −$147 /mo · $1,763/yr
- Insurance
- −$130
- HOA
- −$33
- Vacancy / Maint / Mgmt
- −$608
- Net cashflow
- $339
Break-even live
UW: 25.0% down · 7.5% · 30yr · 1.5% tax · 5.0% vac · 8.0% maint · 8.0% mgmt
Financing live
Cash to close
- Down payment
- $78,051
- Closing costs
- $9,366
- Reserves months
- —
- Total cash needed
- —
Loan-product check · same deal, 3 products live
Conventional
25% down · 7.5% · 30yr
- Down + closing
- —
- Monthly P&I
- —
- Monthly cashflow
- —
- DSCR
- —
- Eligible?
- —
Personal DTI + credit; lowest rate.
DSCR
20% down · 8.5% · 30yr
- Down + closing
- —
- Monthly P&I
- —
- Monthly cashflow
- —
- DSCR
- —
- Eligible?
- —
No personal income docs; deal must DSCR.
Hard money
10% down · 12.0% · 12mo
- Down + closing
- —
- Monthly P&I
- —
- Monthly cashflow
- —
- DSCR
- —
- Eligible?
- —
Short-term bridge; refi at stabilization.
Rent comps 6 comps
| Address | Beds | Baths | Sqft | Rent | $/sqft | DOM | Units | Dist |
|---|---|---|---|---|---|---|---|---|
| 4650 Holiday Dr #203 Boulder, CO | 1.0 | 1.0 | 736 | $3,295 | $4.48 | 13d | 1 | 0.11mi |
| 4775 13th St Boulder, CO | 4.0 | 1.0–4.5 | 1547 | $3,758 | $2.43 | 13d | 28 | 0.12mi |
| 4758 18th St Boulder, CO | 1.0 | 1.0 | 900 | $2,500 | $2.78 | 21d | 1 | 0.15mi |
| 4560 13th St Boulder, CO | 1.0–2.0 | 1.0–2.5 | 912 | $2,660 | $2.92 | 13d | 6 | 0.28mi |
| 4456 Broadway Boulder, CO | 2.0 | 1.0–2.0 | 670 | $2,455 | $3.66 | 13d | 4 | 0.41mi |
| 801 Chinle Ave Boulder, CO | 2.0 | 2.0 | 925 | $2,600 | $2.81 | 21d | 1 | 0.46mi |
HOA detail condo
- Monthly dues
- $33 · $396/yr
- Assessments
- None detected in remarks — confirm with the listing agent.
Listing history 11 events
-
2026-06-18days on market $312,205 Active 13 DOM
-
2026-06-17days on market $312,205 Active 12 DOM
-
2026-06-16days on market $312,205 Active 11 DOM
-
2026-06-15days on market $312,205 Active 10 DOM
-
2026-06-14days on market $312,205 Active 8 DOM
-
2026-06-13days on market $312,205 Active 7 DOM
-
2026-06-10days on market $312,205 Active 5 DOM
-
2026-06-09days on market $312,205 Active 4 DOM
-
2026-06-09days on market $312,205 Active 3 DOM
-
2026-06-07remarks 699-char remark
-
2026-06-07$312,205 Active 2 DOM
ⓘ Source: listings_history table (triggers on properties + properties_extension) + one-shot
backfill from property_details.listing_events for pre-trigger history.
Tax reassessment forecast CO · Resets to sale price
- Current annual tax
- $1,763 · $147/mo
- Projected year-2 tax
- $1,763 · $147/mo
- Expected delta
- $0/yr ($0/mo · 0.0%)
ⓘ Screening estimate from a state-policy table — verify with the county assessor before closing.
Climate risk First Street
- Flood 1/10 Low FEMA zone X (unshaded) · 0% chance over 30 yrs
- Wildfire 8/10 Severe
- Heat 3/10 Moderate 7 d/yr ≥92°F today · 18 d/yr by 30 yrs out
- Wind 1/10 Low
- Air quality 2/10 Low 1 unhealthy d/yr today · 1 by 30 yrs out
Nearby sold comps map
Loading sold comps map…
Walkable amenities ~0.75 mi
Loading nearby amenities…
Taxation est. · year 1
- Rental income
- $34,733
- − Mortgage interest
- −$17,488
- − Property taxes
- −$1,763
- − Insurance
- −$1,561
- − Repairs & maintenance
- −$2,779
- − Management
- −$2,779
- − HOA
- −$396
- − Depreciation
- −$9,082
- Taxable loss
- −$1,115
- Est. tax savings @ 24.0%
- +$268
- After-tax cash flow
- $4,340/yr
For passive investors: Depreciation is non-cash, so a rental often shows a tax loss while cash-flowing — sheltering income. Rental losses are passive: they offset passive income freely, and up to $25,000/yr can offset ordinary (W-2) income if you actively participate and your MAGI is under $100k (phasing out to $0 by $150k); unused losses carry forward. On sale, claimed depreciation is recaptured at up to 25%, and gains may owe capital-gains tax (a 1031 exchange can defer both). Figures are a year-1 estimate at your 24.0% rate — not tax advice; consult a CPA.
Schools (NCES district)
- District
- Boulder Valley School District No. Re2
- NCES district ID
- 0802490
- Math proficiency
- 49% ▼ -3.00%
- Reading proficiency
- 67% ▲ 4.00%
- Median HH income
- $70,395
- Composite
- 51.3/100
- National rank
- #1747
- State rank
- #6 of 86 in CO
Livability — Boulder
- Score
- 77/100
- State rank
- #24
- US rank
- #2958
Category grades
Schools grade is shown separately in the Schools card above.
Census & demographics
- Census place
- Boulder, CO
- County
- Boulder County · 271,666 people
- City population
- 121,246
- Metro
- Boulder, CO
- Population (ZIP)
- 25,383
- Household income
- $126,558
- Rent vs Own
- Severe rent burden
- 891.0
Population outlook (Boulder County) Hauer SSP2
- Today (2025)
- 380,833 people
- By 2030
- 412,028 · +8.2%
- By 2040
- 472,764 · +24.1%
- By 2050
- 532,029 · +39.7%
- By 2075
- 679,723 · +78.5%
- By 2100
- 766,278 · +101.2%
Race, ethnicity, and origin ACS 2023
- Neighborhood character
- Predominantly White (76%)
- Race & ethnicity
- White 76% Hispanic / Latino 16% Two or more races 10% Asian 3%
- Hispanic origin (detail)
- Mexican 11%
- Common ancestry
- Italian 4% Romanian 4% Slovak 3%
- Foreign-born
- 12% · Canada, China, Jamaica
- Languages at home
- 84% English-only · Spanish 9% Other Indo-European 2% German/W. Germanic 1%
Political lean MEDSL · Boulder
- 2024 margin
- Solid D (+55.8) · D 76.5% · R 20.8% · Other 2.7%
- 2008→2024 swing
- +9.6pp toward D · 2008: 46.1pp · 2024: 55.8pp
- All cycles
- 2024: D+55.8 2020: D+56.6 2016: D+48.6 2012: D+41.5 2008: D+46.1
Not yet ingested
- Civics
- —
Market trends
- HPI YoY
- ▼ -1111.31%
- Current HPI
- 324.6478
- Rent YoY
- ▲ 1.82%
- Metro
- Boulder, CO
- State GDP YoY
- ▲ 1.95%
- F500 in state
- 14
Industry mix (Fortune 500 HQ in CO)
| Industry | F500 HQs | Revenue |
|---|---|---|
| Technology Distribution | 1 | $31B |
|
||
| Food / Agriculture | 1 | $18B |
|
||
| Packaging | 1 | $14B |
|
||
| Healthcare | 1 | $13B |
|
||
| Energy | 1 | $10B |
|
||
| Technology | 1 | $4B |
|
||
Price history
-78.7% since first listed12 events — show timeline
- 2026-06-05 Listed $312,205 IRES
- 2026-06-05 Listed $312,205 REColorado as Distributed by MLS Grid
- 2016-05-04 Sold (Public Records) $246,285 Public Records
- 2016-05-04 Sold (Public Records) $246,285 Public Records
- 2016-05-03 Listing Removed — IRES
- 2016-05-03 Sold (MLS) $246,285 IRES
- 2016-04-06 Contingent — IRES
- 2016-03-02 Listed $246,285 IRES
- 2006-12-29 Sold (Public Records) $197,400 Public Records
- 2006-12-29 Sold (MLS) $197,400 IRES
- 2006-08-15 Listed $197,400 IRES
- 2006-03-02 Sold (Public Records) $1,468,301 Public Records
Property tax history
+2.3%/yrLatest (2025): $1,763 · +33.7% YoY. Source: county tax records.
Cash-flow waterfall
monthlySold comps — $/sqft
last 12 mo · ≤1 miLoading sold comps…