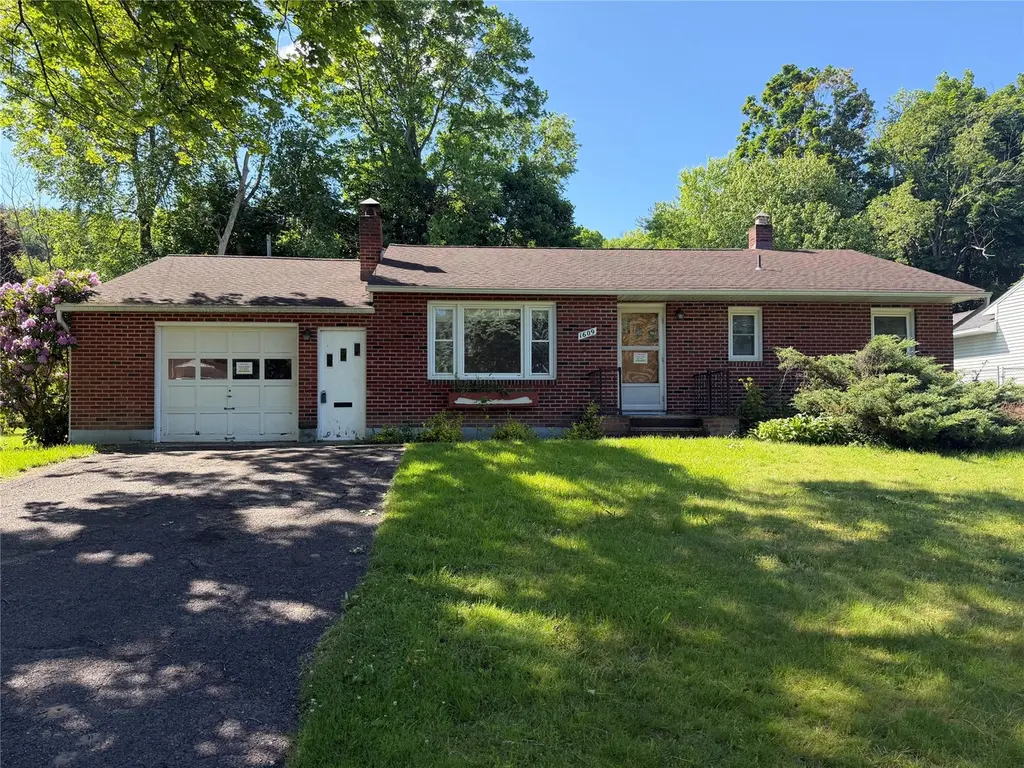
1609 Butternut Dr · Endicott, NY
Flood risk 1/10 · Minimal
- FEMA flood zone
- X
- Chance of flooding over 30 yrs
- 0.0%
- Est. flood insurance / yr
- $473 – $860
Fire risk 3/10 · Minor
- Est. fire insurance / yr
- $691 – $1,283
Heat risk 3/10 · Minor
- Hot days now (above 93°F)
- 7 days/yr
- Hot days in 30 yrs
- 16 days/yr
Wind risk 2/10 · Minimal
- Chance of severe wind over 30 yrs
- 1.0%
Air-quality risk 2/10 · Minimal
- Unhealthy air days now
- 0 days/yr
- Unhealthy air days in 30 yrs
- 1 days/yr
Risk factors via First Street. Map © Google.
Why this score? — see what drove the F grade
The composite is a weighted blend of 9 inputs, each scored 0–100. Each bar is that input's sub-score; the figure is the points it added to the 100-point composite (weight × sub-score).
- Schools +5.7/10.0
- Livability +3.5/5.0
- Rent growth +2.5/5.0
- Condition / age +2.5/5.0
- Cash flow +0.0/30.0
- 1% rule +0.0/10.0
- DSCR +0.0/10.0
- ARV discount +0.0/15.0
- Appreciation +0.0/10.0
$235,000
🖨 Deal sheet 📄 Offer letter ✓ Due diligence
Listing remarks MLS
Come home to this beautifully maintained brick ranch in an established Vestal neighborhood! Brand new electrical outlets and breaker box, newer furnace, chimney inspection, and central A/C servicing done in 2023. Fantastic additional living space in the finished lower level with full bath, workshop, and utility room with laundry and massive storage closet. Attached one car garage has direct access to mud room, lower level staircase, kitchen and back yard. The third bedroom was used as a dining room but could easily be used as a bedoom once again with 2 doors and a closet already present. Outside has an amazing garden area and a covered back patio perfect for soaking in the sounds of summer and feeling the cool breeze on the hot days. Come and see it at the open house on Monday the 24th from 4-6pm or make a private appointment. Don't miss out! This house could be yours!
Key facts
- 9,147 sq ft lot
- Garage
- Built 1956
Property features AI
Finance
- Other: Property located in Parkway Sub #2
Exterior
- Parking: Attached garage (1 garage space); Additional/other parking (see remarks)
- Utilities: Public water; Public sewer
- Home design: Single-family residence; Residential property
- Construction: Brick and other exterior materials; Concrete perimeter foundation; Above-grade finished area and additional below-grade finished area
- Exterior features: Patio; Workshop (outbuilding); Lot features: see remarks
Interior
- Kitchen: Dishwasher; Refrigerator; Range hood
- Bedrooms: Total rooms: 10 (includes bedrooms and living spaces)
- Flooring: Concrete; Hardwood; Laminate; Tile
- Bathrooms: 2 full bathrooms
- Heating & cooling: Forced air heating; Central air conditioning
- Interior features: See remarks (additional interior details); Living room with masonry wood-burning fireplace
- Laundry & utility: Washer hookup; Washer; Dryer; Gas water heater
Neighborhood map
What this means for you Summary
Snapshot
- This is a 2-bed/2.0-bath single-family listed at $235k.
Deal economics
- At list price, monthly cash flow is $-1k ($-14k/yr) — negative.
- To cash-flow at today's rent, offer at most $117k (50.4% below list).
- To meet the 1% rule (rent ≥ 1% of price), the offer needs to be $102k (56.6% below list).
- Recommended offer: $102k (56.6% below list) — sets the bar for 1% rule.
- Cap rate 0.3% vs local median 5.5% in Endicott — below-typical yield; the buyer is paying a premium for something (appreciation thesis, condition, location) that the cap rate doesn't capture.
Location & tenants
- Location reads 70/100 on livability (#438 in NY) — a middle-class / working-renter tenant base. Strengths: cost of living A+, health & safety A+, housing A; Watch: amenities D, crime F, commute F.
- Vestal Central School District (suburban): math 63% / reading 68% proficiency, ranked #168 of 590 in NY (top 28%) — acceptable for families but not a draw, mixed tenant base, ~2y average lease; only 17% free/reduced lunch — higher-income household profile.
- Zoned schools: Clayton Avenue Elementary School (math 52% / reading 62%, grade C+, #842 of 2,108 statewide, top 43%, 248 students, 49% FRL) — zoned schools average 49% FRL vs 17% district-wide (31 pts higher); higher-poverty schools than district average — tighter screening recommended.
- Market conditions: 90 active listings in the ZIP; 3 comparable units currently listed for rent nearby; rentals at typical pace (median 21d on market — plan ~3-4 weeks tenant-placement turnaround); 340 units permitted in Broome County in 2024 (269 in 5+ unit buildings).
Forward outlook
- Local home prices are declining (-3.0%/yr); year-one equity from $2k of loan paydown is wiped out by about $7k of value loss. Plan a longer hold.
- Broome County population projected at -13% by 2050 — secular population decline; favor cash flow + early exit over multi-decade hold.
Negotiation context
- It's been on market 19 days — a 2% lower offer ($231k) is reasonable based on typical stale-listing flexibility.
- 5 sale attempts since 3y ago with the ask held roughly flat each time — persistent listings suggest the price (not the market) is what's stuck; bring a comps-based counter.
- Current owner paid $180k; 31% above their basis — modest negotiation headroom, anchor on the comps not their cost.
Risks & watch-outs
- Watch-outs: property tax is 3.3% of price; built in 1956 — expect roof / HVAC / electrical / plumbing capex.
Questions for the listing agent
- What do current leases actually rent for vs. the listed asking? Can we see a recent rent roll and the last 12 months of T-12 income?
- Built in 1956 — when were the roof, HVAC, electrical panel, plumbing, and water heater last replaced?
- Property tax is high relative to price — has the assessment been appealed recently, and will the sale trigger a re-assessment?
- Is there a deadline driving the sale (1031 exchange, divorce, estate, relocation)? That informs how much negotiation room exists.
- Schools are D-rated, which usually means shorter tenancies and higher turnover. Who's the typical renter profile here, and what's been the actual vacancy rate?
- Crime grade is F in this area — have there been break-ins, vandalism, or insurance claims at this property in the last 3 years? What carrier currently insures it and at what premium?
- The area grade is low — what's the realistic commute time and amenity access for the typical tenant pool here? Any planned neighborhood developments (good or bad) we should know about?
- What's the average days-on-market for RENTAL listings here right now (not sales)? A rising rental-DOM trend means longer vacancies and softer asking-rent achievability than the comps imply.
- What's the recent tenant-quality profile in this submarket — average credit score on applications, eviction rate, late-payment / NSF rate, and stable-employment percentage? A property-management company in the area should have these aggregated.
- How much new for-sale + rental construction is in the pipeline within 1–3 miles? Heavy new supply typically softens prices + rents 12–24 months out; constrained supply supports both.
Investment metrics
- 1% rule
- 0.43% ✗
- Cap rate
- 0.29%
- Cash-on-cash
- -21.45%
- DSCR
- 0.05
- GRM
- 19.2
CMA / ARV
- ARV (on-the-fly)
- $188,696
- Comps found
- 2
Show comp detail 2 sales within ~0.75 mi
| Address | Dist | Beds/Ba | Sqft | Sold | Price | $/sf | Match |
|---|---|---|---|---|---|---|---|
| 320 Hoffman Ave | 0.45mi | 3/1.0 (+1) | 864 (-6%) | 7mo | $71,500 | $83 | 55 |
| 320 Leroy Ave | 0.60mi | 2/1.0 | 800 (-13%) | 10mo | $165,000 | $206 | 38 |
Match score weights: distance 35% · size 25% · config 20% · recency 20%. Top-matched comps best support the ARV.
Projected returns pro-forma
-3.0% appreciation · 3.0% rent growth · sell at horizon
- IRR
- -61.5%
- Equity multiple
- -0.71×
- Total profit
- $-112,743
- Equity at exit
- $35,039
- IRR
- —
- Equity multiple
- -1.94×
- Total profit
- $-193,663
- Equity at exit
- $20,319
Cash invested: $65,800 (down + closing). Projections, not guarantees.
Landlord ↔ Tenant lean methodology
- Overall (STATE)
- 15 Strongly Tenant-Friendly
- State New York
- 15 Strongly Tenant-Friendly · D+10
- County
- — inherits STATE
- City
- — inherits STATE
ZIP-level market 13850
- Home prices YoY
- -33.5%
- Active inventory
- 90
- Price-to-rent
- 19.2×
Monthly cashflow live
- Estimated rent
- $1,019 medium interval (Pro) →
- Mortgage (P&I)
- −$1,232
- Tax from tax record
- −$651 /mo · $7,811/yr
- Insurance
- −$98
- HOA
- −$0
- Vacancy / Maint / Mgmt
- −$214
- Net cashflow
- $-1,176
Break-even live
UW: 25.0% down · 7.5% · 30yr · 1.5% tax · 5.0% vac · 8.0% maint · 8.0% mgmt
Financing live
Cash to close
- Down payment
- $58,750
- Closing costs
- $7,050
- Reserves months
- —
- Total cash needed
- —
Loan-product check · same deal, 3 products live
Conventional
25% down · 7.5% · 30yr
- Down + closing
- —
- Monthly P&I
- —
- Monthly cashflow
- —
- DSCR
- —
- Eligible?
- —
Personal DTI + credit; lowest rate.
DSCR
20% down · 8.5% · 30yr
- Down + closing
- —
- Monthly P&I
- —
- Monthly cashflow
- —
- DSCR
- —
- Eligible?
- —
No personal income docs; deal must DSCR.
Hard money
10% down · 12.0% · 12mo
- Down + closing
- —
- Monthly P&I
- —
- Monthly cashflow
- —
- DSCR
- —
- Eligible?
- —
Short-term bridge; refi at stabilization.
Rent comps 3 comps
| Address | Beds | Baths | Sqft | Rent | $/sqft | DOM | Units | Dist |
|---|---|---|---|---|---|---|---|---|
| 228 Airport Rd Unit 1 Endicott, NY | 2.0 | 1.0 | 1000 | $1,075 | $1.07 | 21d | 1 | 1.24mi |
| 404 Exchange Ave Endicott, NY | 2.0 | 1.0 | 850 | $1,100 | $1.29 | 43d | 1 | 1.37mi |
| 120 Badger Ave Unit 7 Endicott, NY | 1.0 | 1.0 | 750 | $850 | $1.13 | 21d | 1 | 1.45mi |
Listing history 14 events
-
2026-06-19days on market $235,000 Active 19 DOM
-
2026-06-18days on market $235,000 Active 18 DOM
-
2026-06-17days on market $235,000 Active 17 DOM
-
2026-06-16days on market $235,000 Active 16 DOM
-
2026-06-15days on market $235,000 Active 15 DOM
-
2026-06-14days on market $235,000 Active 13 DOM
-
2026-06-13days on market $235,000 Active 12 DOM
-
2026-06-10days on market $235,000 Active 10 DOM
-
2026-06-09days on market $235,000 Active 9 DOM
-
2026-06-08days on market $235,000 Active 8 DOM
-
2026-06-07days on market $235,000 Active 7 DOM
-
2026-06-02days on market $235,000 Active 2 DOM
-
2026-06-01remarks 650-char remark
-
2026-06-01$235,000 Active 1 DOM
ⓘ Source: listings_history table (triggers on properties + properties_extension) + one-shot
backfill from property_details.listing_events for pre-trigger history.
Tax reassessment forecast NY · Partial reset (capped growth)
- Current annual tax
- $7,811 · $651/mo
- Projected year-2 tax
- $7,811 · $651/mo
- Expected delta
- $0/yr ($0/mo · 0.0%)
ⓘ Screening estimate from a state-policy table — verify with the county assessor before closing.
Climate risk First Street
- Flood 1/10 Low FEMA zone X · 0% chance over 30 yrs
- Wildfire 3/10 Moderate
- Heat 3/10 Moderate 7 d/yr ≥93°F today · 16 d/yr by 30 yrs out
- Wind 2/10 Low 100% chance of damaging wind over 30 yrs
- Air quality 2/10 Low 0 unhealthy d/yr today · 1 by 30 yrs out
Nearby sold comps map
Loading sold comps map…
Walkable amenities ~0.75 mi
Loading nearby amenities…
Taxation est. · year 1
- Rental income
- $12,231
- − Mortgage interest
- −$13,164
- − Property taxes
- −$7,811
- − Insurance
- −$1,175
- − Repairs & maintenance
- −$978
- − Management
- −$978
- − Depreciation
- −$6,836
- Taxable loss
- −$18,712
- Est. tax savings @ 24.0%
- +$4,491
- After-tax cash flow
- $-9,621/yr
For passive investors: Depreciation is non-cash, so a rental often shows a tax loss while cash-flowing — sheltering income. Rental losses are passive: they offset passive income freely, and up to $25,000/yr can offset ordinary (W-2) income if you actively participate and your MAGI is under $100k (phasing out to $0 by $150k); unused losses carry forward. On sale, claimed depreciation is recaptured at up to 25%, and gains may owe capital-gains tax (a 1031 exchange can defer both). Figures are a year-1 estimate at your 24.0% rate — not tax advice; consult a CPA.
Schools (NCES district)
- District
- Vestal Central School District
- NCES district ID
- 3629610
- Math proficiency
- 63% ▼ -7.00%
- Reading proficiency
- 68% ▲ 4.00%
- Median HH income
- $64,143
- Composite
- 56.97/100
- National rank
- #1111
- State rank
- #168 of 590 in NY
Livability — Endicott
- Score
- 70/100
- State rank
- #438
- US rank
- #7657
Category grades
Schools grade is shown separately in the Schools card above.
Census & demographics
- City population
- 42,896
- Population (ZIP)
- 23,675
Population outlook (Broome County) Hauer SSP2
- Today (2025)
- 187,989 people
- By 2030
- 183,066 · -2.6%
- By 2040
- 172,228 · -8.4%
- By 2050
- 163,161 · -13.2%
- By 2075
- 153,641 · -18.3%
- By 2100
- 140,851 · -25.1%
Race, ethnicity, and origin ACS 2023
- Neighborhood character
- Predominantly White (78%)
- Race & ethnicity
- White 78% Asian 12% Hispanic / Latino 5% Two or more races 5% Black 2%
- Hispanic origin (detail)
- Puerto Rican 2%
- Common ancestry
- Romanian 6% Scotch-Irish 2% Italian 2%
- Foreign-born
- 14% · China, Canada, South Korea
- Languages at home
- 84% English-only · Chinese 6% Other Indo-European 5% Other Asian/Pacific 2%
Political lean MEDSL · Broome
- 2024 margin
- Toss-up / Even · D 50.2% · R 49.8%
- 2008→2024 swing
- -7.6pp toward R · 2008: 8.0pp · 2024: 0.4pp
- All cycles
- 2024: D+0.4 2020: D+3.5 2016: R+3.7 2012: D+4.6 2008: D+8.0
Not yet ingested
- Civics
- —
Market trends
- HPI YoY
- ▼ -142.14%
- Current HPI
- 282.4645
- Rent YoY
- —
- Metro
- —
- State GDP YoY
- ▲ 2.60%
- F500 in state
- 92
Industry mix (Fortune 500 HQ in NY)
| Industry | F500 HQs | Revenue |
|---|---|---|
| Financial Services | 10 | $950B |
|
||
| Consumer Goods | 9 | $162B |
|
||
| Insurance | 4 | $225B |
|
||
| Telecommunications | 2 | $144B |
|
||
| Pharmaceuticals | 2 | $112B |
|
||
| Media / Entertainment | 2 | $69B |
|
||
Price history
+38.3% since first listed15 events — show timeline
- 2026-06-01 Listed $235,000 GBAOR
- 2026-01-20 Listed $220,000 GBAOR
- 2024-05-07 Rental Removed $1,650 GBAOR
- 2024-04-08 Listed for Rent $1,650 GBAOR
- 2024-04-05 Rental Removed $1,800 GBAOR
- 2024-01-15 Price Changed $1,800 GBAOR
- 2023-12-08 Price Changed $1,850 GBAOR
- 2023-11-09 Price Changed $1,900 GBAOR
- 2023-10-10 Sold (Public Records) $180,000 Public Records
- 2023-10-06 Listed for Rent $2,000 GBAOR
- 2023-09-27 Sold (MLS) $180,000 GBAOR
- 2023-08-25 Pending — GBAOR
- 2023-08-07 Delisted — GBAOR
- 2023-07-27 Pending — GBAOR
- 2023-07-23 Listed $169,900 GBAOR
Property tax history
+12.2%/yrLatest (2025): $7,811 · +73.7% YoY. Source: county tax records.
Cash-flow waterfall
monthlySold comps — $/sqft
last 12 mo · ≤1 miLoading sold comps…