 🏷️ Likely Rental
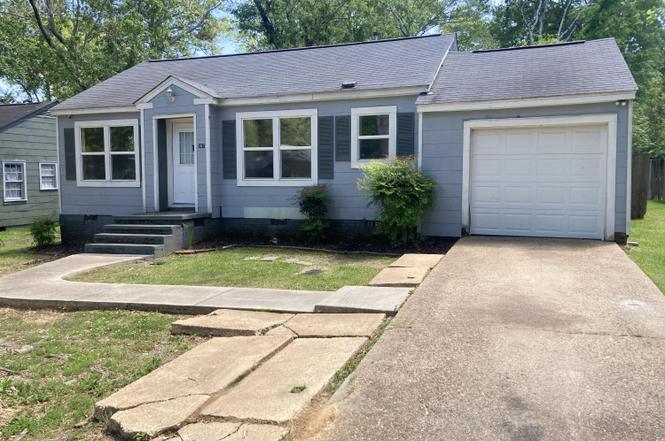
567 Robinhood Rd · Jackson, MS
Flood risk 1/10 · Minimal
- FEMA flood zone
- X (unshaded)
- Chance of flooding over 30 yrs
- 0.0%
- Est. flood insurance / yr
- $507 – $1,088
Fire risk 1/10 · Minimal
- Est. fire insurance / yr
- $1,241 – $2,305
Heat risk 7/10 · Major
- Hot days now (above 108°F)
- 7 days/yr
- Hot days in 30 yrs
- 19 days/yr
Wind risk 8/10 · Major
- Chance of severe wind over 30 yrs
- 80.0%
Air-quality risk 2/10 · Minimal
- Unhealthy air days now
- 0 days/yr
- Unhealthy air days in 30 yrs
- 1 days/yr
Risk factors via First Street. Map © Google.
Why this score? — see what drove the B- grade
The composite is a weighted blend of 9 inputs, each scored 0–100. Each bar is that input's sub-score; the figure is the points it added to the 100-point composite (weight × sub-score).
- Cash flow +30.0/30.0
- 1% rule +10.0/10.0
- DSCR +10.0/10.0
- ARV discount +7.5/15.0
- Livability +3.4/5.0
- Rent growth +3.2/5.0
- Condition / age +2.5/5.0
- Schools +1.1/10.0
- Appreciation +0.0/10.0
$36,900
🖨 Deal sheet 📄 Offer letter ✓ Due diligence
Listing remarks MLS
Darling Investment , with long term Tenant. Short return on investment , with a 18 % cap rate. This home is a value in excess of the normally for this area , with Premium quality updates, and in prime condition. Solid investment ! Please view the sellers Disclosure for a detailed list of improvements. The seller has placed the best of Materials in this one. Some improvements included, But not limited to are; New electrical panel, New Pella Windows, New Stove, New sub floors in the Kitchen and bathroom. New bathroom enclosure w/New vanity and toilet, New Hardwood floors, New wood Deck, New sidewalk, New Deck and privacy fence. This home would make a prime home for any first time buyer also.
Key facts
- 8,276 sq ft lot
- Garage
- Built 1950
Property features AI
Exterior
- Parking: Attached garage with garage door opener (1 car); Concrete driveway
- Security: Dead bolt locks
- Utilities: Public water; Public sewer; Electricity available; Natural gas available; Sewer connected; Water available
- Home design: Single-family house; One story; Move-in ready
- Construction: Asphalt shingle roof; Asbestos construction materials; Conventional foundation; Built in public-records year
- Exterior features: Deck; Backyard fencing (wood); City lot
Interior
- Kitchen: Electric range
- Bedrooms: Two bedrooms on the main level
- Flooring: Hardwood flooring; Tile flooring
- Bathrooms: One full bathroom on the main level
- Heating & cooling: Central electric heating; Central air conditioning
- Interior features: Tile counters; Insulated windows; Dead bolt locks; Outside fireplace
- Laundry & utility: Washer hookup; Electric dryer hookup; Electric water heater
Neighborhood map
What this means for you Summary
Snapshot
- This is a 2-bed/1.0-bath single-family listed at $37k.
Deal economics
- At list price, monthly cash flow is $568 ($7k/yr) — positive.
- The deal already cash-flows at list — no discount required.
- Meets the 1% rule at list price ($1k rent vs $37k).
- Cap rate 24.8% vs local median 9.9% in Jackson — top-decile yield for the area; either an underpriced asset or a hidden risk that comps aren't pricing in. Stress-test before assuming the spread holds.
Location & tenants
- Location reads 68/100 on livability (#66 in MS) — a middle-class / working-renter tenant base. Strengths: commute A+, cost of living A+, housing A+; Watch: amenities F, employment F, health & safety F.
- Jackson Public School District (urban): math 9% / reading 18% proficiency, ranked #112 of 130 in MS (top 86%) — low school quality limits family demand, transient renter base, plan for 1-2y turnover; 88% free/reduced lunch — lower-income household profile, screen leases tightly.
- Zoned schools: Boyd Elementary School (math 0% / reading 9%, grade F, #368 of 375 statewide, top 98%, 405 students, 100% FRL); Murrah High School (math 12% / reading 27%, grade F, #130 of 197 statewide, top 68%, 1,326 students, 100% FRL).
- Market conditions: Rents rising (+2.8%/yr); 119 active listings in the ZIP; 20 comparable units currently listed for rent nearby; rentals at typical pace (median 24d on market — plan ~3-4 weeks tenant-placement turnaround); lower-income renter base — watch delinquency; 167 units permitted in Hinds County in 2024 (0 in 5+ unit buildings).
- This rent runs 31% of the median local income ($43k/yr) — at the standard rent-burdened threshold; future hikes will face affordability resistance.
Forward outlook
- Local home prices are declining (-3.0%/yr); year-one equity from $255 of loan paydown is wiped out by about $1k of value loss. Plan a longer hold.
- Hinds County population projected to shrink 6% by 2050 — rents likely to lag national; underwrite the cash flow, not the appreciation.
- At projected returns (-3.0% appreciation + 2.8% rent growth), your $10k cash investment doubles in ~2 years — after that, you're playing with house money.
Negotiation context
- Only 8 days on market — expect competitive offers; lowballing is unlikely to land.
- 5 sale attempts since 20y ago with the ask held roughly flat each time — persistent listings suggest the price (not the market) is what's stuck; bring a comps-based counter.
Risks & watch-outs
- Watch-outs: property tax is 3.4% of price; built in 1950 — expect roof / HVAC / electrical / plumbing capex.
- Climate carrying-cost: severe wind risk, 80% chance of damaging wind over 30y; extreme-heat days projected 7→19/yr by 2055 (HVAC capex compounding) — expect insurance premiums to compound above CPI over the hold.
Questions for the listing agent
- Built in 1950 — when were the roof, HVAC, electrical panel, plumbing, and water heater last replaced?
- Property tax is high relative to price — has the assessment been appealed recently, and will the sale trigger a re-assessment?
- Is there a deadline driving the sale (1031 exchange, divorce, estate, relocation)? That informs how much negotiation room exists.
- Schools are F-rated, which usually means shorter tenancies and higher turnover. Who's the typical renter profile here, and what's been the actual vacancy rate?
- What's the average days-on-market for RENTAL listings here right now (not sales)? A rising rental-DOM trend means longer vacancies and softer asking-rent achievability than the comps imply.
- What's the recent tenant-quality profile in this submarket — average credit score on applications, eviction rate, late-payment / NSF rate, and stable-employment percentage? A property-management company in the area should have these aggregated.
- How much new for-sale + rental construction is in the pipeline within 1–3 miles? Heavy new supply typically softens prices + rents 12–24 months out; constrained supply supports both.
Investment metrics
- 1% rule
- 3.02% ✓
- Cap rate
- 24.75%
- Cash-on-cash
- 65.93%
- DSCR
- 3.93
- GRM
- 2.8
CMA / ARV
- ARV (on-the-fly)
- $91,080
- Comps found
- 1
Show comp detail 1 sale within ~0.75 mi
| Address | Dist | Beds/Ba | Sqft | Sold | Price | $/sf | Match |
|---|---|---|---|---|---|---|---|
| 547 Woodbury Rd | 0.11mi | 2/1.0 | 816 (+3%) | 9mo | $94,000 | $115 | 82 |
Match score weights: distance 35% · size 25% · config 20% · recency 20%. Top-matched comps best support the ARV.
Projected returns pro-forma
-3.0% appreciation · 2.83% rent growth · sell at horizon
- IRR
- 65.0%
- Equity multiple
- 3.91×
- Total profit
- $30,039
- Equity at exit
- $5,502
- IRR
- 69.3%
- Equity multiple
- 7.98×
- Total profit
- $72,150
- Equity at exit
- $3,190
Cash invested: $10,332 (down + closing). Projections, not guarantees.
Landlord ↔ Tenant lean methodology
- Overall (STATE)
- 90 Strongly Landlord-Friendly
- State Mississippi
- 90 Strongly Landlord-Friendly · R+11
- County
- — inherits STATE
- City
- — inherits STATE
ZIP-level market 39206
- Home prices YoY
- -10.3%
- Rents YoY
- 2.8%
- Active inventory
- 119
- Price-to-rent
- 2.8×
Monthly cashflow live
- Estimated rent
- $1,115 high interval (Pro) →
- Mortgage (P&I)
- −$194
- Tax from tax record
- −$105 /mo · $1,256/yr
- Insurance
- −$15
- HOA
- −$0
- Vacancy / Maint / Mgmt
- −$234
- Net cashflow
- $568
Break-even live
UW: 25.0% down · 7.5% · 30yr · 1.5% tax · 5.0% vac · 8.0% maint · 8.0% mgmt
Financing live
Cash to close
- Down payment
- $9,225
- Closing costs
- $1,107
- Reserves months
- —
- Total cash needed
- —
Loan-product check · same deal, 3 products live
Conventional
25% down · 7.5% · 30yr
- Down + closing
- —
- Monthly P&I
- —
- Monthly cashflow
- —
- DSCR
- —
- Eligible?
- —
Personal DTI + credit; lowest rate.
DSCR
20% down · 8.5% · 30yr
- Down + closing
- —
- Monthly P&I
- —
- Monthly cashflow
- —
- DSCR
- —
- Eligible?
- —
No personal income docs; deal must DSCR.
Hard money
10% down · 12.0% · 12mo
- Down + closing
- —
- Monthly P&I
- —
- Monthly cashflow
- —
- DSCR
- —
- Eligible?
- —
Short-term bridge; refi at stabilization.
Rent comps 20 comps
| Address | Beds | Baths | Sqft | Rent | $/sqft | DOM | Units | Dist |
|---|---|---|---|---|---|---|---|---|
| 229 Lawrence Rd #229 Jackson, MS | 2.0 | 1.0 | 840 | $995 | $1.18 | 44d | 1 | 0.46mi |
| 229 Lawrence Rd Jackson, MS | 2.0 | 1.0 | 840 | $900 | $1.07 | 23d | 1 | 0.46mi |
| 227 Lawrence Rd #227 Jackson, MS | 2.0 | 1.0 | 840 | $995 | $1.18 | 44d | 1 | 0.46mi |
| 227 Lawrence Rd Jackson, MS | 2.0 | 1.0 | 840 | $900 | $1.07 | 14d | 2 | 0.46mi |
| 227 Lawrence Rd Jackson, MS | 1.0 | 1.0 | 840 | $900 | $1.07 | 23d | 1 | 0.46mi |
| 4833 N State St Jackson, MS | 3.0 | 2.0 | 994 | $1,195 | $1.20 | 44d | 1 | 0.52mi |
| 4901 McWillie Cir Jackson, MS | 1.0–2.0 | 1.0–2.0 | 806 | $1,150 | $1.43 | 14d | 1 | 0.54mi |
| 20 N Hill Pkwy Jackson, MS | 1.0–3.0 | 1.0–2.5 | 1046 | $900 | $0.86 | 14d | 31 | 0.55mi |
| 5255 Manhattan Rd Jackson, MS | 1.0–2.0 | 1.0–2.0 | 813 | $1,100 | $1.35 | 14d | 1 | 0.74mi |
| 200 Stillwood Dr Jackson, MS | 3.0 | 2.0 | 1088 | $1,300 | $1.19 | 44d | 1 | 1.01mi |
| 200 Stillwood Dr Jackson, MS | 3.0 | 2.0 | 1088 | $1,300 | $1.19 | 14d | 1 | 1.01mi |
| 3718 Northbrook Dr Jackson, MS | 2.0 | 1.0 | 942 | $1,050 | $1.11 | 23d | 1 | 1.02mi |
| 365 W Northside Dr Jackson, MS | 1.0 | 1.0 | 550 | $899 | $1.63 | 44d | 1 | 1.08mi |
| 4426 Desoto St Jackson, MS | 3.0 | 1.0 | 1079 | $1,250 | $1.16 | 23d | 1 | 1.08mi |
| 4426 Desoto St Jackson, MS | 3.0 | 1.0 | 1079 | $1,250 | $1.16 | 14d | 1 | 1.08mi |
| 3908 N State St Jackson, MS | 1.0 | 1.0 | 740 | $2,800 | $3.78 | 44d | 1 | 1.26mi |
| 5155 Wayneland Dr Jackson, MS | 1.0–2.0 | 1.0–2.0 | 905 | $1,500 | $1.66 | 23d | 1 | 1.26mi |
| 3816 N State St Unit 3816 Jackson, MS | 1.0 | 1.0 | 700 | $1,095 | $1.56 | 44d | 1 | 1.30mi |
| 533 Stillwood Dr Jackson, MS | 2.0 | 1.0 | 906 | $820 | $0.91 | 14d | 1 | 1.47mi |
| 3811 Mosley Ave Jackson, MS | 2.0 | 1.0 | 1000 | $1,095 | $1.09 | 21d | 1 | 1.49mi |
Listing history 7 events
-
2026-06-18days on market $36,900 Active 8 DOM
-
2026-06-17days on market $36,900 Active 7 DOM
-
2026-06-16days on market $36,900 Active 6 DOM
-
2026-06-15days on market $36,900 Active 5 DOM
-
2026-06-14days on market $36,900 Active 3 DOM
-
2026-06-13remarks 331-char remark
-
2026-06-13$36,900 Active 2 DOM
ⓘ Source: listings_history table (triggers on properties + properties_extension) + one-shot
backfill from property_details.listing_events for pre-trigger history.
Tax reassessment forecast MS · Resets to sale price
- Current annual tax
- $1,256 · $105/mo
- Projected year-2 tax
- $1,256 · $105/mo
- Expected delta
- $0/yr ($0/mo · 0.0%)
ⓘ Screening estimate from a state-policy table — verify with the county assessor before closing.
Climate risk First Street
- Flood 1/10 Low FEMA zone X (unshaded) · 0% chance over 30 yrs
- Wildfire 1/10 Low
- Heat 7/10 Severe 7 d/yr ≥108°F today · 19 d/yr by 30 yrs out
- Wind 8/10 Severe 80% chance of damaging wind over 30 yrs
- Air quality 2/10 Low 0 unhealthy d/yr today · 1 by 30 yrs out
Nearby sold comps map
Loading sold comps map…
Walkable amenities ~0.75 mi
Loading nearby amenities…
Taxation est. · year 1
- Rental income
- $13,386
- − Mortgage interest
- −$2,067
- − Property taxes
- −$1,256
- − Insurance
- −$184
- − Repairs & maintenance
- −$1,071
- − Management
- −$1,071
- − Depreciation
- −$1,073
- Taxable income
- $6,663
- Est. tax owed @ 24.0%
- −$1,599
- After-tax cash flow
- $5,213/yr
For passive investors: Depreciation is non-cash, so a rental often shows a tax loss while cash-flowing — sheltering income. Rental losses are passive: they offset passive income freely, and up to $25,000/yr can offset ordinary (W-2) income if you actively participate and your MAGI is under $100k (phasing out to $0 by $150k); unused losses carry forward. On sale, claimed depreciation is recaptured at up to 25%, and gains may owe capital-gains tax (a 1031 exchange can defer both). Figures are a year-1 estimate at your 24.0% rate — not tax advice; consult a CPA.
Schools (NCES district)
- District
- Jackson Public School District
- NCES district ID
- 2802190
- Math proficiency
- 9% ▼ -14.00%
- Reading proficiency
- 18% ▼ -7.00%
- Median HH income
- $33,234
- Composite
- 10.89/100
- National rank
- #9755
- State rank
- #112 of 130 in MS
Livability — Jackson
- Score
- 68/100
- State rank
- #66
- US rank
- #9695
Category grades
Schools grade is shown separately in the Schools card above.
Census & demographics
- Census place
- Jackson, MS
- County
- Hinds County · 167,040 people
- City population
- 140,204
- Metro
- Jackson, MS
- Population (ZIP)
- 23,257
- Household income
- $42,686
- Rent vs Own
- Severe rent burden
- 1554.0
Population outlook (Hinds County) Hauer SSP2
- Today (2025)
- 242,528 people
- By 2030
- 241,113 · -0.6%
- By 2040
- 235,557 · -2.9%
- By 2050
- 226,946 · -6.4%
- By 2075
- 199,995 · -17.5%
- By 2100
- 164,165 · -32.3%
Race, ethnicity, and origin ACS 2023
- Neighborhood character
- Predominantly Black (85%)
- Race & ethnicity
- Black 85% White 9% Hispanic / Latino 3% Two or more races 3%
- Common ancestry
- Italian 1%
- Foreign-born
- 2% · Canada
- Languages at home
- 96% English-only · Spanish 3%
Political lean MEDSL · Hinds
- 2024 margin
- Solid D (+46.1) · D 72.4% · R 26.3% · Other 1.4%
- 2008→2024 swing
- +7.1pp toward D · 2008: 39.0pp · 2024: 46.1pp
- All cycles
- 2024: D+46.1 2020: D+48.3 2016: D+43.7 2012: D+45.1 2008: D+39.0
Not yet ingested
- Civics
- —
Market trends
- HPI YoY
- ▼ -22.38%
- Current HPI
- 194.5873
- Rent YoY
- ▲ 2.83%
- Metro
- Jackson, MS
- State GDP YoY
- —
- F500 in state
- 0
Price history
-12.1% since first listed16 events — show timeline
- 2026-06-10 Listed $36,900 MLSU
- 2021-11-01 Sold (Public Records) — Public Records
- 2021-11-01 Sold (MLS) — MLSU
- 2021-10-20 Listing Removed — MLSU
- 2021-10-01 Listing Removed — MLSU
- 2021-08-12 Listed $54,000 MLSU
- 2018-02-27 Sold (Public Records) — Public Records
- 2012-01-27 Sold (Public Records) — Public Records
- 2011-09-30 Listed $23,000 MLSU
- 2011-02-12 Listing Removed — MLSU
- 2010-12-09 Listed $42,500 MLSU
- 2010-11-15 Sold (Public Records) — Public Records
- 2006-05-12 Listed $42,000 MLSU
- 1999-05-17 Sold (Public Records) — Public Records
- 1998-01-22 Sold (Public Records) — Public Records
- 1986-02-28 Sold (Public Records) — Public Records
Property tax history
+0.9%/yrLatest (2021): $1,256 · -0.8% YoY. Source: county tax records.
Cash-flow waterfall
monthlySold comps — $/sqft
last 12 mo · ≤1 miLoading sold comps…