 Duplex
450 Commonwealth Ave #3 · New York, NY
Flood risk 7/10 · Major
- FEMA flood zone
- X (shaded)
- Chance of flooding over 30 yrs
- 0.78%
- Est. flood insurance / yr
- $507 – $1,088
Fire risk 2/10 · Minimal
- Est. fire insurance / yr
- $691 – $1,283
Heat risk 6/10 · Moderate
- Hot days now (above 99°F)
- 7 days/yr
- Hot days in 30 yrs
- 14 days/yr
Wind risk 6/10 · Moderate
- Chance of severe wind over 30 yrs
- 27.0%
Air-quality risk 4/10 · Minor
- Unhealthy air days now
- 5 days/yr
- Unhealthy air days in 30 yrs
- 6 days/yr
Risk factors via First Street. Map © Google.
Why this score? — see what drove the C+ grade
The composite is a weighted blend of 9 inputs, each scored 0–100. Each bar is that input's sub-score; the figure is the points it added to the 100-point composite (weight × sub-score).
- Cash flow +21.8/30.0
- ARV discount +15.0/15.0
- DSCR +7.0/10.0
- 1% rule +5.7/10.0
- Schools +5.0/10.0
- Livability +3.8/5.0
- Rent growth +2.5/5.0
- Condition / age +2.2/5.0
- Appreciation +0.0/10.0
$749,999
🖨 Deal sheet 📄 Offer letter ✓ Due diligence
Multi-family units
County records classify this as Multi-Family (2-4 Unit). Listing-text estimate: 2 units. confirmed
Listing remarks
Great opportunity to own a two-family home with a 3-bedroom over 3-bedroom configuration. Perfect for those looking to occupy one unit while generating rental income from the other. Property is currently occupied and offers a practical layout with strong income potential. As-is sale. No representations or warranties by seller, agent, or brokerage. Buyer to verify all information and perform their own due diligence. Do not disturb occupants. Conveniently located near public transportation, shopping, and neighborhood amenities.
Key facts
- 1,992 sq ft lot
- Parking
- Built 1975
Property features AI
Finance
- Financial info: Tax year 2025
Exterior
- Parking: One covered carport space; On-street parking available
- Utilities: Public sewer; Electricity connected; Natural gas available; Sewer connected
- Home design: Triplex
- Construction: Brick construction
- Exterior features: Fenced front yard; Not waterfront
Interior
- Bedrooms: Two 3-bedroom units
- Bathrooms: Three full bathrooms
- Heating & cooling: Baseboard heating
- Interior features: Open floor plan; Walk-out basement
Neighborhood map
What this means for you Summary
Snapshot
- This is a 2 × 3-bed/1.5-bath units multifamily listed at $750k. Condition is rated fair.
Deal economics
- At list price, monthly cash flow is $1k ($13k/yr) — positive. Per door: $552/mo.
- The deal already cash-flows at list — no discount required.
- Meets the 1% rule at list price ($8k rent vs $750k).
- Recommended offer: $727k (3.0% below list) — sets the bar for market timing.
- Cap rate 8.2% vs local median 2.6% in New York — top-decile yield for the area; either an underpriced asset or a hidden risk that comps aren't pricing in. Stress-test before assuming the spread holds.
Location & tenants
- Location reads 75/100 on livability (#268 in NY, #4,188 nationally) — a middle-class / working-renter tenant base. Strengths: amenities A+, commute A+, health & safety A; Watch: crime F, cost of living F.
- Market conditions: 141 active listings in the ZIP; 6,929 units permitted in Bronx County in 2024 (6,829 in 5+ unit buildings).
- At $8,043/mo this rent would consume 184% of the median local household income ($52k/yr) (locally 3913% of renters already pay >50% of income on rent) — very limited rent-growth headroom before tenants either downsize or default.
Forward outlook
- Local home prices are declining (-3.0%/yr); year-one equity from $5k of loan paydown is wiped out by about $22k of value loss. Plan a longer hold.
- Bronx County population projected at +21% by 2050 — long-run rental-demand tailwind backs the buy-and-hold thesis.
Negotiation context
- It's been on market 42 days — a 3% lower offer ($727k) is reasonable based on typical stale-listing flexibility.
Risks & watch-outs
- Watch-outs: flood insurance adds $66/mo.
- Climate carrying-cost: major flood risk; major wind risk, 27% chance of damaging wind over 30y; extreme-heat days projected 7→14/yr by 2055 (HVAC capex compounding) — expect insurance premiums to compound above CPI over the hold.
Questions for the listing agent
- It's been on market 42 days. Have you received any prior offers? Is the seller open to a 3% concession, seller financing, or rate buy-down credit?
- Can we see the unit-by-unit rent roll, current vacancy, and any below-market leases? What's the average tenancy length?
- What capital expenditures (roof, boiler, parking lot, exteriors) have been made in the last 5 years, and what's planned in the next 2?
- Have any recent inspections been done? Can we get a copy of the seller's disclosures and any deferred-maintenance estimates?
- Built in 1975 — when were the roof, HVAC, electrical panel, plumbing, and water heater last replaced?
- What's the actual annual flood-insurance premium (NFIP or private), and is the property in a SFHA with mandatory coverage?
- Is there a deadline driving the sale (1031 exchange, divorce, estate, relocation)? That informs how much negotiation room exists.
- Schools are B-rated — typically a magnet for longer-tenancy family renters. What's the average tenant stay here, and is there a school-zone premium baked into asking?
- Crime grade is F in this area — have there been break-ins, vandalism, or insurance claims at this property in the last 3 years? What carrier currently insures it and at what premium?
- What's the average days-on-market for RENTAL listings here right now (not sales)? A rising rental-DOM trend means longer vacancies and softer asking-rent achievability than the comps imply.
- What's the recent tenant-quality profile in this submarket — average credit score on applications, eviction rate, late-payment / NSF rate, and stable-employment percentage? A property-management company in the area should have these aggregated.
- How much new apartment / multifamily construction is in the pipeline within 1–3 miles? Heavy new supply (>2% of stock underway) typically softens rents 12–24 months out; light construction supports rent growth.
Investment metrics
- 1% rule
- 1.07% ✓
- Cap rate
- 8.17%
- Cash-on-cash
- 6.69%
- DSCR
- 1.30
- GRM
- 7.8
CMA / ARV
- ARV (on-the-fly)
- $930,930
- Comps found
- 7
Show comp detail 7 sales within ~0.75 mi
| Address | Dist | Beds/Ba | Sqft | Sold | Price | $/sf | Match |
|---|---|---|---|---|---|---|---|
| 454 Commonwealth Ave | 0.01mi | 7/3.0 (-1) | 2,730 (0%) | 10mo | $920,000 | $337 | 86 |
| 485 Commonwealth Ave | 0.08mi | 7/3.0 (-1) | 2,650 (-3%) | 10mo | $840,000 | $317 | 79 |
| 447 Saint Lawrence Ave | 0.07mi | 7/3.0 (-1) | 2,745 (+0%) | 15mo | $950,000 | $346 | 78 |
| 410 Thieriot Ave | 0.20mi | 7/3.0 (-1) | 3,110 (+14%) | 6mo | $925,000 | $297 | 58 |
| 422 Screvin Ave | 0.67mi | 8/3.0 | 2,795 (+2%) | 10mo | $999,999 | $358 | 56 |
| 448 Screvin Ave | 0.68mi | 8/3.0 | 3,120 (+14%) | 14mo | $1,065,000 | $341 | 32 |
| 136 Pugsley Ave | 0.69mi | 8/5.0 | 3,054 (+12%) | 24mo | $1,200,000 | $393 | 20 |
Match score weights: distance 35% · size 25% · config 20% · recency 20%. Top-matched comps best support the ARV.
Projected returns pro-forma
-3.0% appreciation · 3.0% rent growth · sell at horizon
- IRR
- -6.6%
- Equity multiple
- 0.76×
- Total profit
- $-51,028
- Equity at exit
- $111,827
- IRR
- 3.1%
- Equity multiple
- 1.22×
- Total profit
- $46,802
- Equity at exit
- $64,846
Cash invested: $210,000 (down + closing). Projections, not guarantees.
Landlord ↔ Tenant lean methodology
- Overall (CITY)
- 0 Strongly Tenant-Friendly
- State New York
- 15 Strongly Tenant-Friendly · D+10
- County
- — inherits STATE
- City New York
- 0 Strongly Tenant-Friendly · D+34
ZIP-level market 10473
- Active inventory
- 141
- Price-to-rent
- 15.5×
Monthly cashflow live
- Estimated rent
- $8,043 medium interval (Pro) →
- Mortgage (P&I)
- −$3,933
- Tax est. 1.5%
- −$937 /mo · $11,250/yr
- Insurance
- −$312
- Flood insurance flood zone
- −$66 /mo · $798/yr
- HOA
- −$0
- Vacancy / Maint / Mgmt
- −$1,689
- Net cashflow
- $1,104
Break-even live
2-unit breakdown (identical units grouped — click to expand)
| Units | Beds | Baths | Est. rent |
|---|---|---|---|
| 2× units | 3 | 1.5 | $8,044 |
| #1 | 3 | 1.5 | $4,022 |
| #2 | 3 | 1.5 | $4,022 |
| Total (2 units) | $8,043 | ||
UW: 25.0% down · 7.5% · 30yr · 1.5% tax · 5.0% vac · 8.0% maint · 8.0% mgmt
Financing live
Cash to close
- Down payment
- $187,500
- Closing costs
- $22,500
- Reserves months
- —
- Total cash needed
- —
Loan-product check · same deal, 3 products live
Conventional
25% down · 7.5% · 30yr
- Down + closing
- —
- Monthly P&I
- —
- Monthly cashflow
- —
- DSCR
- —
- Eligible?
- —
Personal DTI + credit; lowest rate.
DSCR
20% down · 8.5% · 30yr
- Down + closing
- —
- Monthly P&I
- —
- Monthly cashflow
- —
- DSCR
- —
- Eligible?
- —
No personal income docs; deal must DSCR.
Hard money
10% down · 12.0% · 12mo
- Down + closing
- —
- Monthly P&I
- —
- Monthly cashflow
- —
- DSCR
- —
- Eligible?
- —
Short-term bridge; refi at stabilization.
Listing history 14 events
-
2026-06-18days on market $749,999 Active 42 DOM
-
2026-06-17days on market $749,999 Active 41 DOM
-
2026-06-16days on market $749,999 Active 40 DOM
-
2026-06-15days on market $749,999 Active 39 DOM
-
2026-06-13days on market $749,999 Active 37 DOM
-
2026-06-10days on market $749,999 Active 33 DOM
-
2026-06-08days on market $749,999 Active 32 DOM
-
2026-06-08days on market $749,999 Active 31 DOM
-
2026-06-04days on market $749,999 Active 28 DOM
-
2026-06-03days on market $749,999 Active 27 DOM
-
2026-06-01days on market $749,999 Active 25 DOM
-
2026-05-31days on market $749,999 Active 24 DOM
-
2026-05-08$749,999 Active
-
2026-05-05historical $749,999
ⓘ Source: listings_history table (triggers on properties + properties_extension) + one-shot
backfill from property_details.listing_events for pre-trigger history.
Climate risk First Street
- Flood 7/10 Severe FEMA zone X (shaded) · 78% chance over 30 yrs
- Wildfire 2/10 Low
- Heat 6/10 Major 7 d/yr ≥99°F today · 14 d/yr by 30 yrs out
- Wind 6/10 Major 27% chance of damaging wind over 30 yrs
- Air quality 4/10 Moderate 5 unhealthy d/yr today · 6 by 30 yrs out
Nearby sold comps map
Loading sold comps map…
Walkable amenities ~0.75 mi
Loading nearby amenities…
Taxation est. · year 1
- Rental income
- $96,516
- − Mortgage interest
- −$42,012
- − Property taxes
- −$11,250
- − Insurance
- −$4,547
- − Repairs & maintenance
- −$7,721
- − Management
- −$7,721
- − Depreciation
- −$21,818
- Taxable income
- $1,446
- Est. tax owed @ 24.0%
- −$347
- After-tax cash flow
- $12,906/yr
For passive investors: Depreciation is non-cash, so a rental often shows a tax loss while cash-flowing — sheltering income. Rental losses are passive: they offset passive income freely, and up to $25,000/yr can offset ordinary (W-2) income if you actively participate and your MAGI is under $100k (phasing out to $0 by $150k); unused losses carry forward. On sale, claimed depreciation is recaptured at up to 25%, and gains may owe capital-gains tax (a 1031 exchange can defer both). Figures are a year-1 estimate at your 24.0% rate — not tax advice; consult a CPA.
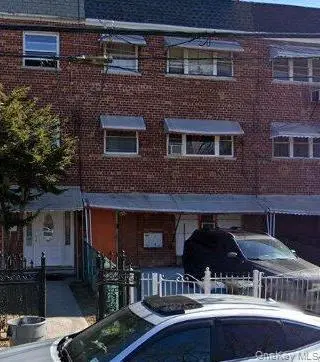
Condition & rehab AI · 1 photo
This two-family home requires significant exterior and interior repairs, including painting and landscaping, to improve its condition and value.
Repairs flagged
- Major exterior paint — Peeling paint
- Major exterior siding — Weathered brick
- Major interior paint — Peeling paint
- Major landscaping — Overgrown vegetation
Value-add opportunities
- Both exterior paint — Enhances curb appeal and property value
- Both landscaping — Improves curb appeal and property value
- Both interior paint — Enhances interior appearance and property value
Renovation cost estimate screening
| Repair item | Severity | Est. cost |
|---|---|---|
| exterior paint · Peeling paint | Major | $15,000–50,000 |
| exterior siding · Weathered brick | Major | $15,000–50,000 |
| interior paint · Peeling paint | Major | $15,000–50,000 |
| landscaping · Overgrown vegetation | Major | $15,000–50,000 |
| Total estimated repair cost · 4 items | $60,000–200,000 |
Value-add ROI direction
- Both exterior paint — Enhances curb appeal and property value ↑
- Both landscaping — Improves curb appeal and property value ↑
- Both interior paint — Enhances interior appearance and property value ↑
ⓘ Cost ranges are severity-bucket heuristics (US national rule-of-thumb). Get contractor quotes + a written scope before underwriting a rehab budget.
Schools (NCES district)
No district data.
Livability — New York
- Score
- 75/100
- State rank
- #268
- US rank
- #4188
Category grades
Schools grade is shown separately in the Schools card above.
Census & demographics
- Census place
- New York, NY
- County
- Bronx County · 1,197,324 people
- City population
- 7,731,280
- Metro
- New York-Newark-Jersey City, NY-NJ-PA
- Population (ZIP)
- 58,855
- Household income
- $52,462
- Rent vs Own
- Severe rent burden
- 3913.0
Population outlook (Bronx County) Hauer SSP2
- Today (2025)
- 1,607,353 people
- By 2030
- 1,681,852 · +4.6%
- By 2040
- 1,824,421 · +13.5%
- By 2050
- 1,945,470 · +21.0%
- By 2075
- 2,187,887 · +36.1%
- By 2100
- 2,244,136 · +39.6%
Race, ethnicity, and origin ACS 2023
- Neighborhood character
- Majority Hispanic (59%)
- Race & ethnicity
- Hispanic / Latino 59% Black 34% Two or more races 12% Asian 2% White 2%
- Hispanic origin (detail)
- Puerto Rican 31% Dominican 20%
- Common ancestry
- British 1%
- Foreign-born
- 23% · Canada, Jamaica
- Languages at home
- 51% English-only · Spanish 45% Other Indo-European 1% French/Haitian/Cajun 1%
Political lean MEDSL · Bronx
- 2024 margin
- Solid D (+45.4) · D 72.7% · R 27.3%
- 2008→2024 swing
- -32.3pp toward R · 2008: 77.8pp · 2024: 45.4pp
- All cycles
- 2024: D+45.4 2020: D+67.6 2016: D+79.1 2012: D+82.9 2008: D+77.8
Not yet ingested
- Civics
- —
Market trends
- HPI YoY
- ▼ -212.70%
- Current HPI
- 276.2941
- Rent YoY
- —
- Metro
- New York-Newark-Jersey City, NY-NJ-PA
- State GDP YoY
- ▲ 2.60%
- F500 in state
- 92
Industry mix (Fortune 500 HQ in NY)
| Industry | F500 HQs | Revenue |
|---|---|---|
| Financial Services | 10 | $950B |
|
||
| Consumer Goods | 9 | $162B |
|
||
| Insurance | 4 | $225B |
|
||
| Telecommunications | 2 | $144B |
|
||
| Pharmaceuticals | 2 | $112B |
|
||
| Media / Entertainment | 2 | $69B |
|
||
Price history
+0.0% since first listed2 events — show timeline
- 2026-05-08 Listed $749,999 OneKey® MLS as Distributed by MLS Grid
- 2026-05-05 Coming Soon $749,999 OneKey® MLS as Distributed by MLS Grid
Cash-flow waterfall
monthlySold comps — $/sqft
last 12 mo · ≤1 miLoading sold comps…