1161 Welsh Rd · Hatfield, PA
Flood risk 1/10 · Minimal
- FEMA flood zone
- X (unshaded)
- Chance of flooding over 30 yrs
- 0.0%
- Est. flood insurance / yr
- $473 – $860
Fire risk 1/10 · Minimal
- Est. fire insurance / yr
- $511 – $949
Heat risk 5/10 · Moderate
- Hot days now (above 99°F)
- 7 days/yr
- Hot days in 30 yrs
- 15 days/yr
Wind risk 6/10 · Moderate
- Chance of severe wind over 30 yrs
- 27.0%
Air-quality risk 3/10 · Minor
- Unhealthy air days now
- 3 days/yr
- Unhealthy air days in 30 yrs
- 5 days/yr
Risk factors via First Street. Map © Google.
Why this score? — see what drove the C grade
The composite is a weighted blend of 9 inputs, each scored 0–100. Each bar is that input's sub-score; the figure is the points it added to the 100-point composite (weight × sub-score).
- Cash flow +18.1/30.0
- ARV discount +15.0/15.0
- DSCR +5.7/10.0
- 1% rule +5.3/10.0
- Schools +5.2/10.0
- Livability +3.7/5.0
- Rent growth +3.3/5.0
- Condition / age +2.5/5.0
- Appreciation +0.0/10.0
$289,900
🖨 Deal sheet 📄 Offer letter ✓ Due diligence
Listing remarks MLS
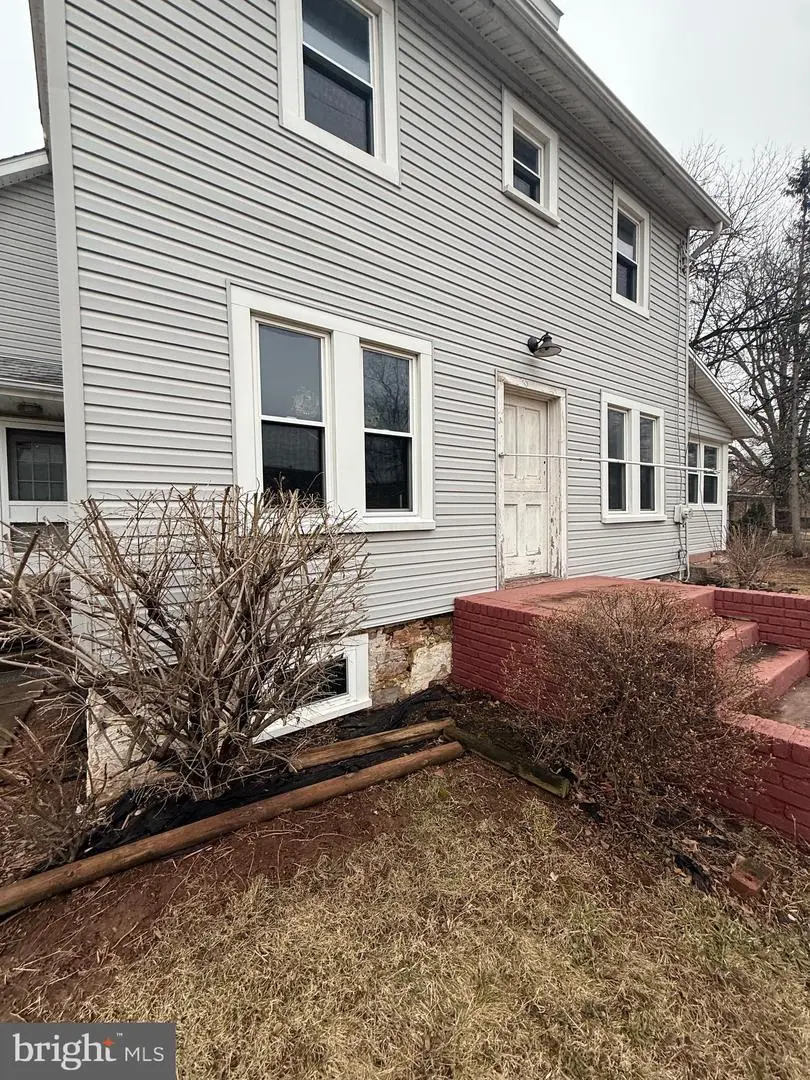
Handymans or contractors delight. Spacious Colonial home being sold in "As Is" "Where Is" condition. Tons of potential situated on a nice wooded lot with a detached 2 car garage. Home will need extensive renovations. No FHA or VA financing. Will accept cash or contruction aquisition loans only.
Key facts
- 0.5 acre lot
- 2 garage spots
- Built 1920
Property features AI
Exterior
- Parking: Detached oversized garage with two spaces; Driveway parking
- Home design: Detached structure
- Construction: Asbestos construction materials; Block foundation; Above-grade and below-grade structures
- Exterior features: Level lot with trees/wooded areas
Interior
- Kitchen: Built-in range
- Bedrooms: Five bedrooms on the upper level
- Bathrooms: Two full bathrooms; One half bathroom
- Interior features: Eat-in kitchen; Basement (other)
- Laundry & utility: Laundry on the main floor
Neighborhood map
What this means for you Summary
Snapshot
- This is a 5-bed/1.5-bath single-family listed at $290k.
Deal economics
- At list price, monthly cash flow is $257 ($3k/yr) — positive.
- The deal already cash-flows at list — no discount required.
- Meets the 1% rule at list price ($3k rent vs $290k).
- Recommended offer: $281k (3.0% below list) — sets the bar for market timing.
- Cap rate 7.4% vs local median 2.5% in Hatfield — top-decile yield for the area; either an underpriced asset or a hidden risk that comps aren't pricing in. Stress-test before assuming the spread holds.
Location & tenants
- Location reads 74/100 on livability (#477 in PA, #4,384 nationally) — a middle-class / working-renter tenant base. Strengths: crime A+, housing A, cost of living B+; Watch: amenities D, commute F.
- North Penn SD (suburban): math 48% / reading 67% proficiency, ranked #76 of 539 in PA (top 14%) — acceptable for families but not a draw, mixed tenant base, ~2y average lease; only 20% free/reduced lunch — higher-income household profile.
- Zoned schools: North Penn Shs (math 78% / reading 50%, grade B-, #67 of 437 statewide, top 15%, 3,184 students, 34% FRL).
- Market conditions: Rents rising (+3.1%/yr); 186 active listings in the ZIP; 1 comparable units currently listed for rent nearby; solid renter incomes; 1,936 units permitted in Montgomery County in 2024 (530 in 5+ unit buildings).
- This rent runs 34% of the median local income ($106k/yr) — at the standard rent-burdened threshold; future hikes will face affordability resistance.
Forward outlook
- Local home prices are declining (-3.0%/yr); year-one equity from $2k of loan paydown is wiped out by about $9k of value loss. Plan a longer hold.
- Montgomery County population projected at +5% by 2050 — modest demand growth; plan on rents tracking national, not racing it.
Negotiation context
- It's been on market 38 days — a 3% lower offer ($281k) is reasonable based on typical stale-listing flexibility.
- 5 sale attempts since 13y ago with the ask held roughly flat each time — persistent listings suggest the price (not the market) is what's stuck; bring a comps-based counter.
- Current owner paid $88k; list at $290k implies a 231% gain — meaningful room to come down on a strong offer.
Risks & watch-outs
- Watch-outs: built in 1920 — expect roof / HVAC / electrical / plumbing capex.
- Climate carrying-cost: major wind risk, 27% chance of damaging wind over 30y; extreme-heat days projected 7→15/yr by 2055 (HVAC capex compounding) — expect insurance premiums to compound above CPI over the hold.
Questions for the listing agent
- It's been on market 38 days. Have you received any prior offers? Is the seller open to a 3% concession, seller financing, or rate buy-down credit?
- Built in 1920 — when were the roof, HVAC, electrical panel, plumbing, and water heater last replaced?
- Is there a deadline driving the sale (1031 exchange, divorce, estate, relocation)? That informs how much negotiation room exists.
- Schools are B-rated — typically a magnet for longer-tenancy family renters. What's the average tenant stay here, and is there a school-zone premium baked into asking?
- What's the average days-on-market for RENTAL listings here right now (not sales)? A rising rental-DOM trend means longer vacancies and softer asking-rent achievability than the comps imply.
- What's the recent tenant-quality profile in this submarket — average credit score on applications, eviction rate, late-payment / NSF rate, and stable-employment percentage? A property-management company in the area should have these aggregated.
- How much new for-sale + rental construction is in the pipeline within 1–3 miles? Heavy new supply typically softens prices + rents 12–24 months out; constrained supply supports both.
Investment metrics
- 1% rule
- 1.03% ✓
- Cap rate
- 7.36%
- Cash-on-cash
- 3.80%
- DSCR
- 1.17
- GRM
- 8.1
CMA / ARV
- ARV (median comp)
- $481,345
- List price
- $289,900
- Delta
- -39.77%
- Verdict
- UNDERPRICED
- Comps
- 20 within 1.0 mi
Show comp detail 12 sales within ~0.75 mi
| Address | Dist | Beds/Ba | Sqft | Sold | Price | $/sf | Match |
|---|---|---|---|---|---|---|---|
| 256 Woodlawn Dr | 0.38mi | 4/2.5 (-1) | 2,037 (+4%) | 1mo | $512,000 | $251 | 66 |
| 217 Cherry Ln | 0.26mi | 4/2.5 (-1) | 2,117 (+8%) | 5mo | $377,300 | $178 | 62 |
| 228 Woodlawn Dr | 0.28mi | 4/2.5 (-1) | 1,838 (-6%) | 12mo | $525,000 | $286 | 57 |
| 545 Winding Rd | 0.50mi | 4/2.5 (-1) | 2,016 (+3%) | 7mo | $581,000 | $288 | 57 |
| 340 Central Dr | 0.38mi | 4/2.5 (-1) | 2,117 (+8%) | 6mo | $499,000 | $236 | 55 |
| 349 Central Dr | 0.40mi | 4/2.5 (-1) | 2,119 (+8%) | 9mo | $450,000 | $212 | 51 |
| 900 W Eighth | 0.57mi | 5/2.0 | 2,148 (+10%) | 8mo | $300,000 | $140 | 50 |
| 536 Oak Park Rd | 0.54mi | 4/2.5 (-1) | 1,896 (-3%) | 18mo | $555,000 | $293 | 45 |
| 308 Central Dr | 0.27mi | 4/2.5 (-1) | 1,698 (-14%) | 14mo | $501,000 | $295 | 44 |
| 712 Abbey Ln | 0.48mi | 4/2.5 (-1) | 1,786 (-9%) | 19mo | $450,000 | $252 | 38 |
| 1333 Pickwick Ln | 0.73mi | 4/2.5 (-1) | 2,132 (+9%) | 20mo | $550,000 | $258 | 26 |
| 512 W Mount Vernon St | 0.70mi | 4/2.5 (-1) | 2,246 (+14%) | 17mo | $630,000 | $280 | 20 |
Match score weights: distance 35% · size 25% · config 20% · recency 20%. Top-matched comps best support the ARV.
Projected returns pro-forma
-3.0% appreciation · 3.08% rent growth · sell at horizon
- IRR
- -10.2%
- Equity multiple
- 0.63×
- Total profit
- $-30,247
- Equity at exit
- $43,225
- IRR
- -0.7%
- Equity multiple
- 0.95×
- Total profit
- $-3,813
- Equity at exit
- $25,065
Cash invested: $81,172 (down + closing). Projections, not guarantees.
Landlord ↔ Tenant lean methodology
- Overall (STATE)
- 62 Landlord-Friendly
- State Pennsylvania
- 62 Landlord-Friendly · EVEN
- County
- — inherits STATE
- City
- — inherits STATE
ZIP-level market 19446
- Rents YoY
- 3.1%
- Active inventory
- 186
- Price-to-rent
- 8.1×
Monthly cashflow live
- Estimated rent
- $2,994 medium interval (Pro) →
- Mortgage (P&I)
- −$1,520
- Tax from tax record
- −$467 /mo · $5,606/yr
- Insurance
- −$121
- HOA
- −$0
- Vacancy / Maint / Mgmt
- −$629
- Net cashflow
- $257
Break-even live
UW: 25.0% down · 7.5% · 30yr · 1.5% tax · 5.0% vac · 8.0% maint · 8.0% mgmt
Financing live
Cash to close
- Down payment
- $72,475
- Closing costs
- $8,697
- Reserves months
- —
- Total cash needed
- —
Loan-product check · same deal, 3 products live
Conventional
25% down · 7.5% · 30yr
- Down + closing
- —
- Monthly P&I
- —
- Monthly cashflow
- —
- DSCR
- —
- Eligible?
- —
Personal DTI + credit; lowest rate.
DSCR
20% down · 8.5% · 30yr
- Down + closing
- —
- Monthly P&I
- —
- Monthly cashflow
- —
- DSCR
- —
- Eligible?
- —
No personal income docs; deal must DSCR.
Hard money
10% down · 12.0% · 12mo
- Down + closing
- —
- Monthly P&I
- —
- Monthly cashflow
- —
- DSCR
- —
- Eligible?
- —
Short-term bridge; refi at stabilization.
Rent comps 1 comps
| Address | Beds | Baths | Sqft | Rent | $/sqft | DOM | Units | Dist |
|---|---|---|---|---|---|---|---|---|
| 113 Dragon Dr Unit 113 Lansdale, PA | 4.0 | 3.0 | 2080 | $3,400 | $1.63 | 2d | 1 | 1.29mi |
Listing history 25 events
-
2026-06-17status $289,900 Pending 38 DOM
-
2026-06-17days on market $289,900 Active 38 DOM
-
2026-06-16days on market $289,900 Active 37 DOM
-
2026-06-15days on market $289,900 Active 36 DOM
-
2026-06-13days on market $289,900 Active 34 DOM
-
2026-06-13days on market $289,900 Active 33 DOM
-
2026-06-09days on market $289,900 Active 30 DOM
-
2026-06-08days on market $289,900 Active 29 DOM
-
2026-06-07days on market $289,900 Active 28 DOM
-
2026-06-03days on market $289,900 Active 24 DOM
-
2026-06-02days on market $289,900 Active 23 DOM
-
2026-06-02price $289,900 Active 22 DOM
-
2026-06-01days on market $299,900 Active 22 DOM
-
2026-05-31days on market $299,900 Active 21 DOM
-
2026-05-18historical
-
2026-05-06$299,900 Active
-
2022-02-03price $1,785
-
2013-08-22soldstatus $87,500
-
2013-08-15soldstatus $87,500 315-char remark
Show marketing remark (315 chars)
Handymans or contractors delight. Spacious Colonial home being sold in "As Is" "Where Is" condition. Tons of potential situated on a nice wooded lot with a detached 2 car garage. Home will need extensive renovations. No FHA or VA financing. Will accept cash or contruction aquisition loans only.
-
2013-08-15soldstatus $87,500 Sold
Show marketing remark (315 chars)
Handymans or contractors delight. Spacious Colonial home being sold in "As Is" "Where Is" condition. Tons of potential situated on a nice wooded lot with a detached 2 car garage. Home will need extensive renovations. No FHA or VA financing. Will accept cash or contruction aquisition loans only.
-
2013-07-11status Under Contract
Show marketing remark (315 chars)
Handymans or contractors delight. Spacious Colonial home being sold in "As Is" "Where Is" condition. Tons of potential situated on a nice wooded lot with a detached 2 car garage. Home will need extensive renovations. No FHA or VA financing. Will accept cash or contruction aquisition loans only.
-
2013-07-11historical 315-char remark
Show marketing remark (315 chars)
Handymans or contractors delight. Spacious Colonial home being sold in "As Is" "Where Is" condition. Tons of potential situated on a nice wooded lot with a detached 2 car garage. Home will need extensive renovations. No FHA or VA financing. Will accept cash or contruction aquisition loans only.
-
2013-05-17$129,975 Active
Show marketing remark (315 chars)
Handymans or contractors delight. Spacious Colonial home being sold in "As Is" "Where Is" condition. Tons of potential situated on a nice wooded lot with a detached 2 car garage. Home will need extensive renovations. No FHA or VA financing. Will accept cash or contruction aquisition loans only.
-
2013-05-17$129,975 315-char remark
Show marketing remark (315 chars)
Handymans or contractors delight. Spacious Colonial home being sold in "As Is" "Where Is" condition. Tons of potential situated on a nice wooded lot with a detached 2 car garage. Home will need extensive renovations. No FHA or VA financing. Will accept cash or contruction aquisition loans only.
-
1973-03-09soldstatus $28,500
ⓘ Source: listings_history table (triggers on properties + properties_extension) + one-shot
backfill from property_details.listing_events for pre-trigger history.
Tax reassessment forecast PA · Partial reset (capped growth)
- Current annual tax
- $5,606 · $467/mo
- Projected year-2 tax
- $5,606 · $467/mo
- Expected delta
- $0/yr ($0/mo · 0.0%)
ⓘ Screening estimate from a state-policy table — verify with the county assessor before closing.
Climate risk First Street
- Flood 1/10 Low FEMA zone X (unshaded) · 0% chance over 30 yrs
- Wildfire 1/10 Low
- Heat 5/10 Major 7 d/yr ≥99°F today · 15 d/yr by 30 yrs out
- Wind 6/10 Major 27% chance of damaging wind over 30 yrs
- Air quality 3/10 Moderate 3 unhealthy d/yr today · 5 by 30 yrs out
Nearby sold comps map
Loading sold comps map…
Walkable amenities ~0.75 mi
Loading nearby amenities…
Taxation est. · year 1
- Rental income
- $35,929
- − Mortgage interest
- −$16,239
- − Property taxes
- −$5,606
- − Insurance
- −$1,450
- − Repairs & maintenance
- −$2,874
- − Management
- −$2,874
- − Depreciation
- −$8,433
- Taxable loss
- −$1,547
- Est. tax savings @ 24.0%
- +$371
- After-tax cash flow
- $3,457/yr
For passive investors: Depreciation is non-cash, so a rental often shows a tax loss while cash-flowing — sheltering income. Rental losses are passive: they offset passive income freely, and up to $25,000/yr can offset ordinary (W-2) income if you actively participate and your MAGI is under $100k (phasing out to $0 by $150k); unused losses carry forward. On sale, claimed depreciation is recaptured at up to 25%, and gains may owe capital-gains tax (a 1031 exchange can defer both). Figures are a year-1 estimate at your 24.0% rate — not tax advice; consult a CPA.
Schools (NCES district)
- District
- North Penn SD
- NCES district ID
- 4217280
- Math proficiency
- 48% ▼ -10.00%
- Reading proficiency
- 67% ▼ -9.00%
- Median HH income
- $76,866
- Composite
- 51.5/100
- National rank
- #1722
- State rank
- #76 of 539 in PA
Livability — Hatfield
- Score
- 74/100
- State rank
- #477
- US rank
- #4384
Category grades
Schools grade is shown separately in the Schools card above.
Census & demographics
- County
- Montgomery County · 712,331 people
- City population
- 19,431
- Metro
- Philadelphia-Camden-Wilmington, PA-NJ-DE-MD
- Population (ZIP)
- 61,848
- Household income
- $106,310
- Rent vs Own
- Severe rent burden
- 1930.0
Population outlook (Montgomery County) Hauer SSP2
- Today (2025)
- 856,074 people
- By 2030
- 870,887 · +1.7%
- By 2040
- 891,195 · +4.1%
- By 2050
- 896,417 · +4.7%
- By 2075
- 903,212 · +5.5%
- By 2100
- 843,240 · -1.5%
Race, ethnicity, and origin ACS 2023
- Neighborhood character
- Predominantly White (71%)
- Race & ethnicity
- White 71% Asian 14% Black 7% Two or more races 4% Hispanic / Latino 4%
- Common ancestry
- Romanian 5% Slovak 2% Scotch-Irish 1%
- Foreign-born
- 16% · Canada, South Korea, China
- Languages at home
- 81% English-only · Other Indo-European 6% Spanish 2% Korean 2%
Political lean MEDSL · Montgomery
- 2024 margin
- Strong D (+22.8) · D 60.9% · R 38.1% · Other 1.1%
- 2008→2024 swing
- +2.0pp toward D · 2008: 20.8pp · 2024: 22.8pp
- All cycles
- 2024: D+22.8 2020: D+26.3 2016: D+21.1 2012: D+14.3 2008: D+20.8
Not yet ingested
- Civics
- —
Market trends
- HPI YoY
- ▼ -340.90%
- Current HPI
- 279.3557
- Rent YoY
- ▲ 3.08%
- Metro
- Philadelphia-Camden-Wilmington, PA-NJ-DE-MD
- State GDP YoY
- ▲ 1.68%
- F500 in state
- 34
Industry mix (Fortune 500 HQ in PA)
| Industry | F500 HQs | Revenue |
|---|---|---|
| Healthcare | 2 | $309B |
|
||
| Insurance | 2 | $27B |
|
||
| Telecommunications / Media | 1 | $124B |
|
||
| Industrial Distribution | 1 | $22B |
|
||
| Financial Services | 1 | $20B |
|
||
| Chemicals / Materials | 1 | $18B |
|
||
Price history
+917.2% since first listed16 events — show timeline
- 2026-06-17 Pending — BRIGHT MLS
- 2026-06-01 Price Changed $289,900 BRIGHT MLS
- 2026-05-22 Relisted — BRIGHT MLS
- 2026-05-20 Pending — BRIGHT MLS
- 2026-05-20 Relisted — BRIGHT MLS
- 2026-05-18 Listing Removed — BRIGHT MLS
- 2026-05-06 Listed $299,900 BRIGHT MLS
- 2022-02-03 Price Changed $1,785 RENT.
- 2013-08-22 Sold (Public Records) $87,500 Public Records
- 2013-08-15 Sold (MLS) $87,500 TREND
- 2013-08-15 Sold (MLS) $87,500 BRIGHT MLS
- 2013-07-11 Pending — TREND
- 2013-07-11 Listing Removed — BRIGHT MLS
- 2013-05-17 Listed $129,975 TREND
- 2013-05-17 Listed $129,975 BRIGHT MLS
- 1973-03-09 Sold (Public Records) $28,500 Public Records
Property tax history
+3.1%/yrLatest (2026): $5,606 · +3.7% YoY. Source: county tax records.
Cash-flow waterfall
monthlySold comps — $/sqft
last 12 mo · ≤1 miLoading sold comps…