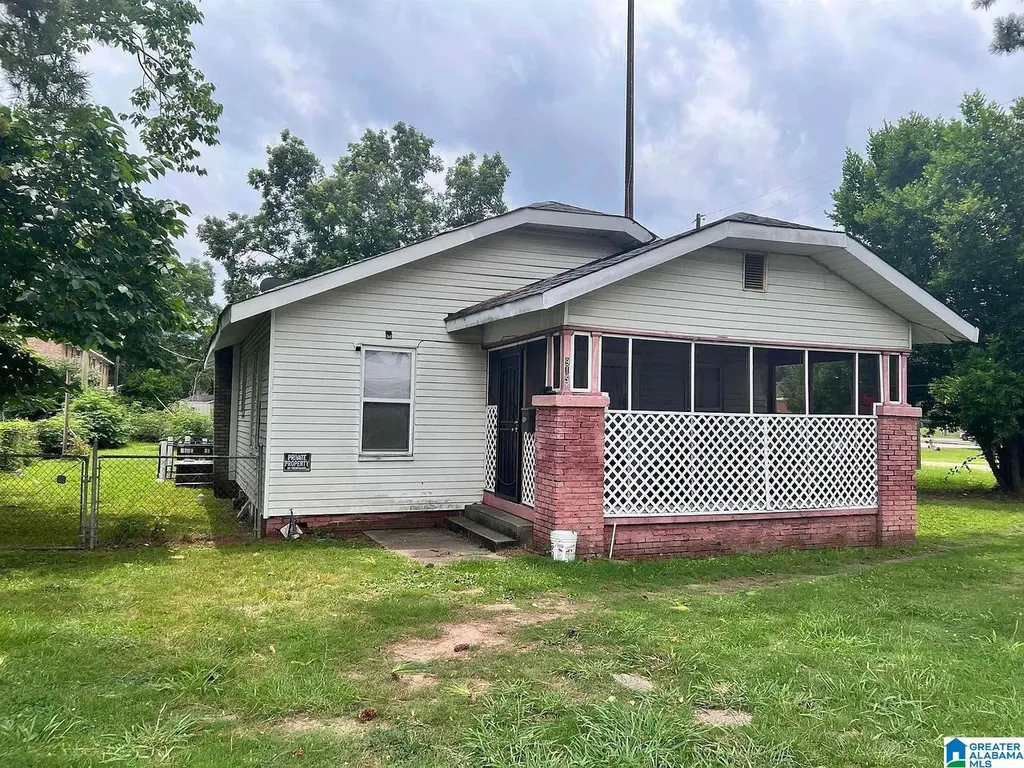
915 38th St · Birmingham, AL
Flood risk 6/10 · Moderate
- FEMA flood zone
- X (unshaded)
- Chance of flooding over 30 yrs
- 0.73%
- Est. flood insurance / yr
- $507 – $1,088
Fire risk 1/10 · Minimal
- Est. fire insurance / yr
- $916 – $1,700
Heat risk 7/10 · Major
- Hot days now (above 107°F)
- 7 days/yr
- Hot days in 30 yrs
- 20 days/yr
Wind risk 6/10 · Moderate
- Chance of severe wind over 30 yrs
- 27.0%
Air-quality risk 4/10 · Minor
- Unhealthy air days now
- 5 days/yr
- Unhealthy air days in 30 yrs
- 5 days/yr
Risk factors via First Street. Map © Google.
Why this score? — see what drove the C grade
The composite is a weighted blend of 9 inputs, each scored 0–100. Each bar is that input's sub-score; the figure is the points it added to the 100-point composite (weight × sub-score).
- Cash flow +26.4/30.0
- DSCR +9.0/10.0
- 1% rule +7.0/10.0
- Appreciation +4.2/10.0
- Livability +3.4/5.0
- Rent growth +2.5/5.0
- Condition / age +2.5/5.0
- Schools +0.9/10.0
- ARV discount +0.0/15.0
$90,000
🖨 Deal sheet 📄 Offer letter ✓ Due diligence
Listing remarks MLS
ATTN INVESTORS! Welcome to 915 38th St, this turn key 3bd 1ba home is ready for its next owner, add to your portfolio today!
Key facts
- 6,969 sq ft lot
- Built 1935
- Listed 33 days
Neighborhood map
What this means for you Summary
Snapshot
- This is a 3-bed/1.0-bath single-family listed at $90k.
Deal economics
- At list price, monthly cash flow is $235 ($3k/yr) — positive.
- The deal already cash-flows at list — no discount required.
- Meets the 1% rule at list price ($1k rent vs $90k).
- Recommended offer: $87k (3.0% below list) — sets the bar for market timing.
- Cap rate 9.4% vs local median 6.2% in Birmingham — top-decile yield for the area; either an underpriced asset or a hidden risk that comps aren't pricing in. Stress-test before assuming the spread holds.
Location & tenants
- Location reads 67/100 on livability (#78 in AL) — a middle-class / working-renter tenant base. Strengths: commute A+, cost of living A+, housing A+; Watch: amenities C-, schools F, crime F.
- Birmingham City (urban): math 4% / reading 20% proficiency, ranked #116 of 129 in AL (top 90%) — low school quality limits family demand, transient renter base, plan for 1-2y turnover; 82% free/reduced lunch — lower-income household profile, screen leases tightly.
- Market conditions: 50 active listings in the ZIP; 40 comparable units currently listed for rent nearby; rentals lingering (median 44d on market — plan ~5-8 weeks vacancy on turnover, expect pricing pressure); 60% of comp listings sitting > 30 days — soft ceiling on asking rent; lower-income renter base — watch delinquency; 2,114 units permitted in Jefferson County in 2024 (556 in 5+ unit buildings).
- This rent runs 42% of the median local income ($31k/yr) — at the standard rent-burdened threshold; future hikes will face affordability resistance.
Forward outlook
- Local home prices are declining (-1.5%/yr); year-one equity from $622 of loan paydown is wiped out by about $1k of value loss. Plan a longer hold.
- Jefferson County population projected to shrink 4% by 2050 — rents likely to lag national; underwrite the cash flow, not the appreciation.
- At projected returns (-1.5% appreciation + 3.0% rent growth), your $25k cash investment doubles in ~8 years — after that, you're playing with house money.
Negotiation context
- It's been on market 33 days — a 3% lower offer ($87k) is reasonable based on typical stale-listing flexibility.
- 3 sale attempts since 3y ago with the ask held roughly flat each time — persistent listings suggest the price (not the market) is what's stuck; bring a comps-based counter.
Risks & watch-outs
- Watch-outs: built in 1935 — expect roof / HVAC / electrical / plumbing capex.
- Climate carrying-cost: major flood risk; major wind risk, 27% chance of damaging wind over 30y; extreme-heat days projected 7→20/yr by 2055 (HVAC capex compounding) — expect insurance premiums to compound above CPI over the hold.
Questions for the listing agent
- It's been on market 33 days. Have you received any prior offers? Is the seller open to a 3% concession, seller financing, or rate buy-down credit?
- Built in 1935 — when were the roof, HVAC, electrical panel, plumbing, and water heater last replaced?
- Is there a deadline driving the sale (1031 exchange, divorce, estate, relocation)? That informs how much negotiation room exists.
- Schools are F-rated, which usually means shorter tenancies and higher turnover. Who's the typical renter profile here, and what's been the actual vacancy rate?
- Crime grade is F in this area — have there been break-ins, vandalism, or insurance claims at this property in the last 3 years? What carrier currently insures it and at what premium?
- What's the average days-on-market for RENTAL listings here right now (not sales)? A rising rental-DOM trend means longer vacancies and softer asking-rent achievability than the comps imply.
- What's the recent tenant-quality profile in this submarket — average credit score on applications, eviction rate, late-payment / NSF rate, and stable-employment percentage? A property-management company in the area should have these aggregated.
- How much new for-sale + rental construction is in the pipeline within 1–3 miles? Heavy new supply typically softens prices + rents 12–24 months out; constrained supply supports both.
Investment metrics
- 1% rule
- 1.20% ✓
- Cap rate
- 9.43%
- Cash-on-cash
- 11.21%
- DSCR
- 1.50
- GRM
- 7.0
CMA / ARV
- ARV (median comp)
- $74,642
- List price
- $90,000
- Delta
- 20.57%
- Verdict
- OVERPRICED
- Comps
- 20 within 1.0 mi
Show comp detail 12 sales within ~0.75 mi
| Address | Dist | Beds/Ba | Sqft | Sold | Price | $/sf | Match |
|---|---|---|---|---|---|---|---|
| 1031 40th St | 0.21mi | 3/1.0 | 1,130 (+1%) | 1mo | $76,000 | $67 | 88 |
| 940 47th Street Ensley | 0.61mi | 3/1.0 | 1,100 (-2%) | 0mo | $49,000 | $45 | 68 |
| 1205 41st Street Ensley | 0.41mi | 3/1.0 | 1,204 (+8%) | 2mo | $125,000 | $104 | 67 |
| 3112 Avenue F | 0.42mi | 3/1.0 | 1,024 (-9%) | 5mo | $74,000 | $72 | 61 |
| 1414 27th St | 0.65mi | 3/1.0 | 1,170 (+4%) | 4mo | $50,000 | $43 | 59 |
| 821 46th St | 0.58mi | 3/1.0 | 1,254 (+12%) | 0mo | $116,000 | $93 | 53 |
| 1515 35th St | 0.67mi | 3/1.5 | 1,205 (+8%) | 1mo | $80,000 | $66 | 53 |
| 1112 47th St | 0.70mi | 2/1.0 (-1) | 1,166 (+4%) | 5mo | $83,000 | $71 | 52 |
| 1429 33rd Street Ensley | 0.58mi | 2/1.0 (-1) | 1,016 (-9%) | 2mo | $45,000 | $44 | 51 |
| 314 43rd St | 0.68mi | 2/1.0 (-1) | 1,068 (-5%) | 5mo | $53,500 | $50 | 51 |
| 513 Lloyd Noland Pkwy | 0.66mi | 3/1.5 | 1,212 (+8%) | 3mo | $77,900 | $64 | 51 |
| 1516 32nd St | 0.68mi | 2/1.0 (-1) | 1,028 (-8%) | 4mo | $57,000 | $55 | 46 |
Match score weights: distance 35% · size 25% · config 20% · recency 20%. Top-matched comps best support the ARV.
Projected returns pro-forma
-1.54% appreciation · 3.0% rent growth · sell at horizon
- IRR
- 5.6%
- Equity multiple
- 1.24×
- Total profit
- $6,063
- Equity at exit
- $19,416
- IRR
- 12.7%
- Equity multiple
- 2.18×
- Total profit
- $29,788
- Equity at exit
- $18,481
Cash invested: $25,200 (down + closing). Projections, not guarantees.
Landlord ↔ Tenant lean methodology
- Overall (STATE)
- 90 Strongly Landlord-Friendly
- State Alabama
- 90 Strongly Landlord-Friendly · R+15
- County
- — inherits STATE
- City
- — inherits STATE
ZIP-level market 35218
- Home prices YoY
- -0.9%
- Active inventory
- 50
- Price-to-rent
- 7.0×
Monthly cashflow live
- Estimated rent
- $1,076 high interval (Pro) →
- Mortgage (P&I)
- −$472
- Tax from tax record
- −$105 /mo · $1,257/yr
- Insurance
- −$38
- HOA
- −$0
- Vacancy / Maint / Mgmt
- −$226
- Net cashflow
- $235
Break-even live
UW: 25.0% down · 7.5% · 30yr · 1.5% tax · 5.0% vac · 8.0% maint · 8.0% mgmt
Financing live
Cash to close
- Down payment
- $22,500
- Closing costs
- $2,700
- Reserves months
- —
- Total cash needed
- —
Loan-product check · same deal, 3 products live
Conventional
25% down · 7.5% · 30yr
- Down + closing
- —
- Monthly P&I
- —
- Monthly cashflow
- —
- DSCR
- —
- Eligible?
- —
Personal DTI + credit; lowest rate.
DSCR
20% down · 8.5% · 30yr
- Down + closing
- —
- Monthly P&I
- —
- Monthly cashflow
- —
- DSCR
- —
- Eligible?
- —
No personal income docs; deal must DSCR.
Hard money
10% down · 12.0% · 12mo
- Down + closing
- —
- Monthly P&I
- —
- Monthly cashflow
- —
- DSCR
- —
- Eligible?
- —
Short-term bridge; refi at stabilization.
Rent comps 40 comps
| Address | Beds | Baths | Sqft | Rent | $/sqft | DOM | Units | Dist |
|---|---|---|---|---|---|---|---|---|
| 3517 Avenue F Birmingham, AL | 3.0 | 2.0 | 1155 | $1,200 | $1.04 | 44d | 1 | 0.31mi |
| 931 41st Street Ensley Birmingham, AL | 2.0 | 1.5 | 1048 | $995 | $0.95 | 3d | 1 | 0.31mi |
| 3100 Avenue J Birmingham, AL | 3.0 | 1.0 | 1409 | $1,000 | $0.71 | 10d | 1 | 0.31mi |
| 708 40th St Fairfield, AL | 2.0 | 1.0 | 788 | $650 | $0.82 | 44d | 1 | 0.32mi |
| 3212 Avenue G Unit G Ensley, AL | 2.0 | 1.0 | 902 | $850 | $0.94 | 44d | 1 | 0.34mi |
| 1309 41st St Fairfield, AL | 3.0 | 1.0 | 1070 | $1,200 | $1.12 | 44d | 1 | 0.37mi |
| 728 41st St Fairfield, AL | 3.0 | 1.0 | 1316 | $1,100 | $0.84 | 44d | 1 | 0.39mi |
| 1301 32nd Street Ensley Birmingham, AL | 3.0 | 1.0 | 1200 | $975 | $0.81 | 44d | 1 | 0.41mi |
| 1306 35th Street Ensley Birmingham, AL | 3.0 | 2.0 | 1100 | $1,173 | $1.07 | 3d | 1 | 0.42mi |
| 1313 Pike Rd Birmingham, AL | 3.0 | 1.0 | 1437 | $975 | $0.68 | 44d | 1 | 0.43mi |
| 2908 Avenue I Unit I Ensley, AL | 3.0 | 1.0 | 1383 | $1,025 | $0.74 | 23d | 1 | 0.45mi |
| 3201 Avenue E Birmingham, AL | 3.0 | 1.0 | 1056 | $925 | $0.88 | 44d | 1 | 0.46mi |
| 621 Valley Rd Fairfield, AL | 2.0 | 1.0 | 935 | $900 | $0.96 | 44d | 1 | 0.48mi |
| 518 41st St Fairfield, AL | 3.0 | 2.0 | 1095 | $1,200 | $1.10 | 44d | 1 | 0.49mi |
| 1417 34th Street Ensley Birmingham, AL | 3.0 | 1.0 | 1103 | $1,025 | $0.93 | 44d | 1 | 0.52mi |
| 1420 Warrior Rd Birmingham, AL | 3.0 | 1.0 | 1061 | $1,050 | $0.99 | 44d | 1 | 0.55mi |
| 813 46th St Fairfield, AL | 2.0 | 1.0 | 1100 | $825 | $0.75 | 10d | 1 | 0.58mi |
| 1429 Warrior Rd Birmingham, AL | 3.0 | 1.0 | 1036 | $850 | $0.82 | 16d | 1 | 0.58mi |
| 920 47th Street Ensley Birmingham, AL | 3.0 | 1.0 | 1070 | $895 | $0.84 | 3d | 1 | 0.59mi |
| 2617 Avenue K Birmingham, AL | 4.0 | 2.0 | 1046 | $1,495 | $1.43 | 1d | 1 | 0.62mi |
| 3011 Avenue D Birmingham, AL | 2.0 | 1.0 | 1000 | $795 | $0.80 | 44d | 1 | 0.64mi |
| 5001 Farrell Ave Fairfield, AL | 2.0 | 1.0 | 1218 | $995 | $0.82 | 44d | 1 | 0.64mi |
| 3015 Avenue C Unit C Birmingham, AL | 2.0 | 1.0 | 1000 | $825 | $0.82 | 44d | 1 | 0.64mi |
| 1520 33rd Street Ensley Birmingham, AL | 4.0 | 2.0 | 1215 | $1,275 | $1.05 | 12d | 1 | 0.66mi |
| 1037 47th Street Ensley Unit ENSLEY Birmingham, AL | 3.0 | 2.0 | 1299 | $1,000 | $0.77 | 44d | 1 | 0.66mi |
| 1524 33rd Street Ensley Birmingham, AL | 4.0 | 2.0 | 1222 | $1,095 | $0.90 | 21d | 1 | 0.66mi |
| 1528 34th Street Ensley Birmingham, AL | 3.0 | 2.0 | 972 | $1,073 | $1.10 | 44d | 1 | 0.67mi |
| 1501 29th Street Ensley Birmingham, AL | 2.0 | 1.0 | 772 | $800 | $1.04 | 23d | 1 | 0.68mi |
| 2520 Avenue L Unit A Birmingham, AL | 4.0 | 1.5 | 1260 | $1,150 | $0.91 | 23d | 1 | 0.68mi |
| 1112 47th St W Birmingham, AL | 2.0 | 1.0 | 1166 | $975 | $0.84 | 44d | 1 | 0.68mi |
| 1520 41st Street Ensley Birmingham, AL | 3.0 | 2.0 | 1068 | $1,195 | $1.12 | 44d | 1 | 0.68mi |
| 518 Oak Pl Fairfield, AL | 3.0 | 1.0 | 1236 | $875 | $0.71 | 19d | 1 | 0.69mi |
| 1532 31st Street Ensley Birmingham, AL | 2.0 | 1.0 | 839 | $850 | $1.01 | 44d | 1 | 0.71mi |
| 1436 44th Street Ensley Unit ENSLEY Birmingham, AL | 4.0 | 2.0 | 1435 | $1,495 | $1.04 | 1d | 1 | 0.71mi |
| 513 Oak Pl Fairfield, AL | 4.0 | 2.0 | 1440 | $1,300 | $0.90 | 23d | 1 | 0.72mi |
| 1540 42nd Street Ensley Unit ENSLEY Birmingham, AL | 2.0 | 1.0 | 899 | $1,037 | $1.15 | 44d | 1 | 0.75mi |
| 1410 46th Street Ensley Unit ENSLEY Birmingham, AL | 3.0 | 1.0 | 1200 | $1,000 | $0.83 | 44d | 1 | 0.76mi |
| 1509 44th Street Ensley Unit ENSLEY Birmingham, AL | 3.0 | 1.5 | 1260 | $1,123 | $0.89 | 12d | 1 | 0.77mi |
| 1545 29th Street Ensley Birmingham, AL | 3.0 | 1.5 | 1331 | $1,200 | $0.90 | 44d | 1 | 0.77mi |
| 4716 Court M Birmingham, AL | 4.0 | 1.0 | 932 | $1,200 | $1.29 | 44d | 1 | 0.78mi |
Listing history 18 events
-
2026-06-18days on market $90,000 Active 33 DOM
-
2026-06-17days on market $90,000 Active 32 DOM
-
2026-06-16status $90,000 Active 31 DOM
-
2026-06-13statusdays on market $90,000 Pending 31 DOM
-
2026-06-10days on market $90,000 Active 30 DOM
-
2026-06-09days on market $90,000 Active 29 DOM
-
2026-06-08days on market $90,000 Active 28 DOM
-
2026-06-07days on market $90,000 Active 27 DOM
-
2026-06-03days on market $90,000 Active 23 DOM
-
2026-06-02status $90,000 Active 22 DOM
-
2026-05-07status Active 124-char remark
Show marketing remark (124 chars)
ATTN INVESTORS! Welcome to 915 38th St, this turn key 3bd 1ba home is ready for its next owner, add to your portfolio today!
-
2026-04-28status Pending 124-char remark
Show marketing remark (124 chars)
ATTN INVESTORS! Welcome to 915 38th St, this turn key 3bd 1ba home is ready for its next owner, add to your portfolio today!
-
2026-04-19$90,000 Active 124-char remark
Show marketing remark (124 chars)
ATTN INVESTORS! Welcome to 915 38th St, this turn key 3bd 1ba home is ready for its next owner, add to your portfolio today!
-
2023-10-04soldstatus $530,000
-
2023-10-02soldstatus $66,250 Sold 657-char remark
Show marketing remark (657 chars)
Don't miss this excellent investment opportunity to bolster your portfolio! Three -bedroom, one-bath property, currently with a Section 8 tenant already in place. Tenant remains Rented for $750 per month. Rent roll in documents. Can be purchased separate or as a part of an 8 pack of properties in close proximity. All sold with tenants in place. Cannot be shown until under contract for inspection. Monthly rental total for all 8 properties - $6,146 Addresses: 1) 1304 Ave G, 2) 3012 Anniston Ave, 3) 2318 Ave H, 4) 4717 Terrace M, 5) 5720 Court I 6) 1143 41st Street 7) 4720 Court M. Experience the ease of passive income with a consistent rental stream.
-
2023-08-04historical Contingent 657-char remark
Show marketing remark (657 chars)
Don't miss this excellent investment opportunity to bolster your portfolio! Three -bedroom, one-bath property, currently with a Section 8 tenant already in place. Tenant remains Rented for $750 per month. Rent roll in documents. Can be purchased separate or as a part of an 8 pack of properties in close proximity. All sold with tenants in place. Cannot be shown until under contract for inspection. Monthly rental total for all 8 properties - $6,146 Addresses: 1) 1304 Ave G, 2) 3012 Anniston Ave, 3) 2318 Ave H, 4) 4717 Terrace M, 5) 5720 Court I 6) 1143 41st Street 7) 4720 Court M. Experience the ease of passive income with a consistent rental stream.
-
2023-07-31$69,900 Active 657-char remark
Show marketing remark (657 chars)
Don't miss this excellent investment opportunity to bolster your portfolio! Three -bedroom, one-bath property, currently with a Section 8 tenant already in place. Tenant remains Rented for $750 per month. Rent roll in documents. Can be purchased separate or as a part of an 8 pack of properties in close proximity. All sold with tenants in place. Cannot be shown until under contract for inspection. Monthly rental total for all 8 properties - $6,146 Addresses: 1) 1304 Ave G, 2) 3012 Anniston Ave, 3) 2318 Ave H, 4) 4717 Terrace M, 5) 5720 Court I 6) 1143 41st Street 7) 4720 Court M. Experience the ease of passive income with a consistent rental stream.
-
1993-07-27soldstatus $28,000
ⓘ Source: listings_history table (triggers on properties + properties_extension) + one-shot
backfill from property_details.listing_events for pre-trigger history.
Tax reassessment forecast AL · Resets to sale price
- Current annual tax
- $1,257 · $105/mo
- Projected year-2 tax
- $1,257 · $105/mo
- Expected delta
- $0/yr ($0/mo · 0.0%)
ⓘ Screening estimate from a state-policy table — verify with the county assessor before closing.
Climate risk First Street
- Flood 6/10 Major FEMA zone X (unshaded) · 73% chance over 30 yrs
- Wildfire 1/10 Low
- Heat 7/10 Severe 7 d/yr ≥107°F today · 20 d/yr by 30 yrs out
- Wind 6/10 Major 27% chance of damaging wind over 30 yrs
- Air quality 4/10 Moderate 5 unhealthy d/yr today · 5 by 30 yrs out
Nearby sold comps map
Loading sold comps map…
Walkable amenities ~0.75 mi
Loading nearby amenities…
Taxation est. · year 1
- Rental income
- $12,907
- − Mortgage interest
- −$5,041
- − Property taxes
- −$1,257
- − Insurance
- −$450
- − Repairs & maintenance
- −$1,033
- − Management
- −$1,033
- − Depreciation
- −$2,618
- Taxable income
- $1,475
- Est. tax owed @ 24.0%
- −$354
- After-tax cash flow
- $2,472/yr
For passive investors: Depreciation is non-cash, so a rental often shows a tax loss while cash-flowing — sheltering income. Rental losses are passive: they offset passive income freely, and up to $25,000/yr can offset ordinary (W-2) income if you actively participate and your MAGI is under $100k (phasing out to $0 by $150k); unused losses carry forward. On sale, claimed depreciation is recaptured at up to 25%, and gains may owe capital-gains tax (a 1031 exchange can defer both). Figures are a year-1 estimate at your 24.0% rate — not tax advice; consult a CPA.
Schools (NCES district)
- District
- Birmingham City
- NCES district ID
- 0100390
- Math proficiency
- 4% ▼ -17.00%
- Reading proficiency
- 20% ▼ -4.00%
- Median HH income
- $31,988
- Composite
- 9.49/100
- National rank
- #9850
- State rank
- #116 of 129 in AL
Livability — Birmingham
- Score
- 67/100
- State rank
- #78
- US rank
- #10412
Category grades
Schools grade is shown separately in the Schools card above.
Census & demographics
- Census place
- Birmingham, AL
- County
- Jefferson County · 527,445 people
- City population
- 210,422
- Metro
- Birmingham-Hoover, AL
- Population (ZIP)
- 6,981
- Household income
- $30,739
- Rent vs Own
- Severe rent burden
- 621.0
Population outlook (Jefferson County) Hauer SSP2
- Today (2025)
- 669,185 people
- By 2030
- 669,694 · +0.1%
- By 2040
- 661,388 · -1.2%
- By 2050
- 643,086 · -3.9%
- By 2075
- 577,267 · -13.7%
- By 2100
- 474,758 · -29.1%
Race, ethnicity, and origin ACS 2023
- Neighborhood character
- Predominantly Black (76%)
- Race & ethnicity
- Black 76% Two or more races 17% White 5% Hispanic / Latino 4%
- Foreign-born
- 2% · Canada, South Korea
- Languages at home
- 97% English-only · Spanish 1%
Political lean MEDSL · Jefferson
- 2024 margin
- D (+10.4) · D 54.6% · R 44.2% · Other 1.2%
- 2008→2024 swing
- +5.4pp toward D · 2008: 5.1pp · 2024: 10.4pp
- All cycles
- 2024: D+10.4 2020: D+13.2 2016: D+7.2 2012: D+6.0 2008: D+5.1
Not yet ingested
- Civics
- —
Market trends
- HPI YoY
- ▼ -1.54%
- Current HPI
- 170.4053
- Rent YoY
- —
- Metro
- Birmingham-Hoover, AL
- State GDP YoY
- ▲ 2.94%
- F500 in state
- 4
Industry mix (Fortune 500 HQ in AL)
| Industry | F500 HQs | Revenue |
|---|---|---|
| Financial Services | 1 | $8B |
|
||
| Healthcare | 1 | $5B |
|
||
Price history
+221.4% since first listed8 events — show timeline
- 2026-05-07 Relisted — Greater Alabama MLS
- 2026-04-28 Pending — Greater Alabama MLS
- 2026-04-19 Listed $90,000 Greater Alabama MLS
- 2023-10-04 Sold (Public Records) $530,000 Public Records
- 2023-10-02 Sold (MLS) $66,250 Greater Alabama MLS
- 2023-08-04 Contingent — Greater Alabama MLS
- 2023-07-31 Listed $69,900 Greater Alabama MLS
- 1993-07-27 Sold (Public Records) $28,000 Public Records
Property tax history
+4.1%/yrLatest (2025): $1,257 · +0.0% YoY. Source: county tax records.
Cash-flow waterfall
monthlySold comps — $/sqft
last 12 mo · ≤1 miLoading sold comps…