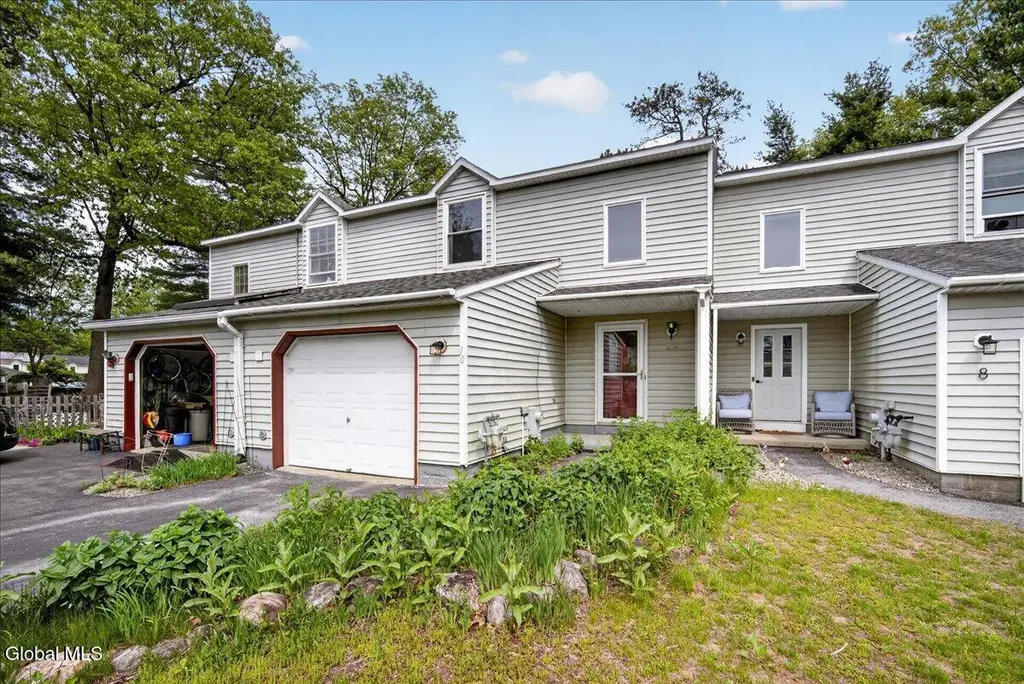
10 Deer Run Dr · Milton, NY
Flood risk 1/10 · Minimal
- FEMA flood zone
- X
- Chance of flooding over 30 yrs
- 0.0%
- Est. flood insurance / yr
- $507 – $1,088
Fire risk 2/10 · Minimal
- Est. fire insurance / yr
- $691 – $1,283
Heat risk 3/10 · Minor
- Hot days now (above 97°F)
- 7 days/yr
- Hot days in 30 yrs
- 16 days/yr
Wind risk 2/10 · Minimal
- Chance of severe wind over 30 yrs
- 4.0%
Air-quality risk 2/10 · Minimal
- Unhealthy air days now
- 0 days/yr
- Unhealthy air days in 30 yrs
- 1 days/yr
Risk factors via First Street. Map © Google.
Why this score? — see what drove the F grade
The composite is a weighted blend of 9 inputs, each scored 0–100. Each bar is that input's sub-score; the figure is the points it added to the 100-point composite (weight × sub-score).
- Cash flow +12.2/30.0
- Rent growth +5.0/5.0
- Schools +4.8/10.0
- DSCR +3.6/10.0
- Livability +3.3/5.0
- 1% rule +3.2/10.0
- Condition / age +2.5/5.0
- ARV discount +0.3/15.0
- Appreciation +0.0/10.0
$350,000
🖨 Deal sheet (PDF) 📄 Offer letter ✓ Due diligence
Listing remarks MLS
This townhome is immaculate! It has just about everything new inside. There is new ceramic tile and berber carpet throughout, new roof, garage door, stainless range w/microwave, stainless dishwasher. Freshly painted foyer, new driveway, 5 person jacuzzi that stays w/home, brand new extended deck, landscaped fenced in yard. Newly remodeled bathroom. Call Jeff for showing @ 376-0495-agent is the owner-showings begin Mon 7/25 -- Excellent Condition
Key facts
- Proximity to i87
- Fully fenced yard
- Garage
Tags
Property features AI
Finance
- Other: Lot approximately 0.07 acres (about 21' x 127')
Exterior
- Parking: Attached or detached garage with 1 garage space; Total of 4 parking spaces; Driveway
- Security: Smoke detectors; Carbon monoxide detectors
- Utilities: 150 amp electric service; Public water; Public sewer
- Home design: Townhouse; Slab foundation
- Construction: Vinyl siding; Asphalt roof
- Exterior features: Deck; Drive-paved; Full yard fencing; Garage(s) on property
Interior
- Kitchen: Electric oven; Oven; Dishwasher; Refrigerator
- Bedrooms: Three bedrooms on the second level
- Flooring: Vinyl; Carpet
- Bathrooms: One full bathroom on the second level; One half bathroom on the first level
- Heating & cooling: Forced air heating (natural gas); Central air conditioning
- Interior features: High speed internet; Paddle fan; Sliding doors; 6 total rooms; Fireplace in family room
- Laundry & utility: Washer and dryer included; Laundry closet
Neighborhood map
What this means for you Summary
Snapshot
- This is a 3-bed/1.5-bath townhouse listed at $350k.
Deal economics
- At list price, monthly cash flow is $-70 ($-841/yr) — negative.
- To cash-flow at today's rent, offer at most $338k (3.5% below list).
- To meet the 1% rule (rent ≥ 1% of price), the offer needs to be $286k (18.2% below list).
- Recommended offer: $286k (18.2% below list) — sets the bar for 1% rule.
- Cap rate 6.1% vs local median 2.4% in Milton — top-decile yield for the area; either an underpriced asset or a hidden risk that comps aren't pricing in. Stress-test before assuming the spread holds.
Location & tenants
- Location reads 66/100 on livability (#652 in NY) — a middle-class / working-renter tenant base. Strengths: employment A+, housing A+, crime B+; Watch: amenities F, commute F, cost of living D-.
- Ballston Spa Central School District (suburban): math 54% / reading 55% proficiency, ranked #289 of 590 in NY (top 49%) — acceptable for families but not a draw, mixed tenant base, ~2y average lease.
- Zoned schools: Geyser Road Elementary School (math 67% / reading 67%, grade B+, #525 of 2,108 statewide, top 27%, 348 students, 34% FRL); Maple Avenue Middle School (math 46% / reading 69%, grade B, #187 of 729 statewide, top 26%, 1,392 students, 27% FRL); Ballston Spa Senior High School (math 92% / reading 64%, grade A-, #568 of 1,100 statewide, top 52%, 1,249 students, 32% FRL).
- Zoned-school proficiency averages 68% at this address vs 54% district-wide (+13 pts) — the actual schools serving this property are materially stronger than the Ballston Spa Central School District average implies; a family-tenant draw the district grade alone would hide.
- Market conditions: Rents rising fast (+11.3%/yr); 225 active listings in the ZIP; 2 comparable units currently listed for rent nearby; solid renter incomes; 1,132 units permitted in Saratoga County in 2024 (378 in 5+ unit buildings).
- This rent runs 32% of the median local income ($107k/yr) — at the standard rent-burdened threshold; future hikes will face affordability resistance.
Forward outlook
- Local home prices are declining (-3.0%/yr); year-one equity from $2k of loan paydown is wiped out by about $10k of value loss. Plan a longer hold.
- Saratoga County population projected at +4% by 2050 — modest demand growth; plan on rents tracking national, not racing it.
Negotiation context
- It's been on market 24 days — a 2% lower offer ($345k) is reasonable based on typical stale-listing flexibility.
- 5 sale attempts since 26y ago with the ask held roughly flat each time — persistent listings suggest the price (not the market) is what's stuck; bring a comps-based counter.
- Current owner paid $170k; list at $350k implies a 106% gain — meaningful room to come down on a strong offer.
Questions for the listing agent
- What do current leases actually rent for vs. the listed asking? Can we see a recent rent roll and the last 12 months of T-12 income?
- Is there a deadline driving the sale (1031 exchange, divorce, estate, relocation)? That informs how much negotiation room exists.
- The area grade is low — what's the realistic commute time and amenity access for the typical tenant pool here? Any planned neighborhood developments (good or bad) we should know about?
- What's the average days-on-market for RENTAL listings here right now (not sales)? A rising rental-DOM trend means longer vacancies and softer asking-rent achievability than the comps imply.
- What's the recent tenant-quality profile in this submarket — average credit score on applications, eviction rate, late-payment / NSF rate, and stable-employment percentage? A property-management company in the area should have these aggregated.
- How much new for-sale + rental construction is in the pipeline within 1–3 miles? Heavy new supply typically softens prices + rents 12–24 months out; constrained supply supports both.
Investment metrics
- 1% rule
- 0.82% ✗
- Cap rate
- 6.05%
- Cash-on-cash
- -0.86%
- DSCR
- 0.96
- GRM
- 10.2
CMA / ARV
- ARV (on-the-fly)
- $301,920
- Comps found
- 11
Show comp detail 11 sales within ~0.75 mi
| Address | Dist | Beds/Ba | Sqft | Sold | Price | $/sf | Match |
|---|---|---|---|---|---|---|---|
| 214 Whitetail Ct | 0.16mi | 3/1.5 | 1,480 (0%) | 1mo | $330,000 | $223 | 92 |
| 310 Caribou Ct | 0.09mi | 3/1.5 | 1,480 (0%) | 6mo | $302,000 | $204 | 91 |
| 89 Deer Run Dr | 0.10mi | 3/1.5 | 1,480 (0%) | 9mo | $275,000 | $186 | 88 |
| 412 Antler Ct | 0.07mi | 2/2.5 (-1) | 1,480 (0%) | 2mo | $330,000 | $223 | 86 |
| 44 Deer Run Dr | 0.11mi | 3/2.5 | 1,480 (0%) | 7mo | $308,000 | $208 | 85 |
| 110 Deer Run Dr | 0.14mi | 3/1.5 | 1,480 (0%) | 11mo | $305,000 | $206 | 84 |
| 32 Deer Run Dr | 0.07mi | 2/2.5 (-1) | 1,480 (0%) | 10mo | $325,000 | $220 | 80 |
| 515 Elk Cir | 0.10mi | 2/2.5 (-1) | 1,480 (0%) | 18mo | $240,000 | $162 | 71 |
| 536 Elk Cir | 0.10mi | 2/2.5 (-1) | 1,480 (0%) | 18mo | $285,000 | $193 | 71 |
| 408 Antler Ct | 0.08mi | 2/2.5 (-1) | 1,480 (0%) | 23mo | $270,000 | $182 | 68 |
| 102 Deer Run Dr | 0.14mi | 2/2.5 (-1) | 1,480 (0%) | 23mo | $276,000 | $186 | 65 |
Match score weights: distance 35% · size 25% · config 20% · recency 20%. Top-matched comps best support the ARV.
Projected returns pro-forma
-3.0% appreciation · 8.0% rent growth · sell at horizon
- IRR
- -12.5%
- Equity multiple
- 0.53×
- Total profit
- $-46,062
- Equity at exit
- $52,186
- IRR
- 2.7%
- Equity multiple
- 1.23×
- Total profit
- $22,951
- Equity at exit
- $30,262
Cash invested: $98,000 (down + closing). Projections, not guarantees.
Landlord ↔ Tenant lean methodology
- Overall (STATE)
- 15 Strongly Tenant-Friendly
- State New York
- 15 Strongly Tenant-Friendly · D+10
- County
- — inherits STATE
- City
- — inherits STATE
ZIP-level market 12020
- Home prices YoY
- -14.8%
- Rents YoY
- 11.3%
- Active inventory
- 225
- Price-to-rent
- 10.2×
Monthly cashflow live
- Estimated rent
- $2,863 medium interval (Pro) →
- Mortgage (P&I)
- −$1,835
- Tax from tax record
- −$350 /mo · $4,203/yr
- Insurance
- −$146
- HOA
- −$0
- Vacancy / Maint / Mgmt
- −$601
- Net cashflow
- $-70
Break-even live
Sensitivity live
| Price | -10% $128 | -5% $29 | +0% $-70 | +5% $-169 | +10% $-268 |
|---|---|---|---|---|---|
| Rent | -10% $-296 | -5% $-183 | +0% $-70 | +5% $43 | +10% $156 |
| Rate | -1.0pp $106 | -0.5pp $19 | base $-70 | +0.5pp $-161 | +1.0pp $-253 |
UW: 25.0% down · 7.5% · 30yr · 1.5% tax · 5.0% vac · 8.0% maint · 8.0% mgmt
Financing live
Cash to close
- Down payment
- $87,500
- Closing costs
- $10,500
- Reserves months
- —
- Total cash needed
- —
Loan-product check · same deal, 3 products live
Conventional
25% down · 7.5% · 30yr
- Down + closing
- —
- Monthly P&I
- —
- Monthly cashflow
- —
- DSCR
- —
- Eligible?
- —
Personal DTI + credit; lowest rate.
DSCR
20% down · 8.5% · 30yr
- Down + closing
- —
- Monthly P&I
- —
- Monthly cashflow
- —
- DSCR
- —
- Eligible?
- —
No personal income docs; deal must DSCR.
Hard money
10% down · 12.0% · 12mo
- Down + closing
- —
- Monthly P&I
- —
- Monthly cashflow
- —
- DSCR
- —
- Eligible?
- —
Short-term bridge; refi at stabilization.
Rent comps 2 comps
| Address | Beds | Baths | Sqft | Rent | $/sqft | DOM | Units | Dist |
|---|---|---|---|---|---|---|---|---|
| 91 Hutchins Rd Ballston Spa, NY | 2.0 | 2.0 | 1316 | $3,050 | $2.32 | 15d | 7 | 0.59mi |
| 100 Madison Dr Ballston Spa, NY | 1.0–3.0 | 1.0–2.5 | 1145 | $3,266 | $2.85 | 15d | 41 | 1.03mi |
Listing history 33 events
-
2026-06-21days on market $350,000 Active 24 DOM
-
2026-06-18days on market $350,000 Active 21 DOM
-
2026-06-17days on market $350,000 Active 20 DOM
-
2026-06-16days on market $350,000 Active 19 DOM
-
2026-06-15days on market $350,000 Active 18 DOM
-
2026-06-14days on market $350,000 Active 16 DOM
-
2026-06-13days on market $350,000 Active 15 DOM
-
2026-06-10days on market $350,000 Active 13 DOM
-
2026-06-09days on market $350,000 Active 12 DOM
-
2026-06-08days on market $350,000 Active 11 DOM
-
2026-06-07days on market $350,000 Active 10 DOM
-
2026-06-05days on market $350,000 Active 7 DOM
-
2026-06-03days on market $350,000 Active 6 DOM
-
2026-06-02days on market $350,000 Active 5 DOM
-
2026-06-01days on market $350,000 Active 4 DOM
-
2026-05-31days on market $350,000 Active 3 DOM
-
2026-05-31days on market $350,000 Active 2 DOM
-
2026-05-28$350,000 Active
-
2012-08-03historical
-
2012-02-02$164,900
-
2005-10-27soldstatus $170,000
-
2005-08-31soldstatus $169,900 453-char remark
Show marketing remark (453 chars)
This townhome is immaculate! It has just about everything new inside. There is new ceramic tile and berber carpet throughout, new roof, garage door, stainless range w/microwave, stainless dishwasher. Freshly painted foyer, new driveway, 5 person jacuzzi that stays w/home, brand new extended deck, landscaped fenced in yard. Newly remodeled bathroom. Call Jeff for showing @ 376-0495-agent is the owner-showings begin Mon 7/25 -- Excellent Condition
-
2005-07-26historical 453-char remark
Show marketing remark (453 chars)
This townhome is immaculate! It has just about everything new inside. There is new ceramic tile and berber carpet throughout, new roof, garage door, stainless range w/microwave, stainless dishwasher. Freshly painted foyer, new driveway, 5 person jacuzzi that stays w/home, brand new extended deck, landscaped fenced in yard. Newly remodeled bathroom. Call Jeff for showing @ 376-0495-agent is the owner-showings begin Mon 7/25 -- Excellent Condition
-
2005-07-21$169,900 453-char remark
Show marketing remark (453 chars)
This townhome is immaculate! It has just about everything new inside. There is new ceramic tile and berber carpet throughout, new roof, garage door, stainless range w/microwave, stainless dishwasher. Freshly painted foyer, new driveway, 5 person jacuzzi that stays w/home, brand new extended deck, landscaped fenced in yard. Newly remodeled bathroom. Call Jeff for showing @ 376-0495-agent is the owner-showings begin Mon 7/25 -- Excellent Condition
-
2003-07-14soldstatus $92,000
-
2003-06-30soldstatus $92,000
-
2003-03-20historical
-
2003-03-15$89,900
-
2000-09-13soldstatus $72,500
-
2000-09-13soldstatus $72,500
-
2000-06-21historical
-
2000-04-01$73,500
-
1995-05-05soldstatus $76,000
ⓘ Source: listings_history table (triggers on properties + properties_extension) + one-shot
backfill from property_details.listing_events for pre-trigger history.
Tax reassessment forecast NY · Partial reset (capped growth)
- Current annual tax
- $4,203 · $350/mo
- Projected year-2 tax
- $5,059 · $422/mo
- Expected delta
- +$856/yr (+$71/mo · 20.4%)
ⓘ Screening estimate from a state-policy table — verify with the county assessor before closing.
Climate risk First Street
- Flood 1/10 Low FEMA zone X · 0% chance over 30 yrs
- Wildfire 2/10 Low
- Heat 3/10 Moderate 7 d/yr ≥97°F today · 16 d/yr by 30 yrs out
- Wind 2/10 Low 4% chance of damaging wind over 30 yrs
- Air quality 2/10 Low 0 unhealthy d/yr today · 1 by 30 yrs out
Nearby sold comps map
Loading sold comps map…
Walkable amenities ~0.75 mi
Loading nearby amenities…
Taxation est. · year 1
- Rental income
- $34,350
- − Mortgage interest
- −$19,605
- − Property taxes
- −$4,203
- − Insurance
- −$1,750
- − Repairs & maintenance
- −$2,748
- − Management
- −$2,748
- − Depreciation
- −$10,182
- Taxable loss
- −$6,886
- Est. tax savings @ 24.0%
- +$1,653
- After-tax cash flow
- $811/yr
For passive investors: Depreciation is non-cash, so a rental often shows a tax loss while cash-flowing — sheltering income. Rental losses are passive: they offset passive income freely, and up to $25,000/yr can offset ordinary (W-2) income if you actively participate and your MAGI is under $100k (phasing out to $0 by $150k); unused losses carry forward. On sale, claimed depreciation is recaptured at up to 25%, and gains may owe capital-gains tax (a 1031 exchange can defer both). Figures are a year-1 estimate at your 24.0% rate — not tax advice; consult a CPA.
Schools (NCES district)
- District
- Ballston Spa Central School District
- NCES district ID
- 3603930
- Math proficiency
- 54% ▼ -13.00%
- Reading proficiency
- 55% ▼ -4.00%
- Median HH income
- $66,705
- Composite
- 48.12/100
- National rank
- #2184
- State rank
- #289 of 590 in NY
Livability — Milton
- Score
- 66/100
- State rank
- #652
- US rank
- #11825
Category grades
Schools grade is shown separately in the Schools card above.
Census & demographics
- County
- Saratoga County · 166,192 people
- Metro
- Albany-Schenectady-Troy, NY
- Population (ZIP)
- 34,937
- Household income
- $107,112
- Rent vs Own
- Severe rent burden
- 607.0
Population outlook (Saratoga County) Hauer SSP2
- Today (2025)
- 238,889 people
- By 2030
- 243,681 · +2.0%
- By 2040
- 249,118 · +4.3%
- By 2050
- 248,638 · +4.1%
- By 2075
- 241,675 · +1.2%
- By 2100
- 213,150 · -10.8%
Race, ethnicity, and origin ACS 2023
- Neighborhood character
- Predominantly White (89%)
- Race & ethnicity
- White 89% Two or more races 4% Hispanic / Latino 4% Asian 2% Black 2%
- Common ancestry
- Romanian 6% Lithuanian 6% Iranian 2%
- Foreign-born
- 4% · Canada, China
- Languages at home
- 95% English-only · Chinese 1% Spanish 1% Other Asian/Pacific 1%
Political lean MEDSL · Saratoga
- 2024 margin
- Toss-up / Even · D 50.9% · R 49.1%
- 2008→2024 swing
- -1.6pp toward R · 2008: 3.4pp · 2024: 1.8pp
- All cycles
- 2024: D+1.8 2020: D+5.4 2016: R+4.4 2012: D+2.1 2008: D+3.4
Not yet ingested
- Civics
- —
Market trends
- HPI YoY
- ▼ -60.23%
- Current HPI
- 346.5996
- Rent YoY
- ▲ 11.26%
- Metro
- Albany-Schenectady-Troy, NY
- State GDP YoY
- ▲ 2.60%
- F500 in state
- 92
Industry mix (Fortune 500 HQ in NY)
| Industry | F500 HQs | Revenue |
|---|---|---|
| Financial Services | 10 | $950B |
|
||
| Consumer Goods | 9 | $162B |
|
||
| Insurance | 4 | $225B |
|
||
| Telecommunications | 2 | $144B |
|
||
| Pharmaceuticals | 2 | $112B |
|
||
| Media / Entertainment | 2 | $69B |
|
||
Price history
+360.5% since first listed16 events — show timeline
- 2026-05-28 Listed $350,000 Global MLS
- 2012-08-03 Listing Removed — Global MLS
- 2012-02-02 Listed $164,900 Global MLS
- 2005-10-27 Sold (Public Records) $170,000 Public Records
- 2005-08-31 Sold (MLS) $169,900 Global MLS
- 2005-07-26 Listing Removed — Global MLS
- 2005-07-21 Listed $169,900 Global MLS
- 2003-07-14 Sold (Public Records) $92,000 Public Records
- 2003-06-30 Sold (MLS) $92,000 Global MLS
- 2003-03-20 Listing Removed — Global MLS
- 2003-03-15 Listed $89,900 Global MLS
- 2000-09-13 Sold (Public Records) $72,500 Public Records
- 2000-09-13 Sold (MLS) $72,500 Global MLS
- 2000-06-21 Listing Removed — Global MLS
- 2000-04-01 Listed $73,500 Global MLS
- 1995-05-05 Sold (Public Records) $76,000 Public Records
Property tax history
+1.1%/yrLatest (2025): $4,203 · +0.9% YoY. Source: county tax records.
Cash-flow waterfall
monthlySold comps — $/sqft
last 12 mo · ≤1 miLoading sold comps…