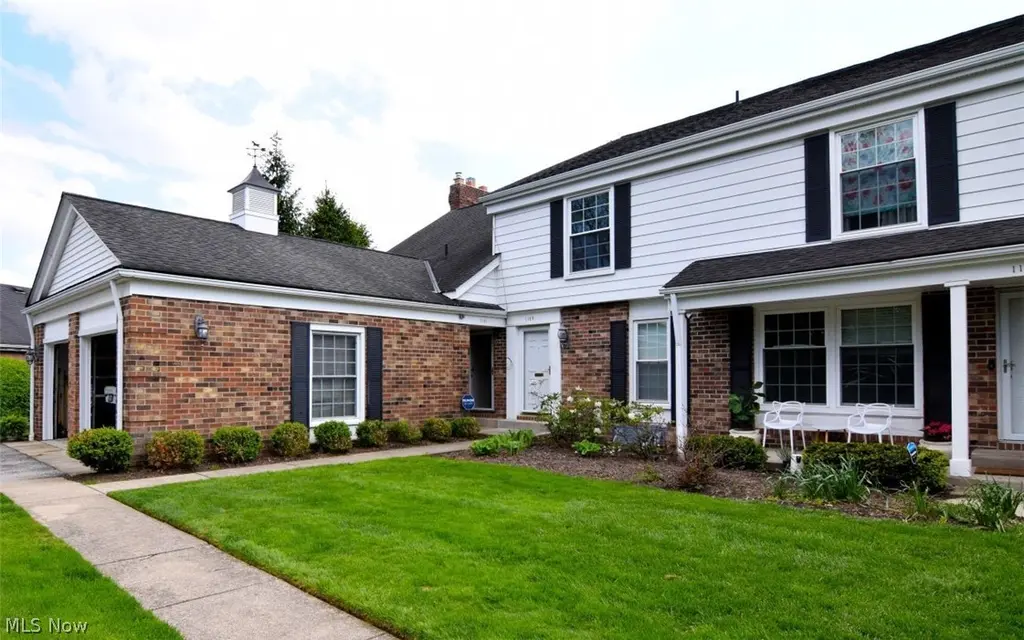
34100 Chagrin Boulevard Blvd #1101 · Moreland Hills, OH
Flood risk 1/10 · Minimal
- FEMA flood zone
- X (unshaded)
- Chance of flooding over 30 yrs
- 0.0%
- Est. flood insurance / yr
- $507 – $1,088
Fire risk 1/10 · Minimal
- Est. fire insurance / yr
- $713 – $1,323
Heat risk 3/10 · Minor
- Hot days now (above 94°F)
- 7 days/yr
- Hot days in 30 yrs
- 18 days/yr
Wind risk 1/10 · Minimal
- Chance of severe wind over 30 yrs
- —
Air-quality risk 3/10 · Minor
- Unhealthy air days now
- 3 days/yr
- Unhealthy air days in 30 yrs
- 4 days/yr
Risk factors via First Street. Map © Google.
Why this score? — see what drove the B- grade
The composite is a weighted blend of 9 inputs, each scored 0–100. Each bar is that input's sub-score; the figure is the points it added to the 100-point composite (weight × sub-score).
- Cash flow +30.0/30.0
- 1% rule +10.0/10.0
- DSCR +10.0/10.0
- Schools +7.3/10.0
- Livability +3.2/5.0
- Rent growth +2.5/5.0
- Condition / age +2.5/5.0
- ARV discount +0.0/15.0
- Appreciation +0.0/10.0
$359,000
🖨 Deal sheet 📄 Offer letter ✓ Due diligence
Listing remarks MLS
Outstanding Special End Unit Features Master On 1st Or 2nd. Maple Granite Kit W/ Hardwood Floors. Updated Baths & Finished Ll With Wet Bar. All Udpates Done In 2001. Sliders To Patio & Common Green Area. Pool. Garage. Neutral Transitional Decor Thruout. Direct Tv Wiring. 1st Flr Mstr Could Be Den.
Key facts
- Granite countertops
- Stone patio
- Hardwood floors
Tags
Neighborhood map
What this means for you Summary
Snapshot
- This is a 3-bed/2.0-bath condo listed at $359k.
Deal economics
- At list price, monthly cash flow is $2k ($26k/yr) — positive.
- The deal already cash-flows at list — no discount required.
- Meets the 1% rule at list price ($7k rent vs $359k).
- Recommended offer: $348k (3.0% below list) — sets the bar for market timing.
- Cap rate 13.5% vs local median 1.2% in Moreland Hills — top-decile yield for the area; either an underpriced asset or a hidden risk that comps aren't pricing in. Stress-test before assuming the spread holds.
Location & tenants
- Location reads 64/100 on livability (#788 in OH) — a middle-class / working-renter tenant base. Strengths: crime A+, employment A+, housing A+; Watch: amenities F, commute F, cost of living F.
- Orange City (suburban): math 76% / reading 83% proficiency, ranked #32 of 656 in OH (top 5%) — strong family-tenant draw, lease renewals of 3-5y typical; only 11% free/reduced lunch — higher-income household profile.
- Market conditions: 125 active listings in the ZIP; 1 comparable units currently listed for rent nearby; high-income renter base; 1,441 units permitted in Cuyahoga County in 2024 (700 in 5+ unit buildings).
- At $6,507/mo this rent would consume 51% of the median local household income ($152k/yr) — very limited rent-growth headroom before tenants either downsize or default.
Forward outlook
- Local home prices are declining (-3.0%/yr); year-one equity from $2k of loan paydown is wiped out by about $11k of value loss. Plan a longer hold.
- Cuyahoga County population projected to shrink 8% by 2050 — rents likely to lag national; underwrite the cash flow, not the appreciation.
- At projected returns (-3.0% appreciation + 3.0% rent growth), your $101k cash investment doubles in ~5 years — after that, you're playing with house money.
Negotiation context
- It's been on market 35 days — a 3% lower offer ($348k) is reasonable based on typical stale-listing flexibility.
- 2 sale attempts since 23y ago; this cycle's ask has dropped $20k (5%) from the opening price — seller is motivated, your offer sets the floor, not the list.
- Current owner paid $194k; list at $359k implies a 85% gain — meaningful room to come down on a strong offer.
Questions for the listing agent
- It's been on market 35 days. Have you received any prior offers? Is the seller open to a 3% concession, seller financing, or rate buy-down credit?
- Built in 1972 — when were the roof, HVAC, electrical panel, plumbing, and water heater last replaced?
- What does the HOA fee cover, when was the last increase, and are there any pending special assessments or reserve-fund shortfalls?
- Any open or pending special assessments — roof, HVAC, plumbing, elevator, façade? What's the per-unit balance and payoff schedule, and is the seller paying it off at close or rolling it to the buyer?
- Is there a deadline driving the sale (1031 exchange, divorce, estate, relocation)? That informs how much negotiation room exists.
- What's the average days-on-market for RENTAL listings here right now (not sales)? A rising rental-DOM trend means longer vacancies and softer asking-rent achievability than the comps imply.
- What's the recent tenant-quality profile in this submarket — average credit score on applications, eviction rate, late-payment / NSF rate, and stable-employment percentage? A property-management company in the area should have these aggregated.
- How much new apartment / multifamily construction is in the pipeline within 1–3 miles? Heavy new supply (>2% of stock underway) typically softens rents 12–24 months out; light construction supports rent growth.
Investment metrics
- 1% rule
- 1.81% ✓
- Cap rate
- 13.49%
- Cash-on-cash
- 25.72%
- DSCR
- 2.14
- GRM
- 4.6
CMA / ARV
- ARV (median comp)
- $295,000
- List price
- $359,000
- Delta
- 21.69%
- Verdict
- OVERPRICED
- Comps
- 7 within 1.0 mi
Projected returns pro-forma
-3.0% appreciation · 3.0% rent growth · sell at horizon
- IRR
- 19.4%
- Equity multiple
- 1.79×
- Total profit
- $79,429
- Equity at exit
- $53,528
- IRR
- 27.8%
- Equity multiple
- 3.46×
- Total profit
- $247,486
- Equity at exit
- $31,040
Cash invested: $100,520 (down + closing). Projections, not guarantees.
Landlord ↔ Tenant lean methodology
- Overall (STATE)
- 73 Landlord-Friendly
- State Ohio
- 73 Landlord-Friendly · R+6
- County
- — inherits STATE
- City
- — inherits STATE
ZIP-level market 44022
- Active inventory
- 125
- Price-to-rent
- 4.6×
Monthly cashflow live
- Estimated rent
- $6,507 medium interval (Pro) →
- Mortgage (P&I)
- −$1,883
- Tax from tax record
- −$407 /mo · $4,887/yr
- Insurance
- −$150
- HOA
- −$547
- Vacancy / Maint / Mgmt
- −$1,366
- Net cashflow
- $2,154
Break-even live
UW: 25.0% down · 7.5% · 30yr · 1.5% tax · 5.0% vac · 8.0% maint · 8.0% mgmt
Financing live
Cash to close
- Down payment
- $89,750
- Closing costs
- $10,770
- Reserves months
- —
- Total cash needed
- —
Loan-product check · same deal, 3 products live
Conventional
25% down · 7.5% · 30yr
- Down + closing
- —
- Monthly P&I
- —
- Monthly cashflow
- —
- DSCR
- —
- Eligible?
- —
Personal DTI + credit; lowest rate.
DSCR
20% down · 8.5% · 30yr
- Down + closing
- —
- Monthly P&I
- —
- Monthly cashflow
- —
- DSCR
- —
- Eligible?
- —
No personal income docs; deal must DSCR.
Hard money
10% down · 12.0% · 12mo
- Down + closing
- —
- Monthly P&I
- —
- Monthly cashflow
- —
- DSCR
- —
- Eligible?
- —
Short-term bridge; refi at stabilization.
Rent comps 1 comps
| Address | Beds | Baths | Sqft | Rent | $/sqft | DOM | Units | Dist |
|---|---|---|---|---|---|---|---|---|
| 3815 Ellendale Rd Unit 1496074P Moreland Hills, OH | 3.0 | 1.0 | 1280 | $6,507 | $5.08 | 1d | 1 | 1.03mi |
HOA detail condo
- Monthly dues
- $547 · $6,564/yr
- Likely covers
- pool
- Assessments
- None detected in remarks — confirm with the listing agent.
Listing history 17 events
-
2026-06-18days on market $359,000 Active 35 DOM
-
2026-06-17days on market $359,000 Active 34 DOM
-
2026-06-16days on market $359,000 Active 33 DOM
-
2026-06-15days on market $359,000 Active 32 DOM
-
2026-06-13days on market $359,000 Active 30 DOM
-
2026-06-09days on market $359,000 Active 26 DOM
-
2026-06-08days on market $359,000 Active 25 DOM
-
2026-06-07days on market $359,000 Active 24 DOM
-
2026-06-05days on market $359,000 Active 21 DOM
-
2026-06-03pricedays on market $359,000 Active 20 DOM
-
2026-06-02days on market $379,000 Active 19 DOM
-
2026-06-01days on market $379,000 Active 18 DOM
-
2026-05-31days on market $379,000 Active 17 DOM
-
2026-05-14$379,000 Active 1139-char remark
-
2003-07-01soldstatus $194,500 310-char remark
Show marketing remark (310 chars)
Outstanding Special End Unit Features Master On 1st Or 2nd. Maple Granite Kit W/ Hardwood Floors. Updated Baths & Finished Ll With Wet Bar. All Udpates Done In 2001. Sliders To Patio & Common Green Area. Pool. Garage. Neutral Transitional Decor Thruout. Direct Tv Wiring. 1st Flr Mstr Could Be Den.
-
2003-06-25soldstatus $194,900
-
2003-05-10$194,900 310-char remark
Show marketing remark (310 chars)
Outstanding Special End Unit Features Master On 1st Or 2nd. Maple Granite Kit W/ Hardwood Floors. Updated Baths & Finished Ll With Wet Bar. All Udpates Done In 2001. Sliders To Patio & Common Green Area. Pool. Garage. Neutral Transitional Decor Thruout. Direct Tv Wiring. 1st Flr Mstr Could Be Den.
ⓘ Source: listings_history table (triggers on properties + properties_extension) + one-shot
backfill from property_details.listing_events for pre-trigger history.
Tax reassessment forecast OH · Partial reset (capped growth)
- Current annual tax
- $4,887 · $407/mo
- Projected year-2 tax
- $5,244 · $437/mo
- Expected delta
- +$357/yr (+$30/mo · 7.3%)
ⓘ Screening estimate from a state-policy table — verify with the county assessor before closing.
Climate risk First Street
- Flood 1/10 Low FEMA zone X (unshaded) · 0% chance over 30 yrs
- Wildfire 1/10 Low
- Heat 3/10 Moderate 7 d/yr ≥94°F today · 18 d/yr by 30 yrs out
- Wind 1/10 Low
- Air quality 3/10 Moderate 3 unhealthy d/yr today · 4 by 30 yrs out
Nearby sold comps map
Loading sold comps map…
Walkable amenities ~0.75 mi
Loading nearby amenities…
Taxation est. · year 1
- Rental income
- $78,084
- − Mortgage interest
- −$20,110
- − Property taxes
- −$4,887
- − Insurance
- −$1,795
- − Repairs & maintenance
- −$6,247
- − Management
- −$6,247
- − HOA
- −$6,564
- − Depreciation
- −$10,444
- Taxable income
- $21,791
- Est. tax owed @ 24.0%
- −$5,230
- After-tax cash flow
- $20,619/yr
For passive investors: Depreciation is non-cash, so a rental often shows a tax loss while cash-flowing — sheltering income. Rental losses are passive: they offset passive income freely, and up to $25,000/yr can offset ordinary (W-2) income if you actively participate and your MAGI is under $100k (phasing out to $0 by $150k); unused losses carry forward. On sale, claimed depreciation is recaptured at up to 25%, and gains may owe capital-gains tax (a 1031 exchange can defer both). Figures are a year-1 estimate at your 24.0% rate — not tax advice; consult a CPA.
Schools (NCES district)
- District
- Orange City
- NCES district ID
- 3910016
- Math proficiency
- 76% ▼ -11.00%
- Reading proficiency
- 83% ▼ -6.00%
- Median HH income
- $114,295
- Composite
- 73.37/100
- National rank
- #182
- State rank
- #32 of 656 in OH
Livability — Moreland Hills
- Score
- 64/100
- State rank
- #788
- US rank
- #14310
Category grades
Schools grade is shown separately in the Schools card above.
Census & demographics
- Census place
- Moreland Hills, OH
- County
- Cuyahoga · 1,045,444 people
- Metro
- Cleveland, OH
- Population (ZIP)
- 16,559
- Household income
- $152,213
- Rent vs Own
- Severe rent burden
- 13.7
Population outlook (Cuyahoga County) Hauer SSP2
- Today (2025)
- 1,244,621 people
- By 2030
- 1,230,093 · -1.2%
- By 2040
- 1,189,108 · -4.5%
- By 2050
- 1,145,706 · -7.9%
- By 2075
- 1,076,557 · -13.5%
- By 2100
- 978,987 · -21.3%
Race, ethnicity, and origin ACS 2023
- Neighborhood character
- Predominantly White (89%)
- Race & ethnicity
- White 89% Black 4% Two or more races 3% Hispanic / Latino 3% Asian 2%
- Common ancestry
- Romanian 6% Scotch-Irish 4% Italian 3%
- Foreign-born
- 8% · Canada, China
- Languages at home
- 92% English-only · Russian/Polish/Slavic 2% Spanish 2% Other Indo-European 1%
Political lean MEDSL · Cuyahoga
- 2024 margin
- Solid D (+31.5) · D 65.4% · R 33.9%
- 2008→2024 swing
- -7.4pp toward R · 2008: 38.9pp · 2024: 31.5pp
- All cycles
- 2024: D+31.5 2020: D+34.1 2016: D+35.0 2012: D+38.7 2008: D+38.9
Not yet ingested
- Civics
- —
Market trends
- HPI YoY
- ▼ -336.08%
- Current HPI
- 205.3055
- Rent YoY
- —
- Metro
- —
- State GDP YoY
- ▲ 1.98%
- F500 in state
- 48
Industry mix (Fortune 500 HQ in OH)
| Industry | F500 HQs | Revenue |
|---|---|---|
| Insurance | 3 | $145B |
|
||
| Industrial Machinery | 3 | $49B |
|
||
| Financial Services | 3 | $24B |
|
||
| Consumer Goods | 2 | $93B |
|
||
| Aerospace / Defense | 2 | $47B |
|
||
| Utilities | 2 | $33B |
|
||
Price history
+84.2% since first listed5 events — show timeline
- 2026-06-03 Price Changed $359,000 MLSNOW
- 2026-05-14 Listed $379,000 MLSNOW
- 2003-07-01 Sold (MLS) $194,500 MLSNOW
- 2003-06-25 Sold (Public Records) $194,900 Public Records
- 2003-05-10 Listed $194,900 MLSNOW
Property tax history
+2.4%/yrLatest (2025): $4,887 · -0.1% YoY. Source: county tax records.
Cash-flow waterfall
monthlySold comps — $/sqft
last 12 mo · ≤1 miLoading sold comps…