6231 Haven Vly · San Antonio, TX
Flood risk 1/10 · Minimal
- FEMA flood zone
- X (unshaded)
- Chance of flooding over 30 yrs
- 0.0%
- Est. flood insurance / yr
- $507 – $1,088
Fire risk 4/10 · Minor
- Est. fire insurance / yr
- $1,222 – $2,270
Heat risk 8/10 · Major
- Hot days now (above 109°F)
- 7 days/yr
- Hot days in 30 yrs
- 22 days/yr
Wind risk 8/10 · Major
- Chance of severe wind over 30 yrs
- 80.0%
Air-quality risk 2/10 · Minimal
- Unhealthy air days now
- 0 days/yr
- Unhealthy air days in 30 yrs
- 1 days/yr
Risk factors via First Street. Map © Google.
Why this score? — see what drove the D grade
The composite is a weighted blend of 9 inputs, each scored 0–100. Each bar is that input's sub-score; the figure is the points it added to the 100-point composite (weight × sub-score).
- Cash flow +12.4/30.0
- ARV discount +9.0/15.0
- 1% rule +4.5/10.0
- Livability +4.0/5.0
- DSCR +3.7/10.0
- Condition / age +2.5/5.0
- Rent growth +2.2/5.0
- Schools +2.2/10.0
- Appreciation +0.0/10.0
$149,900
🖨 Deal sheet (PDF) 📄 Offer letter ✓ Due diligence
Listing remarks MLS
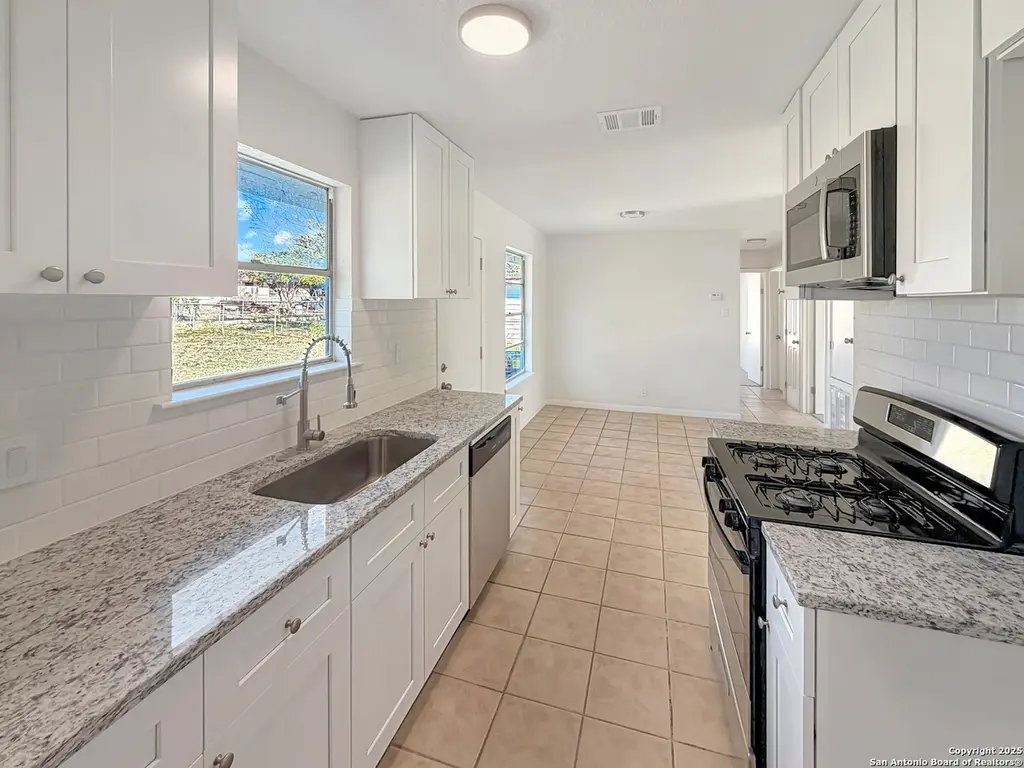
**OWNER FINANCING AND/OR CONCESSIONS AVAILABLE TO HELP BUY DOWN THE RATE OR HELP WITH CLOSING COSTS FOR QUALIFIED BUYERS** Check out this stunning, remodeled three bedroom, one bath home which is an exceptional opportunity for any buyer looking for a great find. Designed for family comfort and modern living, this property offers incredible peace of mind with a brand new roof, a modern central AC/heat system, and stylish upgrades like custom cabinets with hardware, granite countertops, and a subway tile backsplash. All new Stainless Steel appliances with gas cooking, built in microwave, and dishwasher. Sitting on a spacious .219 acre lot, the massive, fully fenced backyard is ideal for children, pets, and outdoor gatherings. The large, unfinished bonus room is a true asset, providing a blank canvas perfect for a customized game room, dedicated home office, or a second living area. The location provides exceptional convenience with rapid access to I 35 and Loop 410, simplifying your daily commute. You are positioned just minutes from major hubs including Lackland Air Force Base, family fun at Nelson Wolff Stadium, numerous parks, and abundant shopping and dining options. This updated home is a must see, so act immediately and submit your strongest offer today before this chance is gone!
Key facts
- Brand new roof
- Granite countertops
- 9,539 sq ft lot
Tags
Neighborhood map
What this means for you Summary
Snapshot
- This is a 3-bed/1.0-bath single-family listed at $150k.
Deal economics
- At list price, monthly cash flow is $-24 ($-292/yr) — negative.
- To cash-flow at today's rent, offer at most $146k (2.9% below list).
- To meet the 1% rule (rent ≥ 1% of price), the offer needs to be $142k (5.2% below list).
- Recommended offer: $142k (5.2% below list) — sets the bar for 1% rule.
- Cap rate 6.1% vs local median 3.8% in San Antonio — top-decile yield for the area; either an underpriced asset or a hidden risk that comps aren't pricing in. Stress-test before assuming the spread holds.
Location & tenants
- Location reads 80/100 on livability (#31 in TX, #1,616 nationally) — a professional / high-income tenant draw. Strengths: amenities A+, commute A+, cost of living A+; Watch: schools C-, crime F.
- Southwest ISD (rural): math 21% / reading 31% proficiency, ranked #701 of 826 in TX (top 85%) — low school quality limits family demand, transient renter base, plan for 1-2y turnover; 75% free/reduced lunch — lower-income household profile, screen leases tightly.
- Market conditions: Rents soft (-1.3%/yr); 92 active listings in the ZIP; 11 comparable units currently listed for rent nearby; rentals at typical pace (median 17d on market — plan ~3-4 weeks tenant-placement turnaround); 8,308 units permitted in Bexar County in 2024 (2,506 in 5+ unit buildings).
- This rent runs 34% of the median local income ($51k/yr) — at the standard rent-burdened threshold; future hikes will face affordability resistance.
Forward outlook
- Local home prices are declining (-3.0%/yr); year-one equity from $1k of loan paydown is wiped out by about $4k of value loss. Plan a longer hold.
- Bexar County population projected at +50% by 2050 — long-run rental-demand tailwind backs the buy-and-hold thesis.
Negotiation context
- It's been on market 56 days — a 3% lower offer ($145k) is reasonable based on typical stale-listing flexibility.
- 6 sale attempts since 13y ago with the ask held roughly flat each time — persistent listings suggest the price (not the market) is what's stuck; bring a comps-based counter.
Risks & watch-outs
- Climate carrying-cost: severe wind risk, 80% chance of damaging wind over 30y; extreme-heat days projected 7→22/yr by 2055 (HVAC capex compounding) — expect insurance premiums to compound above CPI over the hold.
Questions for the listing agent
- What do current leases actually rent for vs. the listed asking? Can we see a recent rent roll and the last 12 months of T-12 income?
- It's been on market 56 days. Have you received any prior offers? Is the seller open to a 5% concession, seller financing, or rate buy-down credit?
- Built in 1970 — when were the roof, HVAC, electrical panel, plumbing, and water heater last replaced?
- Is there a deadline driving the sale (1031 exchange, divorce, estate, relocation)? That informs how much negotiation room exists.
- Crime grade is F in this area — have there been break-ins, vandalism, or insurance claims at this property in the last 3 years? What carrier currently insures it and at what premium?
- The area grade is low — what's the realistic commute time and amenity access for the typical tenant pool here? Any planned neighborhood developments (good or bad) we should know about?
- What's the average days-on-market for RENTAL listings here right now (not sales)? A rising rental-DOM trend means longer vacancies and softer asking-rent achievability than the comps imply.
- What's the recent tenant-quality profile in this submarket — average credit score on applications, eviction rate, late-payment / NSF rate, and stable-employment percentage? A property-management company in the area should have these aggregated.
- How much new for-sale + rental construction is in the pipeline within 1–3 miles? Heavy new supply typically softens prices + rents 12–24 months out; constrained supply supports both.
Investment metrics
- 1% rule
- 0.95% ✗
- Cap rate
- 6.10%
- Cash-on-cash
- -0.70%
- DSCR
- 0.97
- GRM
- 8.8
CMA / ARV
- ARV (median comp)
- $155,116
- List price
- $149,900
- Delta
- -3.36%
- Verdict
- FAIR
- Comps
- 20 within 1.0 mi
Show comp detail 10 sales within ~0.75 mi
| Address | Dist | Beds/Ba | Sqft | Sold | Price | $/sf | Match |
|---|---|---|---|---|---|---|---|
| 6231 Haven Vly | 0.00mi | 3/1.0 | 960 (0%) | 0mo | $149,900 | $156 | 100 |
| 6130 Frio Valley Dr | 0.16mi | 3/1.0 | 984 (+2%) | 13mo | $125,000 | $127 | 78 |
| 6223 Haven Vly | 0.03mi | 3/1.0 | 1,032 (+8%) | 18mo | $170,000 | $165 | 71 |
| 6034 Pine Vly | 0.48mi | 3/1.0 | 1,008 (+5%) | 7mo | $137,000 | $136 | 63 |
| 7511 Sleepy Vly | 0.46mi | 3/1.0 | 1,032 (+8%) | 14mo | $178,500 | $173 | 55 |
| 6227 Slate Vly | 0.34mi | 3/1.0 | 896 (-7%) | 23mo | $150,000 | $167 | 54 |
| 7518 Breeze Valley Dr | 0.54mi | 3/1.0 | 996 (+4%) | 19mo | $129,900 | $130 | 53 |
| 6023 Lark Valley Dr | 0.67mi | 3/2.0 | 1,016 (+6%) | 11mo | $199,000 | $196 | 46 |
| 6239 Lark Vly | 0.52mi | 3/2.0 | 1,036 (+8%) | 23mo | $199,000 | $192 | 40 |
| 8501 Spotted Deer | 0.74mi | 4/2.0 (+1) | 858 (-11%) | 2mo | $129,000 | $150 | 37 |
Match score weights: distance 35% · size 25% · config 20% · recency 20%. Top-matched comps best support the ARV.
Projected returns pro-forma
-3.0% appreciation · 0.0% rent growth · sell at horizon
- IRR
- -21.2%
- Equity multiple
- 0.29×
- Total profit
- $-29,913
- Equity at exit
- $22,351
- IRR
- -25.1%
- Equity multiple
- -0.04×
- Total profit
- $-43,768
- Equity at exit
- $12,961
Cash invested: $41,972 (down + closing). Projections, not guarantees.
Landlord ↔ Tenant lean methodology
- Overall (STATE)
- 87 Strongly Landlord-Friendly
- State Texas
- 87 Strongly Landlord-Friendly · R+5
- County
- — inherits STATE
- City
- — inherits STATE
ZIP-level market 78242
- Home prices YoY
- -17.6%
- Rents YoY
- -1.3%
- Active inventory
- 92
- Price-to-rent
- 8.8×
Monthly cashflow live
- Estimated rent
- $1,421 high interval (Pro) →
- Mortgage (P&I)
- −$786
- Tax from tax record
- −$298 /mo · $3,576/yr
- Insurance
- −$62
- HOA
- −$0
- Vacancy / Maint / Mgmt
- −$298
- Net cashflow
- $-24
Break-even live
Sensitivity live
| Price | -10% $61 | -5% $18 | +0% $-24 | +5% $-67 | +10% $-109 |
|---|---|---|---|---|---|
| Rent | -10% $-137 | -5% $-80 | +0% $-24 | +5% $32 | +10% $88 |
| Rate | -1.0pp $51 | -0.5pp $14 | base $-24 | +0.5pp $-63 | +1.0pp $-103 |
UW: 25.0% down · 7.5% · 30yr · 1.5% tax · 5.0% vac · 8.0% maint · 8.0% mgmt
Financing live
Cash to close
- Down payment
- $37,475
- Closing costs
- $4,497
- Reserves months
- —
- Total cash needed
- —
Loan-product check · same deal, 3 products live
Conventional
25% down · 7.5% · 30yr
- Down + closing
- —
- Monthly P&I
- —
- Monthly cashflow
- —
- DSCR
- —
- Eligible?
- —
Personal DTI + credit; lowest rate.
DSCR
20% down · 8.5% · 30yr
- Down + closing
- —
- Monthly P&I
- —
- Monthly cashflow
- —
- DSCR
- —
- Eligible?
- —
No personal income docs; deal must DSCR.
Hard money
10% down · 12.0% · 12mo
- Down + closing
- —
- Monthly P&I
- —
- Monthly cashflow
- —
- DSCR
- —
- Eligible?
- —
Short-term bridge; refi at stabilization.
Rent comps 11 comps
| Address | Beds | Baths | Sqft | Rent | $/sqft | DOM | Units | Dist |
|---|---|---|---|---|---|---|---|---|
| 6243 Indian Valley Dr San Antonio, TX | 3.0 | 1.0 | 975 | $1,400 | $1.44 | 5d | 1 | 0.08mi |
| 8671 SW Loop 410 San Antonio, TX | 2.0–3.0 | 2.0 | 1024 | $1,405 | $1.37 | 17d | 7 | 0.23mi |
| 6214 Slate Valley Dr San Antonio, TX | 3.0 | 1.0 | 920 | $1,100 | $1.20 | 24d | 1 | 0.31mi |
| 6010 Ray Ellison Blvd San Antonio, TX | 1.0–3.0 | 1.0–2.0 | 974 | $1,418 | $1.46 | 44d | 1 | 0.74mi |
| 9130 Excellence Dr San Antonio, TX | 1.0–4.0 | 1.0–2.0 | 990 | $1,374 | $1.39 | 17d | 1 | 0.74mi |
| 6106 Cedar Valley Dr San Antonio, TX | 3.0 | 1.0 | 984 | $1,375 | $1.40 | 5d | 1 | 1.01mi |
| 5427 Indian Desert St San Antonio, TX | 3.0 | 2.0 | 888 | $1,195 | $1.35 | 22d | 1 | 1.29mi |
| 5415 Ray Ellison Blvd San Antonio, TX | 1.0–2.0 | 1.0–2.0 | 878 | $1,240 | $1.41 | 5d | 24 | 1.39mi |
| 9228 Balboa Port Dr San Antonio, TX | 3.0 | 2.0 | 1064 | $1,500 | $1.41 | 44d | 1 | 1.42mi |
| 5510 Seahorse Dr San Antonio, TX | 3.0 | 1.5 | 1060 | $1,395 | $1.32 | 5d | 1 | 1.47mi |
| 7515 Holm Rd San Antonio, TX | 1.0–3.0 | 1.0–2.0 | 886 | $1,404 | $1.58 | 4d | 31 | 1.50mi |
Listing history 20 events
-
2026-05-11historical Active Option 1305-char remark
Show marketing remark (1305 chars)
**OWNER FINANCING AND/OR CONCESSIONS AVAILABLE TO HELP BUY DOWN THE RATE OR HELP WITH CLOSING COSTS FOR QUALIFIED BUYERS** Check out this stunning, remodeled three bedroom, one bath home which is an exceptional opportunity for any buyer looking for a great find. Designed for family comfort and modern living, this property offers incredible peace of mind with a brand new roof, a modern central AC/heat system, and stylish upgrades like custom cabinets with hardware, granite countertops, and a subway tile backsplash. All new Stainless Steel appliances with gas cooking, built in microwave, and dishwasher. Sitting on a spacious .219 acre lot, the massive, fully fenced backyard is ideal for children, pets, and outdoor gatherings. The large, unfinished bonus room is a true asset, providing a blank canvas perfect for a customized game room, dedicated home office, or a second living area. The location provides exceptional convenience with rapid access to I 35 and Loop 410, simplifying your daily commute. You are positioned just minutes from major hubs including Lackland Air Force Base, family fun at Nelson Wolff Stadium, numerous parks, and abundant shopping and dining options. This updated home is a must see, so act immediately and submit your strongest offer today before this chance is gone!
-
2026-04-10price $149,900 1305-char remark
Show marketing remark (1305 chars)
**OWNER FINANCING AND/OR CONCESSIONS AVAILABLE TO HELP BUY DOWN THE RATE OR HELP WITH CLOSING COSTS FOR QUALIFIED BUYERS** Check out this stunning, remodeled three bedroom, one bath home which is an exceptional opportunity for any buyer looking for a great find. Designed for family comfort and modern living, this property offers incredible peace of mind with a brand new roof, a modern central AC/heat system, and stylish upgrades like custom cabinets with hardware, granite countertops, and a subway tile backsplash. All new Stainless Steel appliances with gas cooking, built in microwave, and dishwasher. Sitting on a spacious .219 acre lot, the massive, fully fenced backyard is ideal for children, pets, and outdoor gatherings. The large, unfinished bonus room is a true asset, providing a blank canvas perfect for a customized game room, dedicated home office, or a second living area. The location provides exceptional convenience with rapid access to I 35 and Loop 410, simplifying your daily commute. You are positioned just minutes from major hubs including Lackland Air Force Base, family fun at Nelson Wolff Stadium, numerous parks, and abundant shopping and dining options. This updated home is a must see, so act immediately and submit your strongest offer today before this chance is gone!
-
2026-04-01$152,500 New 1305-char remark
Show marketing remark (1305 chars)
**OWNER FINANCING AND/OR CONCESSIONS AVAILABLE TO HELP BUY DOWN THE RATE OR HELP WITH CLOSING COSTS FOR QUALIFIED BUYERS** Check out this stunning, remodeled three bedroom, one bath home which is an exceptional opportunity for any buyer looking for a great find. Designed for family comfort and modern living, this property offers incredible peace of mind with a brand new roof, a modern central AC/heat system, and stylish upgrades like custom cabinets with hardware, granite countertops, and a subway tile backsplash. All new Stainless Steel appliances with gas cooking, built in microwave, and dishwasher. Sitting on a spacious .219 acre lot, the massive, fully fenced backyard is ideal for children, pets, and outdoor gatherings. The large, unfinished bonus room is a true asset, providing a blank canvas perfect for a customized game room, dedicated home office, or a second living area. The location provides exceptional convenience with rapid access to I 35 and Loop 410, simplifying your daily commute. You are positioned just minutes from major hubs including Lackland Air Force Base, family fun at Nelson Wolff Stadium, numerous parks, and abundant shopping and dining options. This updated home is a must see, so act immediately and submit your strongest offer today before this chance is gone!
-
2026-03-31historical
-
2026-03-21status Back on Market
-
2026-03-16status Pending
-
2026-03-09historical Active Option
-
2026-02-23status Back on Market
-
2026-02-19historical Active Option
-
2026-02-04status Back on Market
-
2026-02-02historical Active Option
-
2026-01-29price $152,500
-
2025-12-10price $155,000
-
2025-11-18$159,900 New
-
2025-09-29soldstatus
-
2020-07-10soldstatus
-
2013-12-10soldstatus Sold
-
2013-11-08status Pending
-
2013-10-30$38,000 New
-
2005-05-31soldstatus
ⓘ Source: listings_history table (triggers on properties + properties_extension) + one-shot
backfill from property_details.listing_events for pre-trigger history.
Tax reassessment forecast TX · Resets to sale price
- Current annual tax
- $3,576 · $298/mo
- Projected year-2 tax
- $3,576 · $298/mo
- Expected delta
- $0/yr ($0/mo · 0.0%)
ⓘ Screening estimate from a state-policy table — verify with the county assessor before closing.
Climate risk First Street
- Flood 1/10 Low FEMA zone X (unshaded) · 0% chance over 30 yrs
- Wildfire 4/10 Moderate
- Heat 8/10 Severe 7 d/yr ≥109°F today · 22 d/yr by 30 yrs out
- Wind 8/10 Severe 80% chance of damaging wind over 30 yrs
- Air quality 2/10 Low 0 unhealthy d/yr today · 1 by 30 yrs out
Nearby sold comps map
Loading sold comps map…
Walkable amenities ~0.75 mi
Loading nearby amenities…
Taxation est. · year 1
- Rental income
- $17,047
- − Mortgage interest
- −$8,397
- − Property taxes
- −$3,576
- − Insurance
- −$750
- − Repairs & maintenance
- −$1,364
- − Management
- −$1,364
- − Depreciation
- −$4,361
- Taxable loss
- −$2,764
- Est. tax savings @ 24.0%
- +$663
- After-tax cash flow
- $371/yr
For passive investors: Depreciation is non-cash, so a rental often shows a tax loss while cash-flowing — sheltering income. Rental losses are passive: they offset passive income freely, and up to $25,000/yr can offset ordinary (W-2) income if you actively participate and your MAGI is under $100k (phasing out to $0 by $150k); unused losses carry forward. On sale, claimed depreciation is recaptured at up to 25%, and gains may owe capital-gains tax (a 1031 exchange can defer both). Figures are a year-1 estimate at your 24.0% rate — not tax advice; consult a CPA.
Schools (NCES district)
- District
- Southwest ISD
- NCES district ID
- 4840950
- Math proficiency
- 21% ▼ -21.00%
- Reading proficiency
- 31% ▼ -5.00%
- Median HH income
- $43,362
- Composite
- 22.22/100
- National rank
- #8153
- State rank
- #701 of 826 in TX
Livability — San Antonio
- Score
- 80/100
- State rank
- #31
- US rank
- #1616
Category grades
Schools grade is shown separately in the Schools card above.
Census & demographics
- Census place
- San Antonio, TX
- County
- Bexar County · 1,990,555 people
- City population
- 1,806,925
- Metro
- San Antonio-New Braunfels, TX
- Population (ZIP)
- 36,168
- Household income
- $50,644
- Rent vs Own
- Severe rent burden
- 1778.0
Population outlook (Bexar County) Hauer SSP2
- Today (2025)
- 2,336,851 people
- By 2030
- 2,560,728 · +9.6%
- By 2040
- 3,020,569 · +29.3%
- By 2050
- 3,493,522 · +49.5%
- By 2075
- 4,668,459 · +99.8%
- By 2100
- 5,533,242 · +136.8%
Race, ethnicity, and origin ACS 2023
- Neighborhood character
- Predominantly Hispanic (86%)
- Race & ethnicity
- Hispanic / Latino 86% Two or more races 25% White 8% Black 3% Native American 2%
- Hispanic origin (detail)
- Mexican 67%
- Common ancestry
- Romanian 1% Italian 1%
- Foreign-born
- 20% · Canada
- Languages at home
- 43% English-only · Spanish 55%
Political lean MEDSL · Bexar
- 2024 margin
- Lean D (+9.8) · D 54.3% · R 44.6% · Other 1.1%
- 2008→2024 swing
- +4.2pp toward D · 2008: 5.6pp · 2024: 9.8pp
- All cycles
- 2024: D+9.8 2020: D+18.2 2016: D+13.5 2012: D+4.6 2008: D+5.6
Not yet ingested
- Civics
- —
Market trends
- HPI YoY
- ▼ -55.63%
- Current HPI
- 259.9788
- Rent YoY
- ▼ -1.32%
- Metro
- San Antonio-New Braunfels, TX
- State GDP YoY
- ▲ 3.95%
- F500 in state
- 110
Industry mix (Fortune 500 HQ in TX)
| Industry | F500 HQs | Revenue |
|---|---|---|
| Energy | 16 | $1,198B |
|
||
| Technology | 5 | $198B |
|
||
| Engineering / Construction | 4 | $72B |
|
||
| Energy Services | 3 | $60B |
|
||
| Utilities | 3 | $41B |
|
||
| Healthcare | 2 | $330B |
|
||
Price history
+294.5% since first listed20 events — show timeline
- 2026-05-11 Contingent — LERA
- 2026-04-10 Price Changed $149,900 LERA
- 2026-04-01 Listed $152,500 LERA
- 2026-03-31 Listing Removed — LERA
- 2026-03-21 Relisted — LERA
- 2026-03-16 Pending — LERA
- 2026-03-09 Contingent — LERA
- 2026-02-23 Relisted — LERA
- 2026-02-19 Contingent — LERA
- 2026-02-04 Relisted — LERA
- 2026-02-02 Contingent — LERA
- 2026-01-29 Price Changed $152,500 LERA
- 2025-12-10 Price Changed $155,000 LERA
- 2025-11-18 Listed $159,900 LERA
- 2025-09-29 Sold (Public Records) — Public Records
- 2020-07-10 Sold (Public Records) — Public Records
- 2013-12-10 Sold (MLS) — LERA
- 2013-11-08 Pending — LERA
- 2013-10-30 Listed $38,000 LERA
- 2005-05-31 Sold (Public Records) — Public Records
Property tax history
+8.6%/yrLatest (2025): $3,576 · -3.5% YoY. Source: county tax records.
Cash-flow waterfall
monthlySold comps — $/sqft
last 12 mo · ≤1 miLoading sold comps…