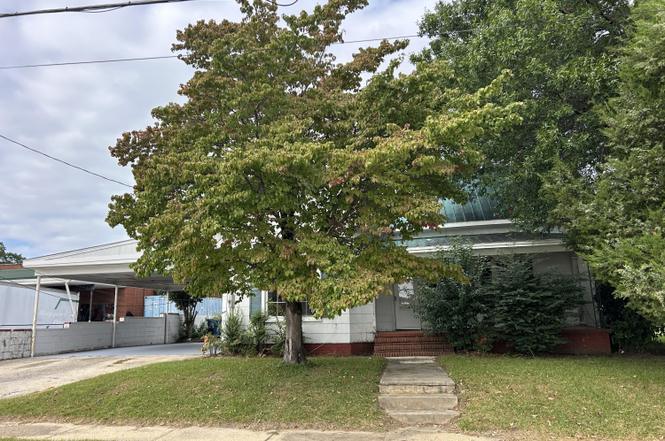
209 E Harnett St · Dunn, NC
Flood risk 1/10 · Minimal
- FEMA flood zone
- X (unshaded)
- Chance of flooding over 30 yrs
- 0.0%
- Est. flood insurance / yr
- $507 – $1,088
Fire risk 1/10 · Minimal
- Est. fire insurance / yr
- $906 – $1,684
Heat risk 7/10 · Major
- Hot days now (above 106°F)
- 7 days/yr
- Hot days in 30 yrs
- 17 days/yr
Wind risk 7/10 · Major
- Chance of severe wind over 30 yrs
- 78.0%
Air-quality risk 2/10 · Minimal
- Unhealthy air days now
- 1 days/yr
- Unhealthy air days in 30 yrs
- 1 days/yr
Risk factors via First Street. Map © Google.
Why this score? — see what drove the C+ grade
The composite is a weighted blend of 9 inputs, each scored 0–100. Each bar is that input's sub-score; the figure is the points it added to the 100-point composite (weight × sub-score).
- Cash flow +23.6/30.0
- ARV discount +15.0/15.0
- DSCR +7.6/10.0
- 1% rule +5.4/10.0
- Livability +3.2/5.0
- Schools +3.0/10.0
- Rent growth +2.5/5.0
- Condition / age +2.5/5.0
- Appreciation +0.0/10.0
$150,000
🖨 Deal sheet (PDF) 📄 Offer letter ✓ Due diligence
Listing remarks
Charming Downtown Dunn Home - Convenient Location! Welcome to this 3-bedroom, 1-bath home located right in the heart of Dunn—just three blocks from Main Street and directly across from the business district. Offering approximately 1,410 sq. ft. of living space on a 0.25-acre lot, this property blends comfort, convenience, and character. Step inside to find a large family room that can be accessed from both the front entry and the kitchen. The spacious eat-in kitchen is perfect for gatherings, while the hardwood floors throughout most of the home add warmth and appeal. (Kitchen features durable laminate flooring. ) Additional highlights include: 3 comfortable bedrooms 2-car carport
Key facts
- 2-car carport
- Large family room
- 0.25 acre lot
Tags
Property features AI
Finance
- HOA & community: No association
Exterior
- Parking: 2-space carport
- Utilities: Public water; Public sewer; Septic connected; Cable available
- Home design: Single-story house
- Construction: Asbestos construction material; Asbestos shingle roof; Brick/mortar foundation; Built as a house
- Exterior features: Cleared yard
Interior
- Kitchen: Electric range
- Bedrooms: 3 bedrooms
- Flooring: Hardwood; Laminate
- Bathrooms: 1 full bathroom
- Heating & cooling: Forced air heating (gas pack); Central air conditioning; Ceiling fan(s)
- Interior features: Ceiling fan(s); Eat-in kitchen; Kitchen and dining room combination; Laminate countertops
- Laundry & utility: Dedicated laundry room; Electric water heater
Neighborhood map
What this means for you Summary
Snapshot
- This is a 3-bed/1.0-bath single-family listed at $150k.
Deal economics
- At list price, monthly cash flow is $283 ($3k/yr) — positive.
- The deal already cash-flows at list — no discount required.
- Meets the 1% rule at list price ($2k rent vs $150k).
- Recommended offer: $132k (12.0% below list) — sets the bar for market timing.
- Cap rate 8.6% vs local median 4.0% in Dunn — top-decile yield for the area; either an underpriced asset or a hidden risk that comps aren't pricing in. Stress-test before assuming the spread holds.
Location & tenants
- Location reads 63/100 on livability (#390 in NC) — a middle-class / working-renter tenant base. Strengths: cost of living A+, health & safety A+, housing A; Watch: crime F, commute F, employment F.
- Harnett County Schools (rural): math 31% / reading 39% proficiency, ranked #130 of 178 in NC (top 73%) — families likely to look elsewhere, expect single-tenant / working-renter base with shorter leases.
- Zoned schools: Dunn Elementary (math 22% / reading 22%, grade F, #1,190 of 1,410 statewide, top 86%, 799 students, 99% FRL); Dunn Middle (math 12% / reading 29%, grade F, #427 of 475 statewide, top 90%, 412 students, 99% FRL); Triton High (math 41% / reading 49%, grade D-, #350 of 535 statewide, top 66%, 1,287 students, 63% FRL) — zoned schools average 87% FRL vs 51% district-wide (36 pts higher); higher-poverty schools than district average — tighter screening recommended.
- Market conditions: 341 active listings in the ZIP; 4 comparable units currently listed for rent nearby; rentals at typical pace (median 16d on market — plan ~3-4 weeks tenant-placement turnaround); 2,080 units permitted in Harnett County in 2024 (12 in 5+ unit buildings).
- This rent runs 35% of the median local income ($53k/yr) — at the standard rent-burdened threshold; future hikes will face affordability resistance.
Forward outlook
- Local home prices are declining (-3.0%/yr); year-one equity from $1k of loan paydown is wiped out by about $4k of value loss. Plan a longer hold.
- Harnett County population projected at +42% by 2050 — long-run rental-demand tailwind backs the buy-and-hold thesis.
Negotiation context
- It's been on market 267 days — a 12% lower offer ($132k) is reasonable based on typical stale-listing flexibility.
- 2 sale attempts; this cycle's ask has dropped $60k (29%) from the opening price — seller is motivated, your offer sets the floor, not the list.
Risks & watch-outs
- Watch-outs: built in 1905 — expect roof / HVAC / electrical / plumbing capex.
- Climate carrying-cost: major wind risk, 78% chance of damaging wind over 30y; extreme-heat days projected 7→17/yr by 2055 (HVAC capex compounding) — expect insurance premiums to compound above CPI over the hold.
Questions for the listing agent
- It's been on market 267 days. Have you received any prior offers? Is the seller open to a 12% concession, seller financing, or rate buy-down credit?
- Built in 1905 — when were the roof, HVAC, electrical panel, plumbing, and water heater last replaced?
- Why hasn't it sold? Are there any deal-killer items the seller is aware of (foundation, flood, title, zoning, code violations)?
- Is there a deadline driving the sale (1031 exchange, divorce, estate, relocation)? That informs how much negotiation room exists.
- Schools are D-rated, which usually means shorter tenancies and higher turnover. Who's the typical renter profile here, and what's been the actual vacancy rate?
- Crime grade is F in this area — have there been break-ins, vandalism, or insurance claims at this property in the last 3 years? What carrier currently insures it and at what premium?
- What's the average days-on-market for RENTAL listings here right now (not sales)? A rising rental-DOM trend means longer vacancies and softer asking-rent achievability than the comps imply.
- What's the recent tenant-quality profile in this submarket — average credit score on applications, eviction rate, late-payment / NSF rate, and stable-employment percentage? A property-management company in the area should have these aggregated.
- How much new for-sale + rental construction is in the pipeline within 1–3 miles? Heavy new supply typically softens prices + rents 12–24 months out; constrained supply supports both.
Investment metrics
- 1% rule
- 1.04% ✓
- Cap rate
- 8.56%
- Cash-on-cash
- 8.09%
- DSCR
- 1.36
- GRM
- 8.0
CMA / ARV
- ARV (on-the-fly)
- $255,210
- Comps found
- 12
Show comp detail 12 sales within ~0.75 mi
| Address | Dist | Beds/Ba | Sqft | Sold | Price | $/sf | Match |
|---|---|---|---|---|---|---|---|
| 203 N Fayetteville Ave | 0.21mi | 3/2.5 | 1,382 (-2%) | 18mo | $220,000 | $159 | 66 |
| 311 N Layton Ave | 0.35mi | 3/2.0 | 1,350 (-4%) | 9mo | $202,500 | $150 | 65 |
| 111 Spring Branch Rd | 0.60mi | 3/2.0 | 1,403 (-0%) | 11mo | $199,879 | $142 | 58 |
| 1007 N King Ave | 0.57mi | 3/2.0 | 1,422 (+1%) | 13mo | $258,000 | $181 | 57 |
| 205 N Layton Ave | 0.35mi | 2/2.0 (-1) | 1,360 (-4%) | 15mo | $205,000 | $151 | 56 |
| 109 E Granville St | 0.47mi | 3/2.0 | 1,368 (-3%) | 16mo | $216,500 | $158 | 55 |
| 606 E Pearsall St | 0.47mi | 3/2.0 | 1,300 (-8%) | 12mo | $225,000 | $173 | 51 |
| 309 S Mckay Ave | 0.52mi | 3/1.0 | 1,199 (-15%) | 10mo | $245,000 | $204 | 42 |
| 604 E Pope St | 0.53mi | 3/2.0 | 1,215 (-14%) | 13mo | $240,500 | $198 | 38 |
| 604 E Pope St | 0.52mi | 3/2.0 | 1,215 (-14%) | 13mo | $240,500 | $198 | 38 |
| 503 W Wake St | 0.72mi | 3/2.0 | 1,198 (-15%) | 16mo | $220,000 | $184 | 25 |
| 1022 E Harnett St | 0.72mi | 3/3.0 | 1,205 (-14%) | 18mo | $245,000 | $203 | 19 |
Match score weights: distance 35% · size 25% · config 20% · recency 20%. Top-matched comps best support the ARV.
Projected returns pro-forma
-3.0% appreciation · 3.0% rent growth · sell at horizon
- IRR
- -4.0%
- Equity multiple
- 0.85×
- Total profit
- $-6,297
- Equity at exit
- $22,365
- IRR
- 5.7%
- Equity multiple
- 1.42×
- Total profit
- $17,632
- Equity at exit
- $12,969
Cash invested: $42,000 (down + closing). Projections, not guarantees.
Landlord ↔ Tenant lean methodology
- Overall (STATE)
- 85 Strongly Landlord-Friendly
- State North Carolina
- 85 Strongly Landlord-Friendly · R+3
- County
- — inherits STATE
- City
- — inherits STATE
ZIP-level market 28334
- Home prices YoY
- -13.2%
- Active inventory
- 341
- Price-to-rent
- 8.0×
Monthly cashflow live
- Estimated rent
- $1,566 medium interval (Pro) →
- Mortgage (P&I)
- −$787
- Tax from tax record
- −$105 /mo · $1,259/yr
- Insurance
- −$62
- HOA
- −$0
- Vacancy / Maint / Mgmt
- −$329
- Net cashflow
- $283
Break-even live
Sensitivity live
| Price | -10% $368 | -5% $326 | +0% $283 | +5% $241 | +10% $198 |
|---|---|---|---|---|---|
| Rent | -10% $159 | -5% $221 | +0% $283 | +5% $345 | +10% $407 |
| Rate | -1.0pp $359 | -0.5pp $321 | base $283 | +0.5pp $244 | +1.0pp $205 |
UW: 25.0% down · 7.5% · 30yr · 1.5% tax · 5.0% vac · 8.0% maint · 8.0% mgmt
Financing live
Cash to close
- Down payment
- $37,500
- Closing costs
- $4,500
- Reserves months
- —
- Total cash needed
- —
Loan-product check · same deal, 3 products live
Conventional
25% down · 7.5% · 30yr
- Down + closing
- —
- Monthly P&I
- —
- Monthly cashflow
- —
- DSCR
- —
- Eligible?
- —
Personal DTI + credit; lowest rate.
DSCR
20% down · 8.5% · 30yr
- Down + closing
- —
- Monthly P&I
- —
- Monthly cashflow
- —
- DSCR
- —
- Eligible?
- —
No personal income docs; deal must DSCR.
Hard money
10% down · 12.0% · 12mo
- Down + closing
- —
- Monthly P&I
- —
- Monthly cashflow
- —
- DSCR
- —
- Eligible?
- —
Short-term bridge; refi at stabilization.
Rent comps 4 comps
| Address | Beds | Baths | Sqft | Rent | $/sqft | DOM | Units | Dist |
|---|---|---|---|---|---|---|---|---|
| 202 S Sampson Ave Dunn, NC | 3.0 | 1.0 | 1418 | $1,600 | $1.13 | 16d | 1 | 0.58mi |
| 807 N Ellis Ave Dunn, NC | 2.0 | 1.0 | 1100 | $1,400 | $1.27 | 16d | 1 | 0.62mi |
| 1001 Webster Dr Dunn, NC | 1.0–3.0 | 1.0–1.5 | 900 | $1,300 | $1.44 | 14d | 1 | 1.21mi |
| 108 Jude Ct Dunn, NC | 3.0 | 2.0 | 1350 | $1,650 | $1.22 | 23d | 1 | 1.35mi |
Listing history 22 events
-
2026-06-21days on market $150,000 Active 267 DOM
-
2026-06-18days on market $150,000 Active 264 DOM
-
2026-06-17days on market $150,000 Active 263 DOM
-
2026-06-16days on market $150,000 Active 262 DOM
-
2026-06-15days on market $150,000 Active 261 DOM
-
2026-06-14days on market $150,000 Active 259 DOM
-
2026-06-10days on market $150,000 Active 256 DOM
-
2026-06-09days on market $150,000 Active 255 DOM
-
2026-06-08days on market $150,000 Active 254 DOM
-
2026-06-07days on market $150,000 Active 253 DOM
-
2026-06-05days on market $150,000 Active 250 DOM
-
2026-06-03days on market $150,000 Active 249 DOM
-
2026-06-02days on market $150,000 Active 248 DOM
-
2026-06-01days on market $150,000 Active 247 DOM
-
2026-05-31days on market $150,000 Active 246 DOM
-
2026-05-30days on market $150,000 Active 245 DOM
-
2026-05-03price $150,000
-
2026-02-21price $167,900
-
2026-01-22status Active
-
2026-01-11status Pending
-
2025-11-13price $175,000
-
2025-09-16$209,900 Active
ⓘ Source: listings_history table (triggers on properties + properties_extension) + one-shot
backfill from property_details.listing_events for pre-trigger history.
Tax reassessment forecast NC · Resets to sale price
- Current annual tax
- $1,259 · $105/mo
- Projected year-2 tax
- $1,259 · $105/mo
- Expected delta
- $0/yr ($0/mo · 0.0%)
ⓘ Screening estimate from a state-policy table — verify with the county assessor before closing.
Climate risk First Street
- Flood 1/10 Low FEMA zone X (unshaded) · 0% chance over 30 yrs
- Wildfire 1/10 Low
- Heat 7/10 Severe 7 d/yr ≥106°F today · 17 d/yr by 30 yrs out
- Wind 7/10 Severe 78% chance of damaging wind over 30 yrs
- Air quality 2/10 Low 1 unhealthy d/yr today · 1 by 30 yrs out
Nearby sold comps map
Loading sold comps map…
Walkable amenities ~0.75 mi
Loading nearby amenities…
Taxation est. · year 1
- Rental income
- $18,793
- − Mortgage interest
- −$8,402
- − Property taxes
- −$1,259
- − Insurance
- −$750
- − Repairs & maintenance
- −$1,503
- − Management
- −$1,503
- − Depreciation
- −$4,364
- Taxable income
- $1,011
- Est. tax owed @ 24.0%
- −$243
- After-tax cash flow
- $3,156/yr
For passive investors: Depreciation is non-cash, so a rental often shows a tax loss while cash-flowing — sheltering income. Rental losses are passive: they offset passive income freely, and up to $25,000/yr can offset ordinary (W-2) income if you actively participate and your MAGI is under $100k (phasing out to $0 by $150k); unused losses carry forward. On sale, claimed depreciation is recaptured at up to 25%, and gains may owe capital-gains tax (a 1031 exchange can defer both). Figures are a year-1 estimate at your 24.0% rate — not tax advice; consult a CPA.
Schools (NCES district)
- District
- Harnett County Schools
- NCES district ID
- 3702010
- Math proficiency
- 31% ▼ -2.00%
- Reading proficiency
- 39% ▼ -1.00%
- Median HH income
- $45,400
- Composite
- 29.88/100
- National rank
- #6397
- State rank
- #130 of 178 in NC
Livability — Dunn
- Score
- 63/100
- State rank
- #390
- US rank
- #15160
Category grades
Schools grade is shown separately in the Schools card above.
Census & demographics
- Census place
- Dunn, NC
- County
- Harnett County · 125,715 people
- City population
- 22,873
- Metro
- Fayetteville, NC
- Population (ZIP)
- 22,873
- Household income
- $53,036
- Rent vs Own
- Severe rent burden
- 382.0
Population outlook (Harnett County) Hauer SSP2
- Today (2025)
- 153,758 people
- By 2030
- 166,581 · +8.3%
- By 2040
- 192,741 · +25.4%
- By 2050
- 218,332 · +42.0%
- By 2075
- 275,422 · +79.1%
- By 2100
- 313,511 · +103.9%
Race, ethnicity, and origin ACS 2023
- Neighborhood character
- Majority White (64%)
- Race & ethnicity
- White 64% Black 20% Hispanic / Latino 13% Two or more races 4%
- Hispanic origin (detail)
- Mexican 9% Puerto Rican 2%
- Common ancestry
- Serbian 3% Slovak 1% Romanian 1%
- Foreign-born
- 5% · Canada, Guatemala
- Languages at home
- 88% English-only · Spanish 11%
Political lean MEDSL · Harnett
- 2024 margin
- Strong R (+25.1) · D 36.9% · R 62.0% · Other 1.1%
- 2008→2024 swing
- -8.4pp toward R · 2008: -16.7pp · 2024: -25.1pp
- All cycles
- 2024: R+25.1 2020: R+22.4 2016: R+24.1 2012: R+19.4 2008: R+16.7
Not yet ingested
- Civics
- —
Market trends
- HPI YoY
- ▼ -41.76%
- Current HPI
- 275.5055
- Rent YoY
- —
- Metro
- Fayetteville, NC
- State GDP YoY
- ▲ 3.28%
- F500 in state
- 26
Industry mix (Fortune 500 HQ in NC)
| Industry | F500 HQs | Revenue |
|---|---|---|
| Financial Services | 2 | $213B |
|
||
| Retail | 2 | $95B |
|
||
| Industrial Conglomerate | 1 | $38B |
|
||
| Metals / Steel | 1 | $35B |
|
||
| Utilities | 1 | $30B |
|
||
| Industrial Machinery | 1 | $19B |
|
||
Price history
-28.5% since first listed6 events — show timeline
- 2026-05-03 Price Changed $150,000 TMLS
- 2026-02-21 Price Changed $167,900 TMLS
- 2026-01-22 Relisted — TMLS
- 2026-01-11 Pending — TMLS
- 2025-11-13 Price Changed $175,000 TMLS
- 2025-09-16 Listed $209,900 TMLS
Property tax history
+5.5%/yrLatest (2025): $1,259 · +2.9% YoY. Source: county tax records.
Cash-flow waterfall
monthlySold comps — $/sqft
last 12 mo · ≤1 miLoading sold comps…