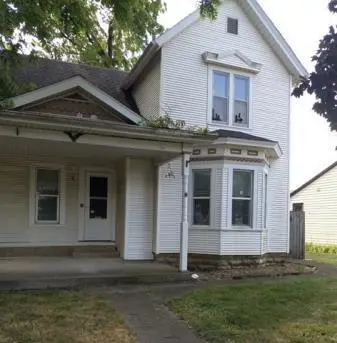
203 N Oak St · Herscher, IL
Flood risk 1/10 · Minimal
- FEMA flood zone
- X (unshaded)
- Chance of flooding over 30 yrs
- 0.0%
- Est. flood insurance / yr
- $473 – $860
Fire risk 1/10 · Minimal
- Est. fire insurance / yr
- $804 – $1,492
Heat risk 3/10 · Minor
- Hot days now (above 103°F)
- 7 days/yr
- Hot days in 30 yrs
- 17 days/yr
Wind risk 2/10 · Minimal
- Chance of severe wind over 30 yrs
- 1.0%
Air-quality risk 2/10 · Minimal
- Unhealthy air days now
- 1 days/yr
- Unhealthy air days in 30 yrs
- 2 days/yr
Risk factors via First Street. Map © Google.
Why this score? — see what drove the B- grade
The composite is a weighted blend of 9 inputs, each scored 0–100. Each bar is that input's sub-score; the figure is the points it added to the 100-point composite (weight × sub-score).
- Cash flow +30.0/30.0
- 1% rule +10.0/10.0
- DSCR +10.0/10.0
- ARV discount +7.5/15.0
- Livability +3.5/5.0
- Schools +3.0/10.0
- Rent growth +2.5/5.0
- Condition / age +2.5/5.0
- Appreciation +0.0/10.0
$79,999
🖨 Deal sheet 📄 Offer letter ✓ Due diligence
Listing remarks MLS
Explore the potential at 203 North Oak Street in Herscher, IL! This 3-bedroom, 2-bathroom home offers 1,260 square feet of living space and sits on a 0.16-acre lot. Perfect for investors or buyers ready to bring their vision to life, this property provides an excellent opportunity to renovate and make it your own. While it needs work, the home's layout and location make it a fantastic investment or starter project. Don't miss this chance to create something special-
Key facts
- 6,969 sq ft lot
- 2 garage spots
- Built 1912
Neighborhood map
What this means for you Summary
Snapshot
- This is a 3-bed/2.0-bath other listed at $80k.
Deal economics
- At list price, monthly cash flow is $356 ($4k/yr) — positive.
- The deal already cash-flows at list — no discount required.
- Meets the 1% rule at list price ($1k rent vs $80k).
- Recommended offer: $79k (1.5% below list) — sets the bar for market timing.
Location & tenants
- Location reads 69/100 on livability (#440 in IL) — a middle-class / working-renter tenant base. Strengths: crime A+, cost of living A+, housing A+; Watch: schools C-, health & safety C-, amenities F.
- Herscher CUSD 2 (rural): math 32% / reading 32% proficiency, ranked #202 of 620 in IL (top 33%) — families likely to look elsewhere, expect single-tenant / working-renter base with shorter leases.
- Market conditions: 21 active listings in the ZIP; 145 units permitted in Kankakee County in 2024 (5 in 5+ unit buildings).
Forward outlook
- Local home prices are declining (-3.0%/yr); year-one equity from $553 of loan paydown is wiped out by about $2k of value loss. Plan a longer hold.
- Kankakee County population projected at -19% by 2050 — secular population decline; favor cash flow + early exit over multi-decade hold.
- At projected returns (-3.0% appreciation + 3.0% rent growth), your $22k cash investment doubles in ~7 years — after that, you're playing with house money.
Negotiation context
- It's been on market 23 days — a 2% lower offer ($79k) is reasonable based on typical stale-listing flexibility.
- 11 sale attempts since 12y ago; this cycle's ask has dropped $30k (27%) from the opening price — seller is motivated, your offer sets the floor, not the list.
- Current owner paid $45k; list at $80k implies a 79% gain — meaningful room to come down on a strong offer.
Risks & watch-outs
- Watch-outs: property tax is 3.4% of price; built in 1912 — expect roof / HVAC / electrical / plumbing capex.
Questions for the listing agent
- Built in 1912 — when were the roof, HVAC, electrical panel, plumbing, and water heater last replaced?
- Property tax is high relative to price — has the assessment been appealed recently, and will the sale trigger a re-assessment?
- Is there a deadline driving the sale (1031 exchange, divorce, estate, relocation)? That informs how much negotiation room exists.
- What's the average days-on-market for RENTAL listings here right now (not sales)? A rising rental-DOM trend means longer vacancies and softer asking-rent achievability than the comps imply.
- What's the recent tenant-quality profile in this submarket — average credit score on applications, eviction rate, late-payment / NSF rate, and stable-employment percentage? A property-management company in the area should have these aggregated.
- How much new for-sale + rental construction is in the pipeline within 1–3 miles? Heavy new supply typically softens prices + rents 12–24 months out; constrained supply supports both.
Investment metrics
- 1% rule
- 1.64% ✓
- Cap rate
- 11.63%
- Cash-on-cash
- 19.06%
- DSCR
- 1.85
- GRM
- 5.1
CMA / ARV
- ARV (median comp)
- $197,322
- List price
- $79,999
- Delta
- -56.92%
- Verdict
- UNDERPRICED
- Comps
- 20 within 1.0 mi
Projected returns pro-forma
-3.0% appreciation · 3.0% rent growth · sell at horizon
- IRR
- 11.0%
- Equity multiple
- 1.44×
- Total profit
- $9,801
- Equity at exit
- $11,928
- IRR
- 20.1%
- Equity multiple
- 2.70×
- Total profit
- $38,121
- Equity at exit
- $6,917
Cash invested: $22,400 (down + closing). Projections, not guarantees.
Landlord ↔ Tenant lean methodology
- Overall (STATE)
- 43 Moderately Tenant-Leaning
- State Illinois
- 43 Moderately Tenant-Leaning · D+7
- County
- — inherits STATE
- City
- — inherits STATE
ZIP-level market 60941
- Home prices YoY
- -16.1%
- Active inventory
- 21
- Price-to-rent
- 5.1×
Monthly cashflow live
- Estimated rent
- $1,313 medium interval (Pro) →
- Mortgage (P&I)
- −$420
- Tax from tax record
- −$229 /mo · $2,743/yr
- Insurance
- −$33
- HOA
- −$0
- Vacancy / Maint / Mgmt
- −$276
- Net cashflow
- $356
Break-even live
UW: 25.0% down · 7.5% · 30yr · 1.5% tax · 5.0% vac · 8.0% maint · 8.0% mgmt
Financing live
Cash to close
- Down payment
- $20,000
- Closing costs
- $2,400
- Reserves months
- —
- Total cash needed
- —
Loan-product check · same deal, 3 products live
Conventional
25% down · 7.5% · 30yr
- Down + closing
- —
- Monthly P&I
- —
- Monthly cashflow
- —
- DSCR
- —
- Eligible?
- —
Personal DTI + credit; lowest rate.
DSCR
20% down · 8.5% · 30yr
- Down + closing
- —
- Monthly P&I
- —
- Monthly cashflow
- —
- DSCR
- —
- Eligible?
- —
No personal income docs; deal must DSCR.
Hard money
10% down · 12.0% · 12mo
- Down + closing
- —
- Monthly P&I
- —
- Monthly cashflow
- —
- DSCR
- —
- Eligible?
- —
Short-term bridge; refi at stabilization.
Listing history 50 events
-
2026-06-19days on market $79,999 Active 23 DOM
-
2026-06-18days on market $79,999 Active 22 DOM
-
2026-06-17days on market $79,999 Active 21 DOM
-
2026-06-16days on market $79,999 Active 20 DOM
-
2026-06-15days on market $79,999 Active 19 DOM
-
2026-06-14days on market $79,999 Active 17 DOM
-
2026-06-13days on market $79,999 Active 16 DOM
-
2026-06-10pricedays on market $79,999 Active 14 DOM
-
2026-06-09days on market $84,999 Active 13 DOM
-
2026-06-08days on market $84,999 Active 12 DOM
-
2026-06-07days on market $84,999 Active 11 DOM
-
2026-06-05days on market $84,999 Active 8 DOM
-
2026-06-03days on market $84,999 Active 7 DOM
-
2026-06-02days on market $84,999 Active 6 DOM
-
2026-06-01days on market $84,999 Active 5 DOM
-
2026-05-31days on market $84,999 Active 4 DOM
-
2026-05-30days on market $84,999 Active 3 DOM
-
2026-05-19price $84,999 470-char remark
Show marketing remark (470 chars)
Explore the potential at 203 North Oak Street in Herscher, IL! This 3-bedroom, 2-bathroom home offers 1,260 square feet of living space and sits on a 0.16-acre lot. Perfect for investors or buyers ready to bring their vision to life, this property provides an excellent opportunity to renovate and make it your own. While it needs work, the home's layout and location make it a fantastic investment or starter project. Don't miss this chance to create something special-
-
2026-04-23price $89,999 470-char remark
Show marketing remark (470 chars)
Explore the potential at 203 North Oak Street in Herscher, IL! This 3-bedroom, 2-bathroom home offers 1,260 square feet of living space and sits on a 0.16-acre lot. Perfect for investors or buyers ready to bring their vision to life, this property provides an excellent opportunity to renovate and make it your own. While it needs work, the home's layout and location make it a fantastic investment or starter project. Don't miss this chance to create something special-
-
2026-04-07price $94,900 470-char remark
Show marketing remark (470 chars)
Explore the potential at 203 North Oak Street in Herscher, IL! This 3-bedroom, 2-bathroom home offers 1,260 square feet of living space and sits on a 0.16-acre lot. Perfect for investors or buyers ready to bring their vision to life, this property provides an excellent opportunity to renovate and make it your own. While it needs work, the home's layout and location make it a fantastic investment or starter project. Don't miss this chance to create something special-
-
2025-12-30status Active 470-char remark
Show marketing remark (470 chars)
Explore the potential at 203 North Oak Street in Herscher, IL! This 3-bedroom, 2-bathroom home offers 1,260 square feet of living space and sits on a 0.16-acre lot. Perfect for investors or buyers ready to bring their vision to life, this property provides an excellent opportunity to renovate and make it your own. While it needs work, the home's layout and location make it a fantastic investment or starter project. Don't miss this chance to create something special-
-
2025-12-15status Pending 470-char remark
Show marketing remark (470 chars)
Explore the potential at 203 North Oak Street in Herscher, IL! This 3-bedroom, 2-bathroom home offers 1,260 square feet of living space and sits on a 0.16-acre lot. Perfect for investors or buyers ready to bring their vision to life, this property provides an excellent opportunity to renovate and make it your own. While it needs work, the home's layout and location make it a fantastic investment or starter project. Don't miss this chance to create something special-
-
2025-11-26$110,000 Active 470-char remark
Show marketing remark (470 chars)
Explore the potential at 203 North Oak Street in Herscher, IL! This 3-bedroom, 2-bathroom home offers 1,260 square feet of living space and sits on a 0.16-acre lot. Perfect for investors or buyers ready to bring their vision to life, this property provides an excellent opportunity to renovate and make it your own. While it needs work, the home's layout and location make it a fantastic investment or starter project. Don't miss this chance to create something special-
-
2025-08-06historical
-
2025-08-06status Active
-
2025-06-03status Pending
-
2025-03-18Active
-
2021-08-20historical
-
2021-07-21price
-
2021-06-23price
-
2021-05-24price
-
2021-05-05New
-
2019-04-03historical Contingent
-
2019-04-03historical
-
2019-03-15New
-
2019-03-14historical
-
2019-03-08price
-
2019-01-15price
-
2018-11-28price
-
2018-10-23price
-
2018-09-12New
-
2018-08-28historical
-
2018-07-25New
-
2017-03-11historical
-
2017-01-12New
-
2017-01-12historical
-
2016-09-16price
-
2016-08-05price
-
2016-07-13price
-
2016-06-14price
ⓘ Source: listings_history table (triggers on properties + properties_extension) + one-shot
backfill from property_details.listing_events for pre-trigger history.
Tax reassessment forecast IL · Partial reset (capped growth)
- Current annual tax
- $2,743 · $229/mo
- Projected year-2 tax
- $2,743 · $229/mo
- Expected delta
- $0/yr ($0/mo · 0.0%)
ⓘ Screening estimate from a state-policy table — verify with the county assessor before closing.
Climate risk First Street
- Flood 1/10 Low FEMA zone X (unshaded) · 0% chance over 30 yrs
- Wildfire 1/10 Low
- Heat 3/10 Moderate 7 d/yr ≥103°F today · 17 d/yr by 30 yrs out
- Wind 2/10 Low 100% chance of damaging wind over 30 yrs
- Air quality 2/10 Low 1 unhealthy d/yr today · 2 by 30 yrs out
Nearby sold comps map
Loading sold comps map…
Walkable amenities ~0.75 mi
Loading nearby amenities…
Taxation est. · year 1
- Rental income
- $15,756
- − Mortgage interest
- −$4,481
- − Property taxes
- −$2,743
- − Insurance
- −$400
- − Repairs & maintenance
- −$1,260
- − Management
- −$1,260
- − Depreciation
- −$2,327
- Taxable income
- $3,284
- Est. tax owed @ 24.0%
- −$788
- After-tax cash flow
- $3,482/yr
For passive investors: Depreciation is non-cash, so a rental often shows a tax loss while cash-flowing — sheltering income. Rental losses are passive: they offset passive income freely, and up to $25,000/yr can offset ordinary (W-2) income if you actively participate and your MAGI is under $100k (phasing out to $0 by $150k); unused losses carry forward. On sale, claimed depreciation is recaptured at up to 25%, and gains may owe capital-gains tax (a 1031 exchange can defer both). Figures are a year-1 estimate at your 24.0% rate — not tax advice; consult a CPA.
Schools (NCES district)
- District
- Herscher CUSD 2
- NCES district ID
- 1718840
- Math proficiency
- 32% ▲ 2.00%
- Reading proficiency
- 32% ▼ -10.00%
- Median HH income
- $69,778
- Composite
- 29.76/100
- National rank
- #6435
- State rank
- #202 of 620 in IL
Livability — Herscher
- Score
- 69/100
- State rank
- #440
- US rank
- #9007
Category grades
Schools grade is shown separately in the Schools card above.
Census & demographics
- Census place
- Herscher, IL
- Population (ZIP)
- 1,603
Population outlook (Kankakee County) Hauer SSP2
- Today (2025)
- 105,479 people
- By 2030
- 101,792 · -3.5%
- By 2040
- 93,479 · -11.4%
- By 2050
- 85,061 · -19.4%
- By 2075
- 67,314 · -36.2%
- By 2100
- 52,439 · -50.3%
Race, ethnicity, and origin ACS 2023
- Neighborhood character
- Predominantly White (97%)
- Race & ethnicity
- White 97% Hispanic / Latino 1% Two or more races 1%
- Common ancestry
- Lithuanian 10% Romanian 5% Portuguese 4%
- Foreign-born
- 0%
Political lean MEDSL · Kankakee
- 2024 margin
- Strong R (+20.8) · D 38.7% · R 59.5% · Other 1.8%
- 2008→2024 swing
- -25.4pp toward R · 2008: 4.6pp · 2024: -20.8pp
- All cycles
- 2024: R+20.8 2020: R+16.5 2016: R+13.3 2012: R+3.4 2008: D+4.6
Not yet ingested
- Civics
- —
Market trends
- HPI YoY
- ▼ -34.49%
- Current HPI
- 180.2725
- Rent YoY
- —
- Metro
- —
- State GDP YoY
- ▲ 1.59%
- F500 in state
- 60
Industry mix (Fortune 500 HQ in IL)
| Industry | F500 HQs | Revenue |
|---|---|---|
| Insurance | 4 | $201B |
|
||
| Consumer Goods | 4 | $87B |
|
||
| Industrial Machinery | 3 | $64B |
|
||
| Healthcare | 2 | $55B |
|
||
| Retail / Pharmacy | 1 | $148B |
|
||
| Agriculture / Food | 1 | $86B |
|
||
Price history
-25.0% since first listed40 events — show timeline
- 2026-05-19 Price Changed $84,999 MRED as Distributed by MLS Grid
- 2026-04-23 Price Changed $89,999 MRED as Distributed by MLS Grid
- 2026-04-07 Price Changed $94,900 MRED as Distributed by MLS Grid
- 2025-12-30 Relisted — MRED as Distributed by MLS Grid
- 2025-12-15 Pending — MRED as Distributed by MLS Grid
- 2025-11-26 Listed $110,000 MRED as Distributed by MLS Grid
- 2025-08-06 Listing Removed — MRED as Distributed by MLS Grid
- 2025-08-06 Relisted — MRED as Distributed by MLS Grid
- 2025-06-03 Pending — MRED as Distributed by MLS Grid
- 2025-03-18 Listed — MRED as Distributed by MLS Grid
- 2021-08-20 Listing Removed — MRED as Distributed by MLS Grid
- 2021-07-21 Price Changed — MRED as Distributed by MLS Grid
- 2021-06-23 Price Changed — MRED as Distributed by MLS Grid
- 2021-05-24 Price Changed — MRED as Distributed by MLS Grid
- 2021-05-05 Listed — MRED as Distributed by MLS Grid
- 2019-04-03 Contingent — MRED as Distributed by MLS Grid
- 2019-04-03 Listing Removed — MRED as Distributed by MLS Grid
- 2019-03-15 Listed — MRED as Distributed by MLS Grid
- 2019-03-14 Listing Removed — MRED as Distributed by MLS Grid
- 2019-03-08 Price Changed — MRED as Distributed by MLS Grid
- 2019-01-15 Price Changed — MRED as Distributed by MLS Grid
- 2018-11-28 Price Changed — MRED as Distributed by MLS Grid
- 2018-10-23 Price Changed — MRED as Distributed by MLS Grid
- 2018-09-12 Listed — MRED as Distributed by MLS Grid
- 2018-08-28 Listing Removed — MRED as Distributed by MLS Grid
- 2018-07-25 Listed — MRED as Distributed by MLS Grid
- 2017-03-11 Listing Removed — MRED as Distributed by MLS Grid
- 2017-01-12 Listed — MRED as Distributed by MLS Grid
- 2017-01-12 Listing Removed — MRED as Distributed by MLS Grid
- 2016-09-16 Price Changed — MRED as Distributed by MLS Grid
- 2016-08-05 Price Changed — MRED as Distributed by MLS Grid
- 2016-07-13 Price Changed — MRED as Distributed by MLS Grid
- 2016-06-14 Price Changed — MRED as Distributed by MLS Grid
- 2016-03-18 Listed — MRED as Distributed by MLS Grid
- 2015-04-24 Sold (MLS) $44,650 MRED as Distributed by MLS Grid
- 2015-04-01 Pending — MRED as Distributed by MLS Grid
- 2015-03-11 Price Changed $82,596 MRED as Distributed by MLS Grid
- 2015-02-10 Price Changed $91,773 MRED as Distributed by MLS Grid
- 2015-01-08 Price Changed $101,970 MRED as Distributed by MLS Grid
- 2014-11-07 Listed $113,300 MRED as Distributed by MLS Grid
Property tax history
+3.8%/yrLatest (2024): $2,743 · +5.9% YoY. Source: county tax records.
Cash-flow waterfall
monthlySold comps — $/sqft
last 12 mo · ≤1 miLoading sold comps…