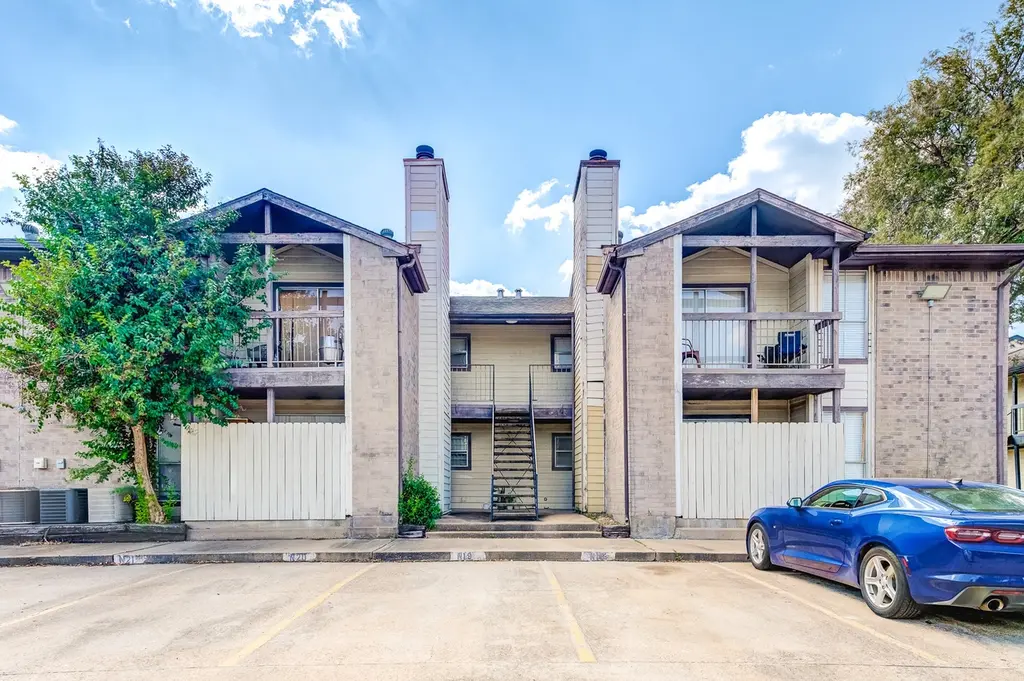
12615 Brookglade Cir #201 · Houston, TX
Flood risk 7/10 · Major
- FEMA flood zone
- AO
- Chance of flooding over 30 yrs
- 0.99%
- Est. flood insurance / yr
- $848 – $2,087
Fire risk 1/10 · Minimal
- Est. fire insurance / yr
- $1,222 – $2,270
Heat risk 9/10 · Severe
- Hot days now (above 111°F)
- 7 days/yr
- Hot days in 30 yrs
- 24 days/yr
Wind risk 9/10 · Severe
- Chance of severe wind over 30 yrs
- 99.0%
Air-quality risk 2/10 · Minimal
- Unhealthy air days now
- 2 days/yr
- Unhealthy air days in 30 yrs
- 2 days/yr
Risk factors via First Street. Map © Google.
Why this score? — see what drove the C- grade
The composite is a weighted blend of 9 inputs, each scored 0–100. Each bar is that input's sub-score; the figure is the points it added to the 100-point composite (weight × sub-score).
- ARV discount +12.0/15.0
- Cash flow +10.7/30.0
- 1% rule +8.5/10.0
- Appreciation +6.3/10.0
- Livability +3.7/5.0
- DSCR +3.1/10.0
- Condition / age +2.5/5.0
- Rent growth +2.1/5.0
- Schools +2.1/10.0
$69,000
🖨 Deal sheet (PDF) 📄 Offer letter ✓ Due diligence
Listing remarks
Consider easy, low-maintenance living in this New Leaf Brookglade Condo, featuring a cozy open layout and living room with sliding door access to a private patio. The galley kitchen is equipped with ample granite countertop space, stainless steel appliances, electric range, and bright white cabinetry. Get comfortable in the primary suite with a walk-in closet and bathroom access. Your covered front outdoor space also gives you room for entertainment or relaxation and is complete with a storage. Upgrades include new renovations, window blinds, and new appliances. Enjoy nearby amenities such as a community pool, Eldridge Park, Arthur Storey Park, and Houston Funplex. Situated off Beltway 8, W
Key facts
- Community pool
- Walk-in closet
- Private patio
Tags
Property features AI
Finance
- HOA & community: Brookglade association; Monthly association fee of $238; HOA covers common areas and trash; Community pool and curbs
Exterior
- Parking: Additional parking available
- Security: Smoke detector(s)
- Utilities: Public water; Public sewer
- Home design: Residential property; Single-story; Built in 1981; Slab foundation
- Construction: Brick and cement siding construction; Composition roof
- Exterior features: Deck; Patio; Concrete road surface
Interior
- Kitchen: Electric oven and electric range; Dishwasher; Garbage disposal; Granite counters
- Bedrooms: Primary bedroom located on the first floor (approx. 14 x 12)
- Flooring: Carpet; Tile
- Bathrooms: One full bathroom
- Heating & cooling: Central heating (electric); Central air conditioning (electric)
- Interior features: Granite counters; Tub with shower; Ceiling fans; One fireplace; Five total rooms
- Laundry & utility: Washer and dryer included; Electric dryer hookup; Utility room on the first floor (approx. 3 x 3)
Neighborhood map
What this means for you Summary
Snapshot
- This is a 1-bed/1.0-bath condo listed at $69k.
Deal economics
- At list price, monthly cash flow is $-155 ($-2k/yr) — negative.
- To cash-flow at today's rent, offer at most $42k (39.6% below list).
- Meets the 1% rule at list price ($931 rent vs $69k).
- Recommended offer: $42k (39.6% below list) — sets the bar for cash-flow.
- Cap rate 5.7% vs local median 3.2% in Houston — top-decile yield for the area; either an underpriced asset or a hidden risk that comps aren't pricing in. Stress-test before assuming the spread holds.
Location & tenants
- Location reads 74/100 on livability (#184 in TX, #4,771 nationally) — a middle-class / working-renter tenant base. Strengths: amenities A+, cost of living A+, housing A+; Watch: crime F.
- Alief ISD (urban): math 23% / reading 28% proficiency, ranked #717 of 826 in TX (top 87%) — low school quality limits family demand, transient renter base, plan for 1-2y turnover; 74% free/reduced lunch — lower-income household profile, screen leases tightly.
- Zoned schools: Alexander El (math 10% / reading 21%, grade F, #3,990 of 4,322 statewide, top 93%, 676 students, 89% FRL); Holub Middle (math 22% / reading 33%, grade F, #1,156 of 1,662 statewide, top 71%, 791 students, 87% FRL); Alief Isd J J A E P (13 students, 77% FRL).
- Market conditions: Rents soft (-1.7%/yr); 147 active listings in the ZIP; 39 comparable units currently listed for rent nearby; rentals leasing fast (median 12d on market — plan ~1-2 weeks tenant-placement turnaround); 29,883 units permitted in Harris County in 2024 (8,621 in 5+ unit buildings).
Forward outlook
- In year one you build about $2k of equity ($477 loan paydown + $2k appreciation (2.6% local appreciation)).
- Harris County population projected at +47% by 2050 — long-run rental-demand tailwind backs the buy-and-hold thesis.
Negotiation context
- Only 3 days on market — expect competitive offers; lowballing is unlikely to land.
- 4 sale attempts since 2y ago with the ask held roughly flat each time — persistent listings suggest the price (not the market) is what's stuck; bring a comps-based counter.
Risks & watch-outs
- Watch-outs: flood insurance adds $122/mo; HOA is 26% of rent.
- Climate carrying-cost: in FEMA flood zone AO (mandatory federal flood insurance); severe wind risk, 99% chance of damaging wind over 30y; extreme-heat days projected 7→24/yr by 2055 (HVAC capex compounding) — expect insurance premiums to compound above CPI over the hold.
Questions for the listing agent
- What do current leases actually rent for vs. the listed asking? Can we see a recent rent roll and the last 12 months of T-12 income?
- What's the actual annual flood-insurance premium (NFIP or private), and is the property in a SFHA with mandatory coverage?
- What does the HOA fee cover, when was the last increase, and are there any pending special assessments or reserve-fund shortfalls?
- Any open or pending special assessments — roof, HVAC, plumbing, elevator, façade? What's the per-unit balance and payoff schedule, and is the seller paying it off at close or rolling it to the buyer?
- Is there a deadline driving the sale (1031 exchange, divorce, estate, relocation)? That informs how much negotiation room exists.
- Schools are D-rated, which usually means shorter tenancies and higher turnover. Who's the typical renter profile here, and what's been the actual vacancy rate?
- Crime grade is F in this area — have there been break-ins, vandalism, or insurance claims at this property in the last 3 years? What carrier currently insures it and at what premium?
- What's the average days-on-market for RENTAL listings here right now (not sales)? A rising rental-DOM trend means longer vacancies and softer asking-rent achievability than the comps imply.
- What's the recent tenant-quality profile in this submarket — average credit score on applications, eviction rate, late-payment / NSF rate, and stable-employment percentage? A property-management company in the area should have these aggregated.
- How much new apartment / multifamily construction is in the pipeline within 1–3 miles? Heavy new supply (>2% of stock underway) typically softens rents 12–24 months out; light construction supports rent growth.
Investment metrics
- 1% rule
- 1.35% ✓
- Cap rate
- 5.73%
- Cash-on-cash
- -2.01%
- DSCR
- 0.91
- GRM
- 6.2
CMA / ARV
- ARV (median comp)
- $76,622
- List price
- $69,000
- Delta
- -9.95%
- Verdict
- FAIR
- Comps
- 20 within 1.0 mi
Projected returns pro-forma
2.64% appreciation · 0.0% rent growth · sell at horizon
- IRR
- -5.0%
- Equity multiple
- 0.73×
- Total profit
- $-5,308
- Equity at exit
- $29,632
- IRR
- -2.3%
- Equity multiple
- 0.68×
- Total profit
- $-6,268
- Equity at exit
- $44,611
Cash invested: $19,320 (down + closing). Projections, not guarantees.
Landlord ↔ Tenant lean methodology
- Overall (STATE)
- 87 Strongly Landlord-Friendly
- State Texas
- 87 Strongly Landlord-Friendly · R+5
- County
- — inherits STATE
- City
- — inherits STATE
ZIP-level market 77099
- Home prices YoY
- 0.8%
- Rents YoY
- -1.7%
- Active inventory
- 147
- Price-to-rent
- 6.2×
Monthly cashflow live
- Estimated rent
- $931 high interval (Pro) →
- Mortgage (P&I)
- −$362
- Tax from tax record
- −$139 /mo · $1,671/yr
- Insurance
- −$29
- Flood insurance flood zone
- −$122 /mo · $1,468/yr
- HOA
- −$238
- Vacancy / Maint / Mgmt
- −$196
- Net cashflow
- $-155
Break-even live
Sensitivity live
| Price | -10% $-116 | -5% $-135 | +0% $-155 | +5% $-174 | +10% $-194 |
|---|---|---|---|---|---|
| Rent | -10% $-228 | -5% $-191 | +0% $-155 | +5% $-118 | +10% $-81 |
| Rate | -1.0pp $-120 | -0.5pp $-137 | base $-155 | +0.5pp $-173 | +1.0pp $-191 |
UW: 25.0% down · 7.5% · 30yr · 1.5% tax · 5.0% vac · 8.0% maint · 8.0% mgmt
Financing live
Cash to close
- Down payment
- $17,250
- Closing costs
- $2,070
- Reserves months
- —
- Total cash needed
- —
Loan-product check · same deal, 3 products live
Conventional
25% down · 7.5% · 30yr
- Down + closing
- —
- Monthly P&I
- —
- Monthly cashflow
- —
- DSCR
- —
- Eligible?
- —
Personal DTI + credit; lowest rate.
DSCR
20% down · 8.5% · 30yr
- Down + closing
- —
- Monthly P&I
- —
- Monthly cashflow
- —
- DSCR
- —
- Eligible?
- —
No personal income docs; deal must DSCR.
Hard money
10% down · 12.0% · 12mo
- Down + closing
- —
- Monthly P&I
- —
- Monthly cashflow
- —
- DSCR
- —
- Eligible?
- —
Short-term bridge; refi at stabilization.
Rent comps 39 comps
| Address | Beds | Baths | Sqft | Rent | $/sqft | DOM | Units | Dist |
|---|---|---|---|---|---|---|---|---|
| 9301 Dairy View Ln Houston, TX | 1.0 | 1.0 | 683 | $1,024 | $1.50 | 14d | 1 | 0.13mi |
| 9301 Dairy View Ln Unit 9322 Houston, TX | 1.0 | 1.0 | 683 | $1,070 | $1.57 | 14d | 1 | 0.22mi |
| 9301 Dairy View Ln Unit 1162 Houston, TX | 1.0 | 1.0 | 683 | $1,035 | $1.52 | 7d | 1 | 0.22mi |
| 9301 Dairy View Ln Unit 1165 Houston, TX | 1.0 | 1.0 | 683 | $1,024 | $1.50 | 0d | 1 | 0.22mi |
| 9301 Dairy View Ln Unit 165 Houston, TX | 1.0 | 1.0 | 468 | $784 | $1.68 | 0d | 1 | 0.22mi |
| 9301 Dairy View Ln Unit 9322 Houston, TX | 1.0 | 1.0 | 683 | $1,074 | $1.57 | 12d | 1 | 0.22mi |
| 9301 Dairy View Ln Unit 9343 Houston, TX | 1.0 | 1.0 | 468 | $814 | $1.74 | 12d | 1 | 0.22mi |
| 9301 Dairy View Ln Unit 321 Houston, TX | 1.0 | 1.0 | 683 | $1,035 | $1.52 | 9d | 1 | 0.22mi |
| 9400 Coventry Square Dr Houston, TX | 1.0–2.0 | 1.0–2.0 | 770 | $784 | $1.02 | 45d | 6 | 0.43mi |
| 9401 Coventry Square Dr Houston, TX | 1.0–2.0 | 1.0–2.0 | 770 | $858 | $1.11 | 3d | 9 | 0.49mi |
| 12023 Bissonnet St Houston, TX | 1.0–2.0 | 1.0–2.0 | 753 | $639 | $0.85 | 45d | 66 | 0.68mi |
| 12023 Bissonnet St Unit 311 Houston, TX | 1.0 | 1.0 | 610 | $613 | $1.00 | 0d | 1 | 0.70mi |
| 13150 Bissonnet St Unit 1047 Houston, TX | 1.0 | 1.0 | 750 | $864 | $1.15 | 0d | 1 | 0.73mi |
| 13150 Bissonnet St Houston, TX | 1.0 | 1.0 | 750 | $823 | $1.10 | 14d | 1 | 0.75mi |
| 9850 S Kirkwood Rd Houston, TX | 1.0–2.0 | 1.0–2.0 | 736 | $760 | $1.03 | 21d | 15 | 0.77mi |
| 9740 Clifton Park Dr Houston, TX | 1.0 | 1.0 | 618 | $890 | $1.44 | 45d | 1 | 0.78mi |
| 13150 Bissonnet St Unit 13201 Houston, TX | 1.0 | 1.0 | 750 | $864 | $1.15 | 45d | 1 | 0.81mi |
| 13150 Bissonnet St Unit 1162 Houston, TX | 1.0 | 1.0 | 750 | $834 | $1.11 | 9d | 1 | 0.81mi |
| 13150 Bissonnet St Unit 13171 Houston, TX | 1.0 | 1.0 | 750 | $869 | $1.16 | 14d | 1 | 0.81mi |
| 13150 Bissonnet St Unit 13224 Houston, TX | 1.0 | 1.0 | 750 | $823 | $1.10 | 0d | 1 | 0.81mi |
| 9408 Synott Rd Houston, TX | 1.0 | 1.0 | 540 | $849 | $1.57 | 45d | 1 | 0.84mi |
| 9402 Synott Rd Houston, TX | 1.0 | 1.0 | 540 | $884 | $1.64 | 14d | 1 | 0.85mi |
| 9402 Synott Rd Unit 9453 Houston, TX | 1.0 | 1.0 | 540 | $905 | $1.68 | 45d | 1 | 0.85mi |
| 9402 Synott Rd Unit 9423 Houston, TX | 1.0 | 1.0 | 540 | $884 | $1.64 | 0d | 1 | 0.85mi |
| 9402 Synott Rd Unit 9423 Houston, TX | 1.0 | 1.0 | 540 | $910 | $1.69 | 14d | 1 | 0.85mi |
| 9402 Synott Rd Unit 321 Houston, TX | 1.0 | 1.0 | 540 | $895 | $1.66 | 9d | 1 | 0.85mi |
| 9402 Synott Rd Unit 1162 Houston, TX | 1.0 | 1.0 | 540 | $895 | $1.66 | 7d | 1 | 0.85mi |
| 11735 S Glen Dr Houston, TX | 1.0–2.0 | 1.0–2.0 | 853 | $910 | $1.07 | 4d | 23 | 1.07mi |
| 7520 Cook Rd Houston, TX | 1.0 | 1.0 | 657 | $940 | $1.43 | 14d | 1 | 1.12mi |
| 7520 Cook Rd Unit 324 Houston, TX | 1.0 | 1.0 | 657 | $951 | $1.45 | 9d | 1 | 1.12mi |
| 7520 Cook Rd Unit 7594 Houston, TX | 1.0 | 1.0 | 657 | $990 | $1.51 | 12d | 1 | 1.12mi |
| 7520 Cook Rd Unit 7541 Houston, TX | 1.0 | 1.0 | 657 | $986 | $1.50 | 14d | 1 | 1.12mi |
| 7520 Cook Rd Unit 1112 Houston, TX | 1.0 | 1.0 | 657 | $940 | $1.43 | 0d | 1 | 1.12mi |
| 7520 Cook Rd Unit 7571 Houston, TX | 1.0 | 1.0 | 657 | $870 | $1.32 | 45d | 1 | 1.12mi |
| 7520 Cook Rd Unit 1047 Houston, TX | 1.0 | 1.0 | 657 | $991 | $1.51 | 13d | 1 | 1.16mi |
| 11715 S Glen Dr Houston, TX | 1.0–2.0 | 1.0–2.0 | 796 | $708 | $0.89 | 0d | 29 | 1.22mi |
| 9761 Court Glen Dr Unit 123 Houston, TX | 1.0 | 1.0 | 593 | $739 | $1.25 | 24d | 1 | 1.22mi |
| 9761 Court Glen Dr Unit 123 Houston, TX | 1.0 | 1.0 | 593 | $739 | $1.25 | 45d | 1 | 1.22mi |
| 13100 W Bellfort Ave Houston, TX | 1.0–3.0 | 1.0–2.0 | 1021 | $1,242 | $1.22 | 0d | 27 | 1.27mi |
HOA detail condo
- Monthly dues
- $238 · $2,856/yr
- Likely covers
- electricpool
- Assessments
- None detected in remarks — confirm with the listing agent.
Listing history 22 events
-
2026-06-21days on market $69,000 Active 3 DOM
-
2026-06-18remarks 699-char remark
-
2026-06-18days on market $69,000 Active 1 DOM
-
2026-06-18days on market $69,000 Active 105 DOM
-
2026-06-17days on market $69,000 Active 104 DOM
-
2026-06-16days on market $69,000 Active 103 DOM
-
2026-06-15days on market $69,000 Active 102 DOM
-
2026-06-13days on market $69,000 Active 100 DOM
-
2026-06-09days on market $69,000 Active 96 DOM
-
2026-06-08days on market $69,000 Active 95 DOM
-
2026-06-07days on market $69,000 Active 94 DOM
-
2026-06-04days on market $69,000 Active 91 DOM
-
2026-06-03days on market $69,000 Active 90 DOM
-
2026-06-02days on market $69,000 Active 89 DOM
-
2026-06-01days on market $69,000 Active 88 DOM
-
2026-05-31days on market $69,000 Active 87 DOM
-
2026-03-05historical
-
2026-03-05$69,000 Active 596-char remark
-
2025-11-24$69,000 Active
-
2025-11-24historical
-
2024-10-10$73,000 Active
-
1992-01-21soldstatus
ⓘ Source: listings_history table (triggers on properties + properties_extension) + one-shot
backfill from property_details.listing_events for pre-trigger history.
Tax reassessment forecast TX · Resets to sale price
- Current annual tax
- $1,671 · $139/mo
- Projected year-2 tax
- $1,671 · $139/mo
- Expected delta
- $0/yr ($0/mo · 0.0%)
ⓘ Screening estimate from a state-policy table — verify with the county assessor before closing.
Climate risk First Street
- Flood 7/10 Severe FEMA zone AO · 99% chance over 30 yrs
- Wildfire 1/10 Low
- Heat 9/10 Extreme 7 d/yr ≥111°F today · 24 d/yr by 30 yrs out
- Wind 9/10 Extreme 99% chance of damaging wind over 30 yrs
- Air quality 2/10 Low 2 unhealthy d/yr today · 2 by 30 yrs out
Nearby sold comps map
Loading sold comps map…
Walkable amenities ~0.75 mi
Loading nearby amenities…
Taxation est. · year 1
- Rental income
- $11,172
- − Mortgage interest
- −$3,865
- − Property taxes
- −$1,671
- − Insurance
- −$1,813
- − Repairs & maintenance
- −$894
- − Management
- −$894
- − HOA
- −$2,856
- − Depreciation
- −$2,007
- Taxable loss
- −$2,828
- Est. tax savings @ 24.0%
- +$679
- After-tax cash flow
- $-1,177/yr
For passive investors: Depreciation is non-cash, so a rental often shows a tax loss while cash-flowing — sheltering income. Rental losses are passive: they offset passive income freely, and up to $25,000/yr can offset ordinary (W-2) income if you actively participate and your MAGI is under $100k (phasing out to $0 by $150k); unused losses carry forward. On sale, claimed depreciation is recaptured at up to 25%, and gains may owe capital-gains tax (a 1031 exchange can defer both). Figures are a year-1 estimate at your 24.0% rate — not tax advice; consult a CPA.
Schools (NCES district)
- District
- Alief ISD
- NCES district ID
- 4807830
- Math proficiency
- 23% ▼ -19.00%
- Reading proficiency
- 28% ▼ -8.00%
- Median HH income
- $37,775
- Composite
- 21.29/100
- National rank
- #8391
- State rank
- #717 of 826 in TX
Livability — Houston
- Score
- 74/100
- State rank
- #184
- US rank
- #4771
Category grades
Schools grade is shown separately in the Schools card above.
Census & demographics
- Census place
- Houston, TX
- County
- Harris County · 4,702,590 people
- City population
- 3,226,434
- Metro
- Houston-The Woodlands-Sugar Land, TX
- Population (ZIP)
- 50,064
- Household income
- $49,396
- Rent vs Own
- Severe rent burden
- 3423.0
Population outlook (Harris County) Hauer SSP2
- Today (2025)
- 5,571,493 people
- By 2030
- 6,089,821 · +9.3%
- By 2040
- 7,142,806 · +28.2%
- By 2050
- 8,185,864 · +46.9%
- By 2075
- 10,574,329 · +89.8%
- By 2100
- 12,109,958 · +117.4%
Race, ethnicity, and origin ACS 2023
- Neighborhood character
- Diverse neighborhood (Simpson 0.66)
- Race & ethnicity
- Hispanic / Latino 47% Black 31% Asian 14% Two or more races 14% White 7%
- Hispanic origin (detail)
- Mexican 24%
- Foreign-born
- 46% · Canada, Vietnam, China
- Languages at home
- 41% English-only · Spanish 40% Other Indo-European 5% Vietnamese 4%
Political lean MEDSL · Harris
- 2024 margin
- Lean D (+5.5) · D 52.0% · R 46.4% · Other 1.6%
- 2008→2024 swing
- +3.9pp toward D · 2008: 1.6pp · 2024: 5.5pp
- All cycles
- 2024: D+5.5 2020: D+13.3 2016: D+12.4 2012: D+0.1 2008: D+1.6
Not yet ingested
- Civics
- —
Market trends
- HPI YoY
- ▲ 2.64%
- Current HPI
- 334.6278
- Rent YoY
- ▼ -1.69%
- Metro
- Houston-The Woodlands-Sugar Land, TX
- State GDP YoY
- ▲ 3.95%
- F500 in state
- 110
Industry mix (Fortune 500 HQ in TX)
| Industry | F500 HQs | Revenue |
|---|---|---|
| Energy | 16 | $1,198B |
|
||
| Technology | 5 | $198B |
|
||
| Engineering / Construction | 4 | $72B |
|
||
| Energy Services | 3 | $60B |
|
||
| Utilities | 3 | $41B |
|
||
| Healthcare | 2 | $330B |
|
||
Price history
-5.5% since first listed8 events — show timeline
- 2026-06-18 Listed $69,000 HARMLS
- 2026-06-18 Listing Removed — HARMLS
- 2026-03-05 Listing Removed — HARMLS
- 2026-03-05 Listed $69,000 HARMLS
- 2025-11-24 Listing Removed — HARMLS
- 2025-11-24 Listed $69,000 HARMLS
- 2024-10-10 Listed $73,000 HARMLS
- 1992-01-21 Sold (Public Records) — Public Records
Property tax history
+15.2%/yrLatest (2025): $1,671 · +2.5% YoY. Source: county tax records.
Cash-flow waterfall
monthlySold comps — $/sqft
last 12 mo · ≤1 miLoading sold comps…