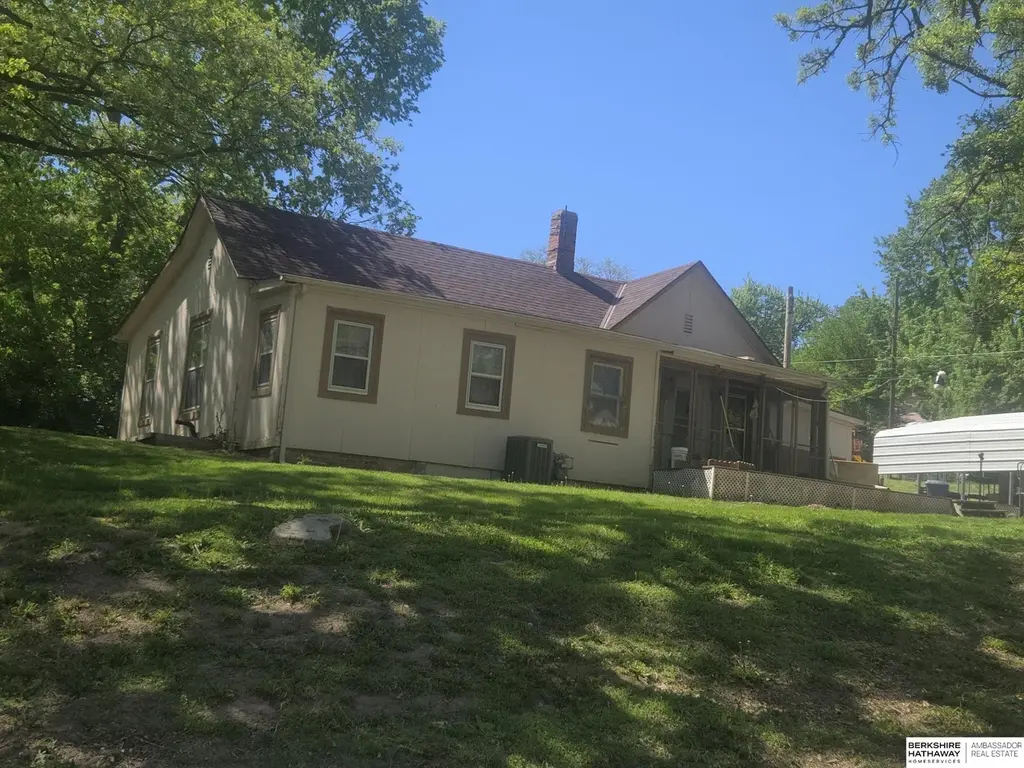
224 S 12th St · Plattsmouth, NE
Flood risk 1/10 · Minimal
- FEMA flood zone
- X (unshaded)
- Chance of flooding over 30 yrs
- 0.0%
- Est. flood insurance / yr
- $473 – $860
Fire risk 3/10 · Minor
- Est. fire insurance / yr
- $1,161 – $2,155
Heat risk 3/10 · Minor
- Hot days now (above 104°F)
- 7 days/yr
- Hot days in 30 yrs
- 15 days/yr
Wind risk 2/10 · Minimal
- Chance of severe wind over 30 yrs
- —
Air-quality risk 1/10 · Minimal
- Unhealthy air days now
- 0 days/yr
- Unhealthy air days in 30 yrs
- 0 days/yr
Risk factors via First Street. Map © Google.
Why this score? — see what drove the C- grade
The composite is a weighted blend of 9 inputs, each scored 0–100. Each bar is that input's sub-score; the figure is the points it added to the 100-point composite (weight × sub-score).
- Cash flow +15.5/30.0
- ARV discount +15.0/15.0
- DSCR +4.8/10.0
- 1% rule +4.1/10.0
- Schools +3.8/10.0
- Livability +3.8/5.0
- Rent growth +2.5/5.0
- Condition / age +2.5/5.0
- Appreciation +0.0/10.0
$129,000
🖨 Deal sheet 📄 Offer letter ✓ Due diligence
Listing remarks
Hard-to-find diamond in the rough in the heart of historic Plattsmouth! Sitting pretty on a big double lot with mature trees, this fixer upper is just waiting for the right buyer with vision, grit, and a little HGTV energy. The heavy lifting has all started, NEWER A/C and furnace, roof, H20 heater, plumbing, electrical panel, driveway, & carport. Now roll up your sleeves, focus on the fun part: making it your own. Inside you’ll find a layout w/ great bones, kitchen, pantry and main floor laundry, dining room, living room, and two good-sized bedrooms. There’s also a bonus porch space just begging to be transformed into 3rd bed, or creative flex space. Oversized lot gives you
Key facts
- Newer furnace
- Newer a c
- Newer roof
Tags
Property features AI
Finance
- Other: Living area reported as 1,280 square feet
Exterior
- Parking: Carport (covered) with space for 1 vehicle; Total of 1 parking space
- Utilities: Public water; Public sewer
- Home design: Single-family residence; Residential property; Not new / not a model; One-story entry (main-floor living areas)
- Construction: Masonite exterior; Block foundation; Originally built in 1895
- Exterior features: Front porch; Deck; Lot is over 1/4 up to 1/2 acre (approximately 0.4 acres); Lot dimensions approximately 160 x 180; Lot included in price
Interior
- Kitchen: Oven; Refrigerator
- Bedrooms: Primary bedroom on the main floor; Additional bedrooms on the main floor
- Bathrooms: One full bathroom on the main floor
- Heating & cooling: Natural gas forced-air heating; Central air conditioning
- Interior features: Unfinished basement (exists); No fireplaces
Neighborhood map
What this means for you Summary
Snapshot
- This is a 2-bed/1.0-bath single-family listed at $129k.
Deal economics
- At list price, monthly cash flow is $51 ($617/yr) — positive.
- The deal already cash-flows at list — no discount required.
- To meet the 1% rule (rent ≥ 1% of price), the offer needs to be $117k (9.0% below list).
- Recommended offer: $117k (9.0% below list) — sets the bar for 1% rule.
- Cap rate 6.8% vs local median 3.3% in Plattsmouth — top-decile yield for the area; either an underpriced asset or a hidden risk that comps aren't pricing in. Stress-test before assuming the spread holds.
Location & tenants
- Location reads 75/100 on livability (#94 in NE, #3,825 nationally) — a middle-class / working-renter tenant base. Strengths: crime A+, cost of living A+, housing A+; Watch: employment C-, amenities F, commute F.
- Plattsmouth Community Schools (town): math 40% / reading 46% proficiency, ranked #87 of 111 in NE (top 78%) — families likely to look elsewhere, expect single-tenant / working-renter base with shorter leases.
- Zoned schools: Plattsmouth Early Childhood (167 students, 73% FRL); Plattsmouth Middle School (math 38% / reading 45%, grade F, #80 of 128 statewide, top 63%, 395 students, 43% FRL); Plattsmouth High School (math 37% / reading 37%, grade F, #201 of 261 statewide, top 78%, 491 students, 36% FRL) — zoned schools average 51% FRL vs 32% district-wide (18 pts higher); higher-poverty schools than district average — tighter screening recommended.
- Market conditions: 180 active listings in the ZIP; 3 comparable units currently listed for rent nearby; rentals leasing fast (median 2d on market — plan ~1-2 weeks tenant-placement turnaround); solid renter incomes; 86 units permitted in Cass County in 2024 (30 in 5+ unit buildings).
- This rent is only 16% of the median local income ($90k/yr) — well below the 30% rent-burden line; pricing power to push rent on renewal without tenant pushback.
Forward outlook
- Local home prices are declining (-3.0%/yr); year-one equity from $892 of loan paydown is wiped out by about $4k of value loss. Plan a longer hold.
- Cass County population projected to shrink 3% by 2050 — rents likely to lag national; underwrite the cash flow, not the appreciation.
Negotiation context
- It's been on market 45 days — a 3% lower offer ($125k) is reasonable based on typical stale-listing flexibility.
Risks & watch-outs
- Watch-outs: built in 1895 — expect roof / HVAC / electrical / plumbing capex.
Questions for the listing agent
- It's been on market 45 days. Have you received any prior offers? Is the seller open to a 9% concession, seller financing, or rate buy-down credit?
- Built in 1895 — when were the roof, HVAC, electrical panel, plumbing, and water heater last replaced?
- Is there a deadline driving the sale (1031 exchange, divorce, estate, relocation)? That informs how much negotiation room exists.
- Schools are B-rated — typically a magnet for longer-tenancy family renters. What's the average tenant stay here, and is there a school-zone premium baked into asking?
- What's the average days-on-market for RENTAL listings here right now (not sales)? A rising rental-DOM trend means longer vacancies and softer asking-rent achievability than the comps imply.
- What's the recent tenant-quality profile in this submarket — average credit score on applications, eviction rate, late-payment / NSF rate, and stable-employment percentage? A property-management company in the area should have these aggregated.
- How much new for-sale + rental construction is in the pipeline within 1–3 miles? Heavy new supply typically softens prices + rents 12–24 months out; constrained supply supports both.
Investment metrics
- 1% rule
- 0.91% ✗
- Cap rate
- 6.77%
- Cash-on-cash
- 1.71%
- DSCR
- 1.08
- GRM
- 9.2
CMA / ARV
- ARV (median comp)
- $181,528
- List price
- $129,000
- Delta
- -28.94%
- Verdict
- UNDERPRICED
- Comps
- 20 within 1.0 mi
Show comp detail 12 sales within ~0.75 mi
| Address | Dist | Beds/Ba | Sqft | Sold | Price | $/sf | Match |
|---|---|---|---|---|---|---|---|
| 910 2nd Ave | 0.18mi | 2/1.0 | 1,268 (-1%) | 2mo | $125,000 | $99 | 89 |
| 1116 Avenue B | 0.29mi | 3/1.0 (+1) | 1,316 (+3%) | 2mo | $213,000 | $162 | 76 |
| 207 S 6th St | 0.41mi | 2/1.5 | 1,260 (-2%) | 2mo | $105,000 | $83 | 75 |
| 1709 2nd Ave | 0.33mi | 2/1.0 | 1,173 (-8%) | 3mo | $216,000 | $184 | 68 |
| 314 2 Ave | 0.55mi | 2/1.5 | 1,337 (+4%) | 6mo | $224,700 | $168 | 60 |
| 503 Lincoln Ave | 0.53mi | 3/1.0 (+1) | 1,369 (+7%) | 3mo | $56,000 | $41 | 56 |
| 812 Lincoln Ave | 0.58mi | 3/1.5 (+1) | 1,350 (+6%) | 3mo | $160,000 | $119 | 55 |
| 714 Avenue C | 0.46mi | 3/1.0 (+1) | 1,137 (-11%) | 4mo | $190,000 | $167 | 52 |
| 612 Avenue C | 0.51mi | 3/1.5 (+1) | 1,425 (+11%) | 4mo | $200,000 | $140 | 47 |
| 907 9th Ave | 0.58mi | 3/2.0 (+1) | 1,391 (+9%) | 3mo | $240,000 | $173 | 47 |
| 1117 9th Ave | 0.53mi | 3/2.0 (+1) | 1,412 (+10%) | 4mo | $213,500 | $151 | 46 |
| 104 E Deer Ln | 0.60mi | 2/2.0 | 1,440 (+12%) | 2mo | $230,000 | $160 | 46 |
Match score weights: distance 35% · size 25% · config 20% · recency 20%. Top-matched comps best support the ARV.
Projected returns pro-forma
-3.0% appreciation · 3.0% rent growth · sell at horizon
- IRR
- -13.6%
- Equity multiple
- 0.51×
- Total profit
- $-17,621
- Equity at exit
- $19,234
- IRR
- -4.7%
- Equity multiple
- 0.69×
- Total profit
- $-11,095
- Equity at exit
- $11,154
Cash invested: $36,120 (down + closing). Projections, not guarantees.
Landlord ↔ Tenant lean methodology
- Overall (STATE)
- 83 Strongly Landlord-Friendly
- State Nebraska
- 83 Strongly Landlord-Friendly · R+13
- County
- — inherits STATE
- City
- — inherits STATE
ZIP-level market 68048
- Home prices YoY
- -25.2%
- Active inventory
- 180
- Price-to-rent
- 9.2×
Monthly cashflow live
- Estimated rent
- $1,173 medium interval (Pro) →
- Mortgage (P&I)
- −$676
- Tax from tax record
- −$145 /mo · $1,744/yr
- Insurance
- −$54
- HOA
- −$0
- Vacancy / Maint / Mgmt
- −$246
- Net cashflow
- $51
Break-even live
UW: 25.0% down · 7.5% · 30yr · 1.5% tax · 5.0% vac · 8.0% maint · 8.0% mgmt
Financing live
Cash to close
- Down payment
- $32,250
- Closing costs
- $3,870
- Reserves months
- —
- Total cash needed
- —
Loan-product check · same deal, 3 products live
Conventional
25% down · 7.5% · 30yr
- Down + closing
- —
- Monthly P&I
- —
- Monthly cashflow
- —
- DSCR
- —
- Eligible?
- —
Personal DTI + credit; lowest rate.
DSCR
20% down · 8.5% · 30yr
- Down + closing
- —
- Monthly P&I
- —
- Monthly cashflow
- —
- DSCR
- —
- Eligible?
- —
No personal income docs; deal must DSCR.
Hard money
10% down · 12.0% · 12mo
- Down + closing
- —
- Monthly P&I
- —
- Monthly cashflow
- —
- DSCR
- —
- Eligible?
- —
Short-term bridge; refi at stabilization.
Rent comps 3 comps
| Address | Beds | Baths | Sqft | Rent | $/sqft | DOM | Units | Dist |
|---|---|---|---|---|---|---|---|---|
| 1712 4th Ave Plattsmouth, NE | 2.0 | 1.0 | 1000 | $1,077 | $1.08 | 1d | 5 | 0.35mi |
| 546 Main St Unit 3I Plattsmouth, NE | 2.0 | 1.0 | 1000 | $925 | $0.93 | 10d | 1 | 0.45mi |
| 2211 1st Ave Plattsmouth, NE | 1.0–2.0 | 1.0–2.0 | 1111 | $1,649 | $1.48 | 1d | 20 | 0.68mi |
Listing history 15 events
-
2026-06-18days on market $129,000 Active 45 DOM
-
2026-06-17days on market $129,000 Active 44 DOM
-
2026-06-16days on market $129,000 Active 43 DOM
-
2026-06-15days on market $129,000 Active 42 DOM
-
2026-06-13days on market $129,000 Active 40 DOM
-
2026-06-10days on market $129,000 Active 37 DOM
-
2026-06-09days on market $129,000 Active 36 DOM
-
2026-06-08days on market $129,000 Active 35 DOM
-
2026-06-07days on market $129,000 Active 34 DOM
-
2026-06-03days on market $129,000 Active 30 DOM
-
2026-06-03days on market $129,000 Active 29 DOM
-
2026-06-01pricedays on market $129,000 Active 28 DOM
-
2026-05-31days on market $139,000 Active 27 DOM
-
2026-05-16price $139,000 1026-char remark
-
2026-05-04$149,000 New 1026-char remark
ⓘ Source: listings_history table (triggers on properties + properties_extension) + one-shot
backfill from property_details.listing_events for pre-trigger history.
Tax reassessment forecast NE · Resets to sale price
- Current annual tax
- $1,744 · $145/mo
- Projected year-2 tax
- $2,232 · $186/mo
- Expected delta
- +$488/yr (+$41/mo · 28.0%)
ⓘ Screening estimate from a state-policy table — verify with the county assessor before closing.
Climate risk First Street
- Flood 1/10 Low FEMA zone X (unshaded) · 0% chance over 30 yrs
- Wildfire 3/10 Moderate
- Heat 3/10 Moderate 7 d/yr ≥104°F today · 15 d/yr by 30 yrs out
- Wind 2/10 Low
- Air quality 1/10 Low 0 unhealthy d/yr today · 0 by 30 yrs out
Nearby sold comps map
Loading sold comps map…
Walkable amenities ~0.75 mi
Loading nearby amenities…
Taxation est. · year 1
- Rental income
- $14,080
- − Mortgage interest
- −$7,226
- − Property taxes
- −$1,744
- − Insurance
- −$645
- − Repairs & maintenance
- −$1,126
- − Management
- −$1,126
- − Depreciation
- −$3,753
- Taxable loss
- −$1,540
- Est. tax savings @ 24.0%
- +$370
- After-tax cash flow
- $987/yr
For passive investors: Depreciation is non-cash, so a rental often shows a tax loss while cash-flowing — sheltering income. Rental losses are passive: they offset passive income freely, and up to $25,000/yr can offset ordinary (W-2) income if you actively participate and your MAGI is under $100k (phasing out to $0 by $150k); unused losses carry forward. On sale, claimed depreciation is recaptured at up to 25%, and gains may owe capital-gains tax (a 1031 exchange can defer both). Figures are a year-1 estimate at your 24.0% rate — not tax advice; consult a CPA.
Schools (NCES district)
- District
- Plattsmouth Community Schools
- NCES district ID
- 3175660
- Math proficiency
- 40% ▼ -9.00%
- Reading proficiency
- 46% ▬ 0.00%
- Median HH income
- $59,340
- Composite
- 37.86/100
- National rank
- #4326
- State rank
- #87 of 111 in NE
Livability — Plattsmouth
- Score
- 75/100
- State rank
- #94
- US rank
- #3825
Category grades
Schools grade is shown separately in the Schools card above.
Census & demographics
- Census place
- Plattsmouth, NE
- County
- Cass County · 13,435 people
- City population
- 13,435
- Metro
- Omaha-Council Bluffs, NE-IA
- Population (ZIP)
- 13,435
- Household income
- $89,931
- Rent vs Own
- Severe rent burden
- 64.0
Population outlook (Cass County) Hauer SSP2
- Today (2025)
- 26,174 people
- By 2030
- 26,293 · +0.5%
- By 2040
- 26,112 · -0.2%
- By 2050
- 25,329 · -3.2%
- By 2075
- 23,744 · -9.3%
- By 2100
- 20,901 · -20.1%
Race, ethnicity, and origin ACS 2023
- Neighborhood character
- Predominantly White (88%)
- Race & ethnicity
- White 88% Two or more races 7% Hispanic / Latino 6%
- Hispanic origin (detail)
- Mexican 4%
- Common ancestry
- Romanian 5% Slovak 2% Iranian 1%
- Foreign-born
- 1% · Canada
- Languages at home
- 98% English-only · Spanish 1% German/W. Germanic 1%
Political lean MEDSL · Cass
- 2024 margin
- Solid R (+37.2) · D 30.6% · R 67.8% · Other 1.6%
- 2008→2024 swing
- -17.7pp toward R · 2008: -19.5pp · 2024: -37.2pp
- All cycles
- 2024: R+37.2 2020: R+35.1 2016: R+39.1 2012: R+26.4 2008: R+19.5
Not yet ingested
- Civics
- —
Market trends
- HPI YoY
- ▼ -75.50%
- Current HPI
- 224.1437
- Rent YoY
- —
- Metro
- Omaha-Council Bluffs, NE-IA
- State GDP YoY
- ▲ 0.68%
- F500 in state
- 2
Industry mix (Fortune 500 HQ in NE)
| Industry | F500 HQs | Revenue |
|---|---|---|
| Conglomerate | 1 | $371B |
|
||
Price history
-13.4% since first listed3 events — show timeline
- 2026-06-01 Price Changed $129,000 GPRMLS
- 2026-05-16 Price Changed $139,000 GPRMLS
- 2026-05-04 Listed $149,000 GPRMLS
Property tax history
+1.7%/yrLatest (2025): $1,744 · +16.6% YoY. Source: county tax records.
Cash-flow waterfall
monthlySold comps — $/sqft
last 12 mo · ≤1 miLoading sold comps…