5940 Fernwood St · Shoreview, MN
Flood risk 1/10 · Minimal
- FEMA flood zone
- X (unshaded)
- Chance of flooding over 30 yrs
- 0.0%
- Est. flood insurance / yr
- $473 – $860
Fire risk 1/10 · Minimal
- Est. fire insurance / yr
- $888 – $1,650
Heat risk 2/10 · Minimal
- Hot days now (above 100°F)
- 7 days/yr
- Hot days in 30 yrs
- 14 days/yr
Wind risk 2/10 · Minimal
- Chance of severe wind over 30 yrs
- —
Air-quality risk 2/10 · Minimal
- Unhealthy air days now
- 1 days/yr
- Unhealthy air days in 30 yrs
- 1 days/yr
Risk factors via First Street. Map © Google.
Why this score? — see what drove the D grade
The composite is a weighted blend of 9 inputs, each scored 0–100. Each bar is that input's sub-score; the figure is the points it added to the 100-point composite (weight × sub-score).
- Cash flow +9.5/30.0
- ARV discount +7.5/15.0
- 1% rule +6.1/10.0
- Schools +5.4/10.0
- Livability +4.0/5.0
- Rent growth +3.4/5.0
- DSCR +2.7/10.0
- Condition / age +2.5/5.0
- Appreciation +0.0/10.0
$169,900
🖨 Deal sheet 📄 Offer letter ✓ Due diligence
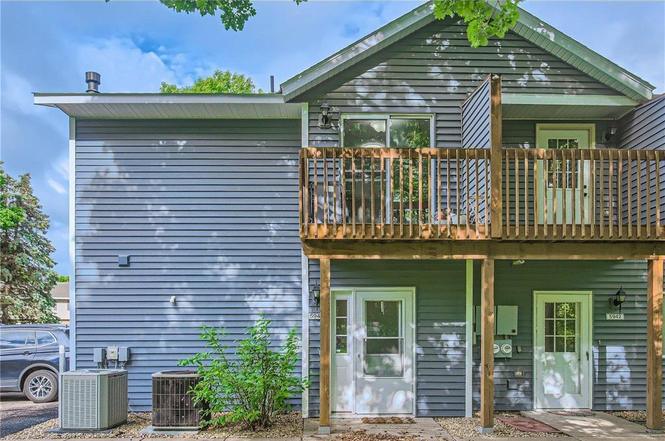
Listing remarks
Discover modern elegance in this Cherrywood Hills Penthouse. Timeless white enamel woodwork & cabinetry adorn every corner. The Granite kitchen boasts stainless steel appliances, LVT flooring, & a stunning backsplash. Master bedroom & hall feature new carpets, while waterproof-LVT flooring adds durability. Enjoy a Bluetooth kitchen light & granite bathroom. Recently replaced windows flood the spacious end unit with light, overlooking a wooded/pond area. Located in Shoreview, close to parks, trails, shopping, dining, lakes, downtown Mpls & St Paul. Includes attached private, secure garage & entry area. Award-winning 621 Mounds View School District. Associat
Key facts
- Granite bathroom
- Granite kitchen
- $385 HOA
Tags
Neighborhood map
What this means for you Summary
Snapshot
- This is a 2-bed/1.0-bath condo listed at $170k.
Deal economics
- At list price, monthly cash flow is $-117 ($-1k/yr) — negative.
- To cash-flow at today's rent, offer at most $149k (12.2% below list).
- Meets the 1% rule at list price ($2k rent vs $170k).
- Recommended offer: $149k (12.2% below list) — sets the bar for cash-flow.
- Cap rate 5.5% vs local median 3.8% in Shoreview — top-decile yield for the area; either an underpriced asset or a hidden risk that comps aren't pricing in. Stress-test before assuming the spread holds.
Location & tenants
- Location reads 79/100 on livability (#89 in MN, #2,019 nationally) — a middle-class / working-renter tenant base. Strengths: crime A+, commute A+, employment A+; Watch: cost of living C-, amenities F, health & safety F.
- Mounds View Public School District (suburban): math 58% / reading 64% proficiency, ranked #30 of 301 in MN (top 10%) — acceptable for families but not a draw, mixed tenant base, ~2y average lease.
- Market conditions: Rents rising (+3.7%/yr); 147 active listings in the ZIP; 3 comparable units currently listed for rent nearby; rentals leasing fast (median 2d on market — plan ~1-2 weeks tenant-placement turnaround); solid renter incomes; 1,202 units permitted in Ramsey County in 2024 (880 in 5+ unit buildings).
Forward outlook
- Local home prices are declining (-3.0%/yr); year-one equity from $1k of loan paydown is wiped out by about $5k of value loss. Plan a longer hold.
- Ramsey County population projected at +27% by 2050 — long-run rental-demand tailwind backs the buy-and-hold thesis.
Negotiation context
- It's been on market 159 days — a 12% lower offer ($150k) is reasonable based on typical stale-listing flexibility.
- 12 sale attempts since 24y ago; this cycle's ask has dropped $60k (26%) from the opening price — seller is motivated, your offer sets the floor, not the list.
Risks & watch-outs
- Watch-outs: HOA is 20% of rent.
Questions for the listing agent
- What do current leases actually rent for vs. the listed asking? Can we see a recent rent roll and the last 12 months of T-12 income?
- It's been on market 159 days. Have you received any prior offers? Is the seller open to a 12% concession, seller financing, or rate buy-down credit?
- What does the HOA fee cover, when was the last increase, and are there any pending special assessments or reserve-fund shortfalls?
- Any open or pending special assessments — roof, HVAC, plumbing, elevator, façade? What's the per-unit balance and payoff schedule, and is the seller paying it off at close or rolling it to the buyer?
- Why hasn't it sold? Are there any deal-killer items the seller is aware of (foundation, flood, title, zoning, code violations)?
- Is there a deadline driving the sale (1031 exchange, divorce, estate, relocation)? That informs how much negotiation room exists.
- Schools are A-rated — typically a magnet for longer-tenancy family renters. What's the average tenant stay here, and is there a school-zone premium baked into asking?
- The area grade is low — what's the realistic commute time and amenity access for the typical tenant pool here? Any planned neighborhood developments (good or bad) we should know about?
- What's the average days-on-market for RENTAL listings here right now (not sales)? A rising rental-DOM trend means longer vacancies and softer asking-rent achievability than the comps imply.
- What's the recent tenant-quality profile in this submarket — average credit score on applications, eviction rate, late-payment / NSF rate, and stable-employment percentage? A property-management company in the area should have these aggregated.
- How much new apartment / multifamily construction is in the pipeline within 1–3 miles? Heavy new supply (>2% of stock underway) typically softens rents 12–24 months out; light construction supports rent growth.
Investment metrics
- 1% rule
- 1.11% ✓
- Cap rate
- 5.47%
- Cash-on-cash
- -2.96%
- DSCR
- 0.87
- GRM
- 7.5
CMA / ARV
No comps found within radius.
Projected returns pro-forma
-3.0% appreciation · 3.67% rent growth · sell at horizon
- IRR
- -20.0%
- Equity multiple
- 0.30×
- Total profit
- $-33,429
- Equity at exit
- $25,333
- IRR
- -10.7%
- Equity multiple
- 0.32×
- Total profit
- $-32,236
- Equity at exit
- $14,690
Cash invested: $47,572 (down + closing). Projections, not guarantees.
Landlord ↔ Tenant lean methodology
- Overall (STATE)
- 46 Balanced
- State Minnesota
- 46 Balanced · D+2
- County
- — inherits STATE
- City
- — inherits STATE
ZIP-level market 55126
- Rents YoY
- 3.7%
- Active inventory
- 147
- Price-to-rent
- 7.5×
Monthly cashflow live
- Estimated rent
- $1,879 medium interval (Pro) →
- Mortgage (P&I)
- −$891
- Tax from tax record
- −$255 /mo · $3,056/yr
- Insurance
- −$71
- HOA
- −$385
- Vacancy / Maint / Mgmt
- −$395
- Net cashflow
- $-117
Break-even live
UW: 25.0% down · 7.5% · 30yr · 1.5% tax · 5.0% vac · 8.0% maint · 8.0% mgmt
Financing live
Cash to close
- Down payment
- $42,475
- Closing costs
- $5,097
- Reserves months
- —
- Total cash needed
- —
Loan-product check · same deal, 3 products live
Conventional
25% down · 7.5% · 30yr
- Down + closing
- —
- Monthly P&I
- —
- Monthly cashflow
- —
- DSCR
- —
- Eligible?
- —
Personal DTI + credit; lowest rate.
DSCR
20% down · 8.5% · 30yr
- Down + closing
- —
- Monthly P&I
- —
- Monthly cashflow
- —
- DSCR
- —
- Eligible?
- —
No personal income docs; deal must DSCR.
Hard money
10% down · 12.0% · 12mo
- Down + closing
- —
- Monthly P&I
- —
- Monthly cashflow
- —
- DSCR
- —
- Eligible?
- —
Short-term bridge; refi at stabilization.
Rent comps 3 comps
| Address | Beds | Baths | Sqft | Rent | $/sqft | DOM | Units | Dist |
|---|---|---|---|---|---|---|---|---|
| 1556 Hillview Rd Saint Paul, MN | 2.0 | 1.0 | 1000 | $1,800 | $1.80 | 43d | 1 | 1.13mi |
| 9001 Griggs Ave Circle Pines, MN | 2.0 | 1.0–2.0 | 761 | $2,520 | $3.31 | 1d | 22 | 1.33mi |
| 6333 Hodgson Rd Circle Pines, MN | 2.0 | 1.0 | 784 | $1,450 | $1.85 | 1d | 1 | 1.43mi |
HOA detail condo
- Monthly dues
- $385 · $4,620/yr
- Likely covers
- water
- Assessments
- None detected in remarks — confirm with the listing agent.
Listing history 44 events
-
2026-04-24status Pending
-
2026-04-17historical Contingent - Other
-
2026-03-05price $169,900
-
2026-02-21price $174,900
-
2026-02-13price $179,900
-
2026-02-06price $182,500
-
2026-01-21price $189,900
-
2026-01-03price $199,900
-
2025-12-07price $210,000
-
2025-12-02price $220,000
-
2025-11-16$230,000 Active
-
2025-05-01historical
-
2025-02-13price $219,900
-
2024-11-22historical $2,300
-
2024-11-22$226,000 Active
-
2024-11-04$2,300
-
2024-11-04historical
-
2024-10-17$226,000 Active
-
2024-10-16historical
-
2024-08-23$227,500 Active
-
2024-08-23historical
-
2024-08-06$229,900 Active
-
2024-06-29status Pending
-
2024-06-28historical
-
2024-06-03$229,900 Active
-
2024-05-31historical
-
2022-08-10soldstatus $222,000
-
2022-08-03soldstatus $220,000 Sold
-
2022-07-07historical Contingent - Inspection
-
2022-07-05status Active
-
2022-07-02historical Contingent - Inspection
-
2022-06-24$215,000 Active
-
2008-04-25soldstatus $140,425
-
2007-09-07soldstatus $140,425
-
2007-09-07soldstatus $140,425
-
2007-08-23historical
-
2007-06-27$147,500
-
2007-06-27historical
-
2007-01-16$147,500
-
2003-03-26soldstatus $129,000
-
2002-12-18historical
-
2002-12-18$129,000
-
2000-07-18soldstatus $98,500
-
1990-09-14soldstatus $60,000
ⓘ Source: listings_history table (triggers on properties + properties_extension) + one-shot
backfill from property_details.listing_events for pre-trigger history.
Tax reassessment forecast MN · Partial reset (capped growth)
- Current annual tax
- $3,056 · $255/mo
- Projected year-2 tax
- $3,056 · $255/mo
- Expected delta
- $0/yr ($0/mo · 0.0%)
ⓘ Screening estimate from a state-policy table — verify with the county assessor before closing.
Climate risk First Street
- Flood 1/10 Low FEMA zone X (unshaded) · 0% chance over 30 yrs
- Wildfire 1/10 Low
- Heat 2/10 Low 7 d/yr ≥100°F today · 14 d/yr by 30 yrs out
- Wind 2/10 Low
- Air quality 2/10 Low 1 unhealthy d/yr today · 1 by 30 yrs out
Nearby sold comps map
Loading sold comps map…
Walkable amenities ~0.75 mi
Loading nearby amenities…
Taxation est. · year 1
- Rental income
- $22,545
- − Mortgage interest
- −$9,517
- − Property taxes
- −$3,056
- − Insurance
- −$850
- − Repairs & maintenance
- −$1,804
- − Management
- −$1,804
- − HOA
- −$4,620
- − Depreciation
- −$4,943
- Taxable loss
- −$4,047
- Est. tax savings @ 24.0%
- +$971
- After-tax cash flow
- $-435/yr
For passive investors: Depreciation is non-cash, so a rental often shows a tax loss while cash-flowing — sheltering income. Rental losses are passive: they offset passive income freely, and up to $25,000/yr can offset ordinary (W-2) income if you actively participate and your MAGI is under $100k (phasing out to $0 by $150k); unused losses carry forward. On sale, claimed depreciation is recaptured at up to 25%, and gains may owe capital-gains tax (a 1031 exchange can defer both). Figures are a year-1 estimate at your 24.0% rate — not tax advice; consult a CPA.
Schools (NCES district)
- District
- Mounds View Public School District
- NCES district ID
- 2722950
- Math proficiency
- 58% ▼ -9.00%
- Reading proficiency
- 64% ▼ -3.00%
- Median HH income
- $72,492
- Composite
- 54.04/100
- National rank
- #1390
- State rank
- #30 of 301 in MN
Livability — Shoreview
- Score
- 79/100
- State rank
- #89
- US rank
- #2019
Category grades
Schools grade is shown separately in the Schools card above.
Census & demographics
- Census place
- Shoreview, MN
- County
- Ramsey County · 542,837 people
- City population
- 27,456
- Metro
- Minneapolis-St. Paul-Bloomington, MN-WI
- Population (ZIP)
- 27,456
- Household income
- $108,217
- Rent vs Own
- Severe rent burden
- 468.0
Population outlook (Ramsey County) Hauer SSP2
- Today (2025)
- 603,431 people
- By 2030
- 636,459 · +5.5%
- By 2040
- 700,596 · +16.1%
- By 2050
- 765,819 · +26.9%
- By 2075
- 929,297 · +54.0%
- By 2100
- 1,053,924 · +74.7%
Race, ethnicity, and origin ACS 2023
- Neighborhood character
- Predominantly White (76%)
- Race & ethnicity
- White 76% Asian 10% Two or more races 7% Hispanic / Latino 5% Black 4%
- Common ancestry
- Portuguese 11% Lithuanian 3% Romanian 3%
- Foreign-born
- 10% · China, Canada, South Korea
- Languages at home
- 88% English-only · Other Indo-European 3% Chinese 3% Spanish 2%
Political lean MEDSL · Ramsey
- 2024 margin
- Solid D (+43.3) · D 70.5% · R 27.2% · Other 2.3%
- 2008→2024 swing
- +9.4pp toward D · 2008: 33.9pp · 2024: 43.3pp
- All cycles
- 2024: D+43.3 2020: D+45.4 2016: D+39.4 2012: D+35.3 2008: D+33.9
Not yet ingested
- Civics
- —
Market trends
- HPI YoY
- ▼ -268.72%
- Current HPI
- 245.484
- Rent YoY
- ▲ 3.67%
- Metro
- Minneapolis-St. Paul-Bloomington, MN-WI
- State GDP YoY
- ▲ 2.41%
- F500 in state
- 34
Industry mix (Fortune 500 HQ in MN)
| Industry | F500 HQs | Revenue |
|---|---|---|
| Healthcare | 2 | $407B |
|
||
| Retail | 2 | $150B |
|
||
| Consumer Goods | 2 | $32B |
|
||
| Industrial Machinery | 2 | $6B |
|
||
| Agriculture | 1 | $40B |
|
||
| Healthcare / Medical Devices | 1 | $32B |
|
||
Price history
+183.2% since first listed44 events — show timeline
- 2026-04-24 Pending — NORTHSTARMLS as Distributed by MLS Grid
- 2026-04-17 Contingent — NORTHSTARMLS as Distributed by MLS Grid
- 2026-03-05 Price Changed $169,900 NORTHSTARMLS as Distributed by MLS Grid
- 2026-02-21 Price Changed $174,900 NORTHSTARMLS as Distributed by MLS Grid
- 2026-02-13 Price Changed $179,900 NORTHSTARMLS as Distributed by MLS Grid
- 2026-02-06 Price Changed $182,500 NORTHSTARMLS as Distributed by MLS Grid
- 2026-01-21 Price Changed $189,900 NORTHSTARMLS as Distributed by MLS Grid
- 2026-01-03 Price Changed $199,900 NORTHSTARMLS as Distributed by MLS Grid
- 2025-12-07 Price Changed $210,000 NORTHSTARMLS as Distributed by MLS Grid
- 2025-12-02 Price Changed $220,000 NORTHSTARMLS as Distributed by MLS Grid
- 2025-11-16 Listed $230,000 NORTHSTARMLS as Distributed by MLS Grid
- 2025-05-01 Listing Removed — NORTHSTARMLS as Distributed by MLS Grid
- 2025-02-13 Price Changed $219,900 NORTHSTARMLS as Distributed by MLS Grid
- 2024-11-22 Rental Removed $2,300 NORTHSTARMLS
- 2024-11-22 Listed $226,000 NORTHSTARMLS as Distributed by MLS Grid
- 2024-11-04 Listed for Rent $2,300 NORTHSTARMLS
- 2024-11-04 Listing Removed — NORTHSTARMLS as Distributed by MLS Grid
- 2024-10-17 Listed $226,000 NORTHSTARMLS as Distributed by MLS Grid
- 2024-10-16 Listing Removed — NORTHSTARMLS as Distributed by MLS Grid
- 2024-08-23 Listing Removed — NORTHSTARMLS as Distributed by MLS Grid
- 2024-08-23 Listed $227,500 NORTHSTARMLS as Distributed by MLS Grid
- 2024-08-06 Listed $229,900 NORTHSTARMLS as Distributed by MLS Grid
- 2024-06-29 Pending — NORTHSTARMLS as Distributed by MLS Grid
- 2024-06-28 Listing Removed — NORTHSTARMLS as Distributed by MLS Grid
- 2024-06-03 Listed $229,900 NORTHSTARMLS as Distributed by MLS Grid
- 2024-05-31 Coming Soon — NORTHSTARMLS as Distributed by MLS Grid
- 2022-08-10 Sold (Public Records) $222,000 Public Records
- 2022-08-03 Sold (MLS) $220,000 NORTHSTARMLS as Distributed by MLS Grid
- 2022-07-07 Contingent — NORTHSTARMLS as Distributed by MLS Grid
- 2022-07-05 Relisted — NORTHSTARMLS as Distributed by MLS Grid
- 2022-07-02 Contingent — NORTHSTARMLS as Distributed by MLS Grid
- 2022-06-24 Listed $215,000 NORTHSTARMLS as Distributed by MLS Grid
- 2008-04-25 Sold (Public Records) $140,425 Public Records
- 2007-09-07 Sold (Public Records) $140,425 Public Records
- 2007-09-07 Sold (MLS) $140,425 NORTHSTARMLS as Distributed by MLS Grid
- 2007-08-23 Listing Removed — NORTHSTARMLS as Distributed by MLS Grid
- 2007-06-27 Listing Removed — NORTHSTARMLS as Distributed by MLS Grid
- 2007-06-27 Listed $147,500 NORTHSTARMLS as Distributed by MLS Grid
- 2007-01-16 Listed $147,500 NORTHSTARMLS as Distributed by MLS Grid
- 2003-03-26 Sold (Public Records) $129,000 Public Records
- 2002-12-18 Listed $129,000 NORTHSTARMLS as Distributed by MLS Grid
- 2002-12-18 Listing Removed — NORTHSTARMLS as Distributed by MLS Grid
- 2000-07-18 Sold (Public Records) $98,500 Public Records
- 1990-09-14 Sold (Public Records) $60,000 Public Records
Property tax history
+8.0%/yrLatest (2025): $3,056 · +5.0% YoY. Source: county tax records.
Cash-flow waterfall
monthlySold comps — $/sqft
last 12 mo · ≤1 miLoading sold comps…