 Multi-family
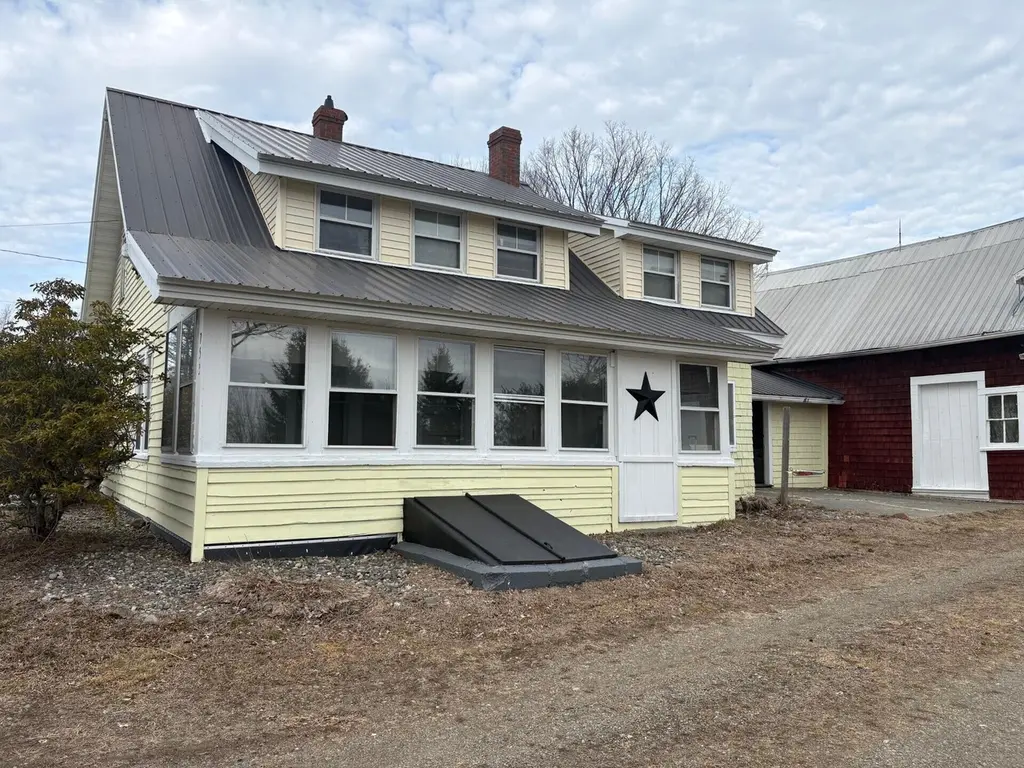
753 Ridge Rd · Windsor, ME
Flood risk No data
- FEMA flood zone
- —
- Chance of flooding over 30 yrs
- —
- Est. flood insurance / yr
- —
Fire risk No data
- Est. fire insurance / yr
- —
Heat risk No data
- Hot days now (above threshold)
- —
- Hot days in 30 yrs
- —
Wind risk No data
- Chance of severe wind over 30 yrs
- —
Air-quality risk No data
- Unhealthy air days now
- —
- Unhealthy air days in 30 yrs
- —
Risk factors via First Street. Map © Google.
Why this score? — see what drove the D grade
The composite is a weighted blend of 9 inputs, each scored 0–100. Each bar is that input's sub-score; the figure is the points it added to the 100-point composite (weight × sub-score).
- Appreciation +10.0/10.0
- Cash flow +7.7/30.0
- ARV discount +7.5/15.0
- Schools +7.3/10.0
- Rent growth +2.5/5.0
- Livability +2.5/5.0
- Condition / age +2.5/5.0
- DSCR +1.8/10.0
- 1% rule +1.6/10.0
$375,000
🖨 Deal sheet (PDF) 📄 Offer letter ✓ Due diligence
Multi-family units
County records classify this as Multi-Family (2-4 Unit). Listing-text estimate: 1 unit. estimate disagrees with records
Listing remarks
Offered for the first time in generations, this classic 3-bedroom, 1.5-bath cape/farmhouse sits on 17 beautiful acres of versatile land. Full of potential and a perfect opportunity to homestead, this property blends rustic charm with modern convenience. Step inside to find original wood floors full of character, a bright three season, glassed in porch and plenty of storage, complimented by a new forced hot air furnace, installed in 2024, and a cozy woodstove to keep you warm through the seasons. The home includes an attached two-bay garage with capacity for up to 5 vehicles, equipment, recreational gear or ATVs. A zero-turn mower and 15,000-watt generator will also convey. Outside, this pro
Key facts
- 17 acres
- Three season porch
- Large covered deck
Tags
Property features AI
Finance
- HOA & community: No pet restrictions
Exterior
- Parking: Attached garage with direct entry to living area; Garage fits 4 cars; Paved parking (1–4 spaces), inside entrance
- Utilities: Well (private water); Septic tank (private sewer); Electric water heater; Generator hookup and circuit breakers
- Home design: Single family residence; Multi-level; Built in 1897
- Construction: Wood siding with wood frame construction; Concrete perimeter foundation; Metal roof
- Exterior features: Deck; Glass-enclosed porch; Fenced yard; Outbuilding(s), shed(s), and barn(s); Rolling/sloping, open, pasture/field, level, wooded and rural lot
Interior
- Kitchen: Electric range; Refrigerator; Dishwasher
- Bedrooms: Bedroom 1 (Second level); Bedroom 2 (Second level); Bedroom 3 (Second level)
- Flooring: Wood; Vinyl; Tile
- Bathrooms: 1 full bathroom; 1 half bathroom
- Heating & cooling: Wood stove; Forced air
- Interior features: Bathtub and shower; Storage; Generator; Negotiable furnished status; 7 total rooms
- Laundry & utility: Washer; Dryer
Neighborhood map
What this means for you Summary
Snapshot
- This is a 3-bed/1.5-bath multifamily listed at $375k.
Deal economics
- At list price, monthly cash flow is $-435 ($-5k/yr) — negative.
- To cash-flow at today's rent, offer at most $298k (20.5% below list).
- To meet the 1% rule (rent ≥ 1% of price), the offer needs to be $248k (33.8% below list).
- Recommended offer: $248k (33.8% below list) — sets the bar for 1% rule.
Location & tenants
- Location reads: area grade D — affects rentability + tenant quality, not the cash-flow math above.
- RSU 12 (rural): math 86% / reading 86% proficiency, ranked #50 of 112 in ME (top 45%) — strong family-tenant draw, lease renewals of 3-5y typical.
- Zoned schools: Windsor Elementary School (math 87% / reading 87%, grade A+, #77 of 294 statewide, top 33%, 287 students, 55% FRL) — zoned schools average 55% FRL vs 40% district-wide (15 pts higher); higher-poverty schools than district average — tighter screening recommended.
- Market conditions: 28 active listings in the ZIP; 460 units permitted in Kennebec County in 2024 (0 in 5+ unit buildings).
Forward outlook
- In year one you build about $40k of equity ($3k loan paydown + $38k appreciation (10.0% local appreciation)).
- Kennebec County population projected at -17% by 2050 — secular population decline; favor cash flow + early exit over multi-decade hold.
- By year 2, paydown + projected appreciation supports a ~$64k cash-out refi (75% LTV) — recoverable capital for the next deal without selling this one.
Negotiation context
- It's been on market 79 days — a 6% lower offer ($352k) is reasonable based on typical stale-listing flexibility.
Risks & watch-outs
- Watch-outs: built in 1897 — expect roof / HVAC / electrical / plumbing capex.
Questions for the listing agent
- What do current leases actually rent for vs. the listed asking? Can we see a recent rent roll and the last 12 months of T-12 income?
- It's been on market 79 days. Have you received any prior offers? Is the seller open to a 34% concession, seller financing, or rate buy-down credit?
- Built in 1897 — when were the roof, HVAC, electrical panel, plumbing, and water heater last replaced?
- Why hasn't it sold? Are there any deal-killer items the seller is aware of (foundation, flood, title, zoning, code violations)?
- Is there a deadline driving the sale (1031 exchange, divorce, estate, relocation)? That informs how much negotiation room exists.
- The area grade is low — what's the realistic commute time and amenity access for the typical tenant pool here? Any planned neighborhood developments (good or bad) we should know about?
- What's the average days-on-market for RENTAL listings here right now (not sales)? A rising rental-DOM trend means longer vacancies and softer asking-rent achievability than the comps imply.
- What's the recent tenant-quality profile in this submarket — average credit score on applications, eviction rate, late-payment / NSF rate, and stable-employment percentage? A property-management company in the area should have these aggregated.
- How much new apartment / multifamily construction is in the pipeline within 1–3 miles? Heavy new supply (>2% of stock underway) typically softens rents 12–24 months out; light construction supports rent growth.
Investment metrics
- 1% rule
- 0.66% ✗
- Cap rate
- 4.90%
- Cash-on-cash
- -4.98%
- DSCR
- 0.78
- GRM
- 12.6
CMA / ARV
No comps found within radius.
Projected returns pro-forma
10.0% appreciation · 3.0% rent growth · sell at horizon
- IRR
- 20.7%
- Equity multiple
- 2.68×
- Total profit
- $176,417
- Equity at exit
- $337,830
- IRR
- 18.8%
- Equity multiple
- 6.15×
- Total profit
- $541,164
- Equity at exit
- $728,543
Cash invested: $105,000 (down + closing). Projections, not guarantees.
Landlord ↔ Tenant lean methodology
- Overall (STATE)
- 41 Moderately Tenant-Leaning
- State Maine
- 41 Moderately Tenant-Leaning · D+2
- County
- — inherits STATE
- City
- — inherits STATE
ZIP-level market 04363
- Home prices YoY
- 4.3%
- Active inventory
- 28
- Price-to-rent
- 25.2×
Monthly cashflow live
- Estimated rent
- $2,481 medium interval (Pro) →
- Mortgage (P&I)
- −$1,967
- Tax from tax record
- −$273 /mo · $3,272/yr
- Insurance
- −$156
- HOA
- −$0
- Vacancy / Maint / Mgmt
- −$521
- Net cashflow
- $-435
Break-even live
Sensitivity live
| Price | -10% $-223 | -5% $-329 | +0% $-435 | +5% $-542 | +10% $-648 |
|---|---|---|---|---|---|
| Rent | -10% $-631 | -5% $-533 | +0% $-435 | +5% $-337 | +10% $-239 |
| Rate | -1.0pp $-247 | -0.5pp $-340 | base $-435 | +0.5pp $-533 | +1.0pp $-631 |
2-unit breakdown (identical units grouped — click to expand)
| Units | Beds | Baths | Est. rent |
|---|---|---|---|
| 2× units | 3 | 1.5 | $2,482 |
| #1 | 3 | 1.5 | $1,241 |
| #2 | 3 | 1.5 | $1,241 |
| Total (2 units) | $2,481 | ||
UW: 25.0% down · 7.5% · 30yr · 1.5% tax · 5.0% vac · 8.0% maint · 8.0% mgmt
Financing live
Cash to close
- Down payment
- $93,750
- Closing costs
- $11,250
- Reserves months
- —
- Total cash needed
- —
Loan-product check · same deal, 3 products live
Conventional
25% down · 7.5% · 30yr
- Down + closing
- —
- Monthly P&I
- —
- Monthly cashflow
- —
- DSCR
- —
- Eligible?
- —
Personal DTI + credit; lowest rate.
DSCR
20% down · 8.5% · 30yr
- Down + closing
- —
- Monthly P&I
- —
- Monthly cashflow
- —
- DSCR
- —
- Eligible?
- —
No personal income docs; deal must DSCR.
Hard money
10% down · 12.0% · 12mo
- Down + closing
- —
- Monthly P&I
- —
- Monthly cashflow
- —
- DSCR
- —
- Eligible?
- —
Short-term bridge; refi at stabilization.
Listing history 21 events
-
2026-06-21days on market $375,000 Active 79 DOM
-
2026-06-19days on market $375,000 Active 77 DOM
-
2026-06-18days on market $375,000 Active 76 DOM
-
2026-06-17price $375,000 Active 75 DOM
-
2026-06-17days on market $385,000 Active 75 DOM
-
2026-06-16days on market $385,000 Active 74 DOM
-
2026-06-15days on market $385,000 Active 73 DOM
-
2026-06-14days on market $385,000 Active 71 DOM
-
2026-06-12days on market $385,000 Active 70 DOM
-
2026-06-09days on market $385,000 Active 67 DOM
-
2026-06-08days on market $385,000 Active 66 DOM
-
2026-06-07days on market $385,000 Active 65 DOM
-
2026-06-05days on market $385,000 Active 62 DOM
-
2026-06-02days on market $385,000 Active 60 DOM
-
2026-06-01days on market $385,000 Active 59 DOM
-
2026-05-31days on market $385,000 Active 58 DOM
-
2026-05-30days on market $385,000 Active 57 DOM
-
2026-04-10historical Active Under Contract
-
2026-04-03$396,000 Active
-
2025-09-02price $375,000
-
2025-06-17price $400,000
ⓘ Source: listings_history table (triggers on properties + properties_extension) + one-shot
backfill from property_details.listing_events for pre-trigger history.
Tax reassessment forecast ME · Partial reset (capped growth)
- Current annual tax
- $3,272 · $273/mo
- Projected year-2 tax
- $4,186 · $349/mo
- Expected delta
- +$914/yr (+$76/mo · 27.9%)
ⓘ Screening estimate from a state-policy table — verify with the county assessor before closing.
Nearby sold comps map
Loading sold comps map…
Walkable amenities ~0.75 mi
Loading nearby amenities…
Taxation est. · year 1
- Rental income
- $29,772
- − Mortgage interest
- −$21,006
- − Property taxes
- −$3,272
- − Insurance
- −$1,875
- − Repairs & maintenance
- −$2,382
- − Management
- −$2,382
- − Depreciation
- −$10,909
- Taxable loss
- −$12,053
- Est. tax savings @ 24.0%
- +$2,893
- After-tax cash flow
- $-2,333/yr
For passive investors: Depreciation is non-cash, so a rental often shows a tax loss while cash-flowing — sheltering income. Rental losses are passive: they offset passive income freely, and up to $25,000/yr can offset ordinary (W-2) income if you actively participate and your MAGI is under $100k (phasing out to $0 by $150k); unused losses carry forward. On sale, claimed depreciation is recaptured at up to 25%, and gains may owe capital-gains tax (a 1031 exchange can defer both). Figures are a year-1 estimate at your 24.0% rate — not tax advice; consult a CPA.
Schools (NCES district)
- District
- RSU 12
- NCES district ID
- 2314780
- Math proficiency
- 86% ▲ 58.00%
- Reading proficiency
- 86% ▲ 35.00%
- Median HH income
- $49,792
- Composite
- 72.62/100
- National rank
- #197
- State rank
- #50 of 112 in ME
Livability — Windsor
No livability data for this city. (Only ~50 U.S. cities are tracked.)
Census & demographics
- Population (ZIP)
- 2,666
Population outlook (Kennebec County) Hauer SSP2
- Today (2025)
- 115,421 people
- By 2030
- 111,852 · -3.1%
- By 2040
- 103,757 · -10.1%
- By 2050
- 95,710 · -17.1%
- By 2075
- 78,172 · -32.3%
- By 2100
- 59,500 · -48.4%
Race, ethnicity, and origin ACS 2023
- Neighborhood character
- Predominantly White (96%)
- Race & ethnicity
- White 96% Two or more races 3% Hispanic / Latino 1%
- Common ancestry
- Lithuanian 12% Italian 4% Slovak 1%
- Foreign-born
- 1% · Canada
- Languages at home
- 99% English-only · Spanish 1%
Political lean MEDSL · Kennebec
- 2024 margin
- Toss-up / Even · D 47.5% · R 50.2% · Other 2.4%
- 2008→2024 swing
- -17.5pp toward R · 2008: 14.8pp · 2024: -2.8pp
- All cycles
- 2024: R+2.8 2020: D+0.2 2016: R+3.7 2012: D+13.5 2008: D+14.8
Not yet ingested
- Civics
- —
Market trends
- HPI YoY
- ▲ 10.50%
- Current HPI
- 254.0093
- Rent YoY
- —
- Metro
- —
- State GDP YoY
- —
- F500 in state
- 0
Price history
-1.0% since first listed4 events — show timeline
- 2026-04-10 Contingent — MREIS
- 2026-04-03 Listed $396,000 MREIS
- 2025-09-02 Price Changed $375,000 MREIS
- 2025-06-17 Price Changed $400,000 MREIS
Property tax history
+3.5%/yrLatest (2025): $3,272 · +2.2% YoY. Source: county tax records.
Cash-flow waterfall
monthlySold comps — $/sqft
last 12 mo · ≤1 miLoading sold comps…