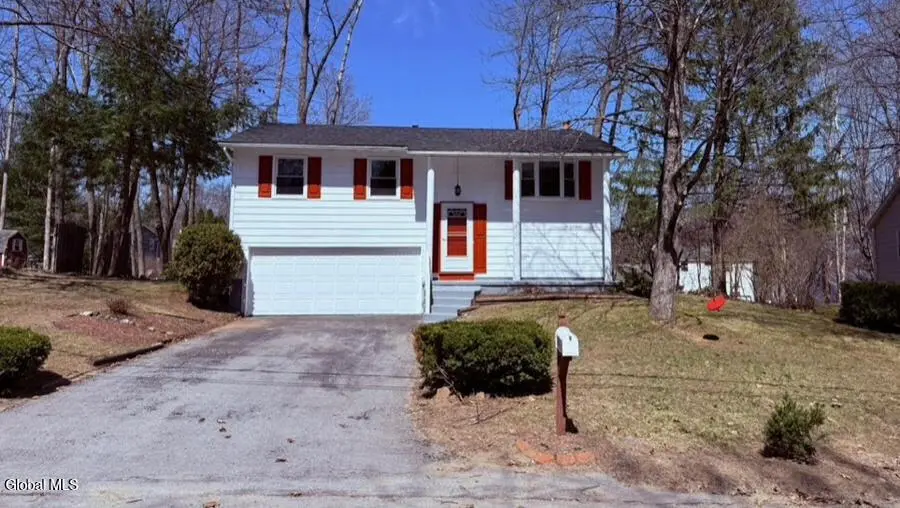
8 Orenda Spring Dr · Saratoga Springs, NY
Flood risk 1/10 · Minimal
- FEMA flood zone
- X
- Chance of flooding over 30 yrs
- 0.0%
- Est. flood insurance / yr
- $473 – $860
Fire risk 3/10 · Minor
- Est. fire insurance / yr
- $691 – $1,283
Heat risk 3/10 · Minor
- Hot days now (above 97°F)
- 7 days/yr
- Hot days in 30 yrs
- 16 days/yr
Wind risk 2/10 · Minimal
- Chance of severe wind over 30 yrs
- 4.0%
Air-quality risk 2/10 · Minimal
- Unhealthy air days now
- 0 days/yr
- Unhealthy air days in 30 yrs
- 1 days/yr
Risk factors via First Street. Map © Google.
Why this score? — see what drove the D+ grade
The composite is a weighted blend of 9 inputs, each scored 0–100. Each bar is that input's sub-score; the figure is the points it added to the 100-point composite (weight × sub-score).
- ARV discount +13.1/15.0
- Cash flow +12.0/30.0
- Schools +6.1/10.0
- Rent growth +4.8/5.0
- Livability +4.1/5.0
- DSCR +3.5/10.0
- 1% rule +3.4/10.0
- Condition / age +2.5/5.0
- Appreciation +0.0/10.0
$324,900
🖨 Deal sheet (PDF) 📄 Offer letter ✓ Due diligence
Listing remarks MLS
House beautiful. You will fall in love with this 3 Br/1 Bath 2 car garage.Newer kitchen, new furnace,newly remodeled family room with woodstove. A must see. Excellent Condition
Key facts
- 0.27 acre lot
- 4 garage spots
- Built 1972
Property features AI
Exterior
- Parking: Attached garage with space for 4 vehicles (4 total parking spaces)
- Utilities: Public water; Public sewer
- Home design: Single family residence; Living area reported as 1,368
- Construction: Vinyl siding
- Exterior features: Paved driveway
Interior
- Kitchen: Includes dishwasher, range/oven, and refrigerator
- Bedrooms: Multiple bedrooms located on the second floor
- Bathrooms: One full bathroom on the second floor
- Heating & cooling: Forced air heating; Central air conditioning
- Interior features: Nine total rooms; Dishwasher; Dryer; Oven; Range; Refrigerator; Washer
- Laundry & utility: First-floor laundry with washer and dryer
Neighborhood map
What this means for you Summary
Snapshot
- This is a 3-bed/1.0-bath single-family listed at $325k.
Deal economics
- At list price, monthly cash flow is $-78 ($-934/yr) — negative.
- To cash-flow at today's rent, offer at most $311k (4.2% below list).
- To meet the 1% rule (rent ≥ 1% of price), the offer needs to be $273k (16.0% below list).
- Recommended offer: $273k (16.0% below list) — sets the bar for 1% rule.
- Cap rate 6.0% vs local median 2.0% in Saratoga Springs — top-decile yield for the area; either an underpriced asset or a hidden risk that comps aren't pricing in. Stress-test before assuming the spread holds.
Location & tenants
- Location reads 82/100 on livability (#83 in NY, #1,284 nationally) — a professional / high-income tenant draw. Strengths: employment A+, housing A+, health & safety A; Watch: amenities D+, cost of living F.
- Saratoga Springs City SD (suburban): math 67% / reading 72% proficiency, ranked #138 of 590 in NY (top 23%) — acceptable for families but not a draw, mixed tenant base, ~2y average lease; only 15% free/reduced lunch — higher-income household profile.
- Zoned schools: Geyser Road Elementary School (math 67% / reading 67%, grade B+, #525 of 2,108 statewide, top 27%, 348 students, 34% FRL); Maple Avenue Middle School (math 46% / reading 69%, grade B, #187 of 729 statewide, top 26%, 1,392 students, 27% FRL); Saratoga Springs High School (math 98% / reading 92%, grade A+, #83 of 1,100 statewide, top 8%, 1,947 students, 26% FRL).
- Market conditions: Rents rising fast (+9.2%/yr); 474 active listings in the ZIP; 2 comparable units currently listed for rent nearby; solid renter incomes; 1,132 units permitted in Saratoga County in 2024 (378 in 5+ unit buildings).
- This rent runs 32% of the median local income ($102k/yr) — at the standard rent-burdened threshold; future hikes will face affordability resistance.
Forward outlook
- Local home prices are declining (-3.0%/yr); year-one equity from $2k of loan paydown is wiped out by about $10k of value loss. Plan a longer hold.
- Saratoga County population projected at +4% by 2050 — modest demand growth; plan on rents tracking national, not racing it.
Negotiation context
- Only 4 days on market — expect competitive offers; lowballing is unlikely to land.
- 3 sale attempts since 26y ago with the ask held roughly flat each time — persistent listings suggest the price (not the market) is what's stuck; bring a comps-based counter.
- Current owner paid $185k; list at $325k implies a 76% gain — meaningful room to come down on a strong offer.
Questions for the listing agent
- What do current leases actually rent for vs. the listed asking? Can we see a recent rent roll and the last 12 months of T-12 income?
- Built in 1972 — when were the roof, HVAC, electrical panel, plumbing, and water heater last replaced?
- Is there a deadline driving the sale (1031 exchange, divorce, estate, relocation)? That informs how much negotiation room exists.
- Schools are A-rated — typically a magnet for longer-tenancy family renters. What's the average tenant stay here, and is there a school-zone premium baked into asking?
- The area grade is low — what's the realistic commute time and amenity access for the typical tenant pool here? Any planned neighborhood developments (good or bad) we should know about?
- What's the average days-on-market for RENTAL listings here right now (not sales)? A rising rental-DOM trend means longer vacancies and softer asking-rent achievability than the comps imply.
- What's the recent tenant-quality profile in this submarket — average credit score on applications, eviction rate, late-payment / NSF rate, and stable-employment percentage? A property-management company in the area should have these aggregated.
- How much new for-sale + rental construction is in the pipeline within 1–3 miles? Heavy new supply typically softens prices + rents 12–24 months out; constrained supply supports both.
Investment metrics
- 1% rule
- 0.84% ✗
- Cap rate
- 6.01%
- Cash-on-cash
- -1.03%
- DSCR
- 0.95
- GRM
- 9.9
CMA / ARV
- ARV (on-the-fly)
- $370,728
- Comps found
- 12
Show comp detail 12 sales within ~0.75 mi
| Address | Dist | Beds/Ba | Sqft | Sold | Price | $/sf | Match |
|---|---|---|---|---|---|---|---|
| 48 Hathorn Blvd | 0.29mi | 4/2.0 (+1) | 1,368 (0%) | 2mo | $365,000 | $267 | 76 |
| 33 Karista Spring Dr | 0.17mi | 3/2.0 | 1,309 (-4%) | 13mo | $421,000 | $322 | 71 |
| 24 Orenda Spring Dr | 0.12mi | 3/1.5 | 1,286 (-6%) | 14mo | $330,000 | $257 | 70 |
| 13 Deerleap Pl | 0.23mi | 3/1.0 | 1,272 (-7%) | 9mo | $345,000 | $271 | 70 |
| 52 Curt Blvd | 0.43mi | 3/1.5 | 1,368 (0%) | 12mo | $390,000 | $285 | 68 |
| 15 Tamarack Trl | 0.43mi | 3/2.0 | 1,368 (0%) | 12mo | $360,000 | $263 | 66 |
| 44 Curt Blvd | 0.40mi | 3/1.5 | 1,214 (-11%) | 3mo | $300,000 | $247 | 58 |
| 67 Vichy Dr | 0.49mi | 4/1.5 (+1) | 1,400 (+2%) | 15mo | $435,000 | $311 | 54 |
| 59 Wagon Wheel Trl | 0.22mi | 4/1.5 (+1) | 1,200 (-12%) | 12mo | $380,000 | $317 | 52 |
| 56 Coachman Dr | 0.66mi | 3/2.0 | 1,389 (+2%) | 13mo | $420,000 | $302 | 52 |
| 94 Quevic Dr | 0.47mi | 2/1.5 (-1) | 1,296 (-5%) | 16mo | $335,000 | $258 | 49 |
| 50 Deer Run Dr | 0.73mi | 3/1.5 | 1,480 (+8%) | 6mo | $325,000 | $220 | 45 |
Match score weights: distance 35% · size 25% · config 20% · recency 20%. Top-matched comps best support the ARV.
Projected returns pro-forma
-3.0% appreciation · 8.0% rent growth · sell at horizon
- IRR
- -12.6%
- Equity multiple
- 0.53×
- Total profit
- $-43,151
- Equity at exit
- $48,444
- IRR
- 2.7%
- Equity multiple
- 1.24×
- Total profit
- $21,815
- Equity at exit
- $28,091
Cash invested: $90,972 (down + closing). Projections, not guarantees.
Landlord ↔ Tenant lean methodology
- Overall (STATE)
- 15 Strongly Tenant-Friendly
- State New York
- 15 Strongly Tenant-Friendly · D+10
- County
- — inherits STATE
- City
- — inherits STATE
ZIP-level market 12866
- Home prices YoY
- -31.8%
- Rents YoY
- 9.2%
- Active inventory
- 474
- Price-to-rent
- 9.9×
Monthly cashflow live
- Estimated rent
- $2,729 medium interval (Pro) →
- Mortgage (P&I)
- −$1,704
- Tax from tax record
- −$394 /mo · $4,733/yr
- Insurance
- −$135
- HOA
- −$0
- Vacancy / Maint / Mgmt
- −$573
- Net cashflow
- $-78
Break-even live
Sensitivity live
| Price | -10% $106 | -5% $14 | +0% $-78 | +5% $-170 | +10% $-262 |
|---|---|---|---|---|---|
| Rent | -10% $-293 | -5% $-186 | +0% $-78 | +5% $30 | +10% $138 |
| Rate | -1.0pp $86 | -0.5pp $5 | base $-78 | +0.5pp $-162 | +1.0pp $-248 |
UW: 25.0% down · 7.5% · 30yr · 1.5% tax · 5.0% vac · 8.0% maint · 8.0% mgmt
Financing live
Cash to close
- Down payment
- $81,225
- Closing costs
- $9,747
- Reserves months
- —
- Total cash needed
- —
Loan-product check · same deal, 3 products live
Conventional
25% down · 7.5% · 30yr
- Down + closing
- —
- Monthly P&I
- —
- Monthly cashflow
- —
- DSCR
- —
- Eligible?
- —
Personal DTI + credit; lowest rate.
DSCR
20% down · 8.5% · 30yr
- Down + closing
- —
- Monthly P&I
- —
- Monthly cashflow
- —
- DSCR
- —
- Eligible?
- —
No personal income docs; deal must DSCR.
Hard money
10% down · 12.0% · 12mo
- Down + closing
- —
- Monthly P&I
- —
- Monthly cashflow
- —
- DSCR
- —
- Eligible?
- —
Short-term bridge; refi at stabilization.
Rent comps 2 comps
| Address | Beds | Baths | Sqft | Rent | $/sqft | DOM | Units | Dist |
|---|---|---|---|---|---|---|---|---|
| 91 Hutchins Rd Ballston Spa, NY | 2.0 | 2.0 | 1316 | $3,050 | $2.32 | 15d | 7 | 0.65mi |
| 24 Winners Cir Saratoga Springs, NY | 3.0 | 2.5 | 1778 | $2,500 | $1.41 | 16d | 1 | 1.17mi |
Listing history 10 events
-
2026-04-14status Pending
-
2026-04-13historical Contingent
-
2026-04-10$324,900 Active
-
2006-08-04soldstatus $185,000
-
2006-06-23soldstatus $185,000 177-char remark
Show marketing remark (177 chars)
House beautiful. You will fall in love with this 3 Br/1 Bath 2 car garage.Newer kitchen, new furnace,newly remodeled family room with woodstove. A must see. Excellent Condition
-
2006-04-09historical 177-char remark
Show marketing remark (177 chars)
House beautiful. You will fall in love with this 3 Br/1 Bath 2 car garage.Newer kitchen, new furnace,newly remodeled family room with woodstove. A must see. Excellent Condition
-
2006-03-26$182,000 177-char remark
Show marketing remark (177 chars)
House beautiful. You will fall in love with this 3 Br/1 Bath 2 car garage.Newer kitchen, new furnace,newly remodeled family room with woodstove. A must see. Excellent Condition
-
2000-11-27soldstatus $95,900
-
2000-11-15soldstatus $95,900 173-char remark
Show marketing remark (173 chars)
PRIDE OF OWNERSHIP SHINES THROUGH - NEW WINDOWS, CARPET, 2 YR OLD OUTSTANDING KITCHEN, FAMILY ROOM WITH WOOD STOVE, DECK, CENTRAL AIR AND A 7 YR OLD ROOF. Superior Condition
-
2000-07-30$95,900 173-char remark
Show marketing remark (173 chars)
PRIDE OF OWNERSHIP SHINES THROUGH - NEW WINDOWS, CARPET, 2 YR OLD OUTSTANDING KITCHEN, FAMILY ROOM WITH WOOD STOVE, DECK, CENTRAL AIR AND A 7 YR OLD ROOF. Superior Condition
ⓘ Source: listings_history table (triggers on properties + properties_extension) + one-shot
backfill from property_details.listing_events for pre-trigger history.
Tax reassessment forecast NY · Partial reset (capped growth)
- Current annual tax
- $4,733 · $394/mo
- Projected year-2 tax
- $5,112 · $426/mo
- Expected delta
- +$379/yr (+$32/mo · 8.0%)
ⓘ Screening estimate from a state-policy table — verify with the county assessor before closing.
Climate risk First Street
- Flood 1/10 Low FEMA zone X · 0% chance over 30 yrs
- Wildfire 3/10 Moderate
- Heat 3/10 Moderate 7 d/yr ≥97°F today · 16 d/yr by 30 yrs out
- Wind 2/10 Low 4% chance of damaging wind over 30 yrs
- Air quality 2/10 Low 0 unhealthy d/yr today · 1 by 30 yrs out
Nearby sold comps map
Loading sold comps map…
Walkable amenities ~0.75 mi
Loading nearby amenities…
Taxation est. · year 1
- Rental income
- $32,746
- − Mortgage interest
- −$18,199
- − Property taxes
- −$4,733
- − Insurance
- −$1,624
- − Repairs & maintenance
- −$2,620
- − Management
- −$2,620
- − Depreciation
- −$9,452
- Taxable loss
- −$6,502
- Est. tax savings @ 24.0%
- +$1,561
- After-tax cash flow
- $626/yr
For passive investors: Depreciation is non-cash, so a rental often shows a tax loss while cash-flowing — sheltering income. Rental losses are passive: they offset passive income freely, and up to $25,000/yr can offset ordinary (W-2) income if you actively participate and your MAGI is under $100k (phasing out to $0 by $150k); unused losses carry forward. On sale, claimed depreciation is recaptured at up to 25%, and gains may owe capital-gains tax (a 1031 exchange can defer both). Figures are a year-1 estimate at your 24.0% rate — not tax advice; consult a CPA.
Schools (NCES district)
- District
- Saratoga Springs City SD
- NCES district ID
- 3625770
- Math proficiency
- 67% ▼ -10.00%
- Reading proficiency
- 72% ▲ 6.00%
- Median HH income
- $69,864
- Composite
- 60.83/100
- National rank
- #818
- State rank
- #138 of 590 in NY
Livability — Saratoga Springs
- Score
- 82/100
- State rank
- #83
- US rank
- #1284
Category grades
Schools grade is shown separately in the Schools card above.
Census & demographics
- Census place
- Saratoga Springs, NY
- County
- Saratoga County · 166,192 people
- City population
- 40,057
- Metro
- Albany-Schenectady-Troy, NY
- Population (ZIP)
- 40,057
- Household income
- $101,901
- Rent vs Own
- Severe rent burden
- 1424.0
Population outlook (Saratoga County) Hauer SSP2
- Today (2025)
- 238,889 people
- By 2030
- 243,681 · +2.0%
- By 2040
- 249,118 · +4.3%
- By 2050
- 248,638 · +4.1%
- By 2075
- 241,675 · +1.2%
- By 2100
- 213,150 · -10.8%
Race, ethnicity, and origin ACS 2023
- Neighborhood character
- Predominantly White (87%)
- Race & ethnicity
- White 87% Two or more races 5% Hispanic / Latino 4% Asian 2% Black 2%
- Common ancestry
- Romanian 6% Lithuanian 5% Slovak 2%
- Foreign-born
- 6% · Canada, South Korea, China
- Languages at home
- 92% English-only · Spanish 2% German/W. Germanic 1% Korean 1%
Political lean MEDSL · Saratoga
- 2024 margin
- Toss-up / Even · D 50.9% · R 49.1%
- 2008→2024 swing
- -1.6pp toward R · 2008: 3.4pp · 2024: 1.8pp
- All cycles
- 2024: D+1.8 2020: D+5.4 2016: R+4.4 2012: D+2.1 2008: D+3.4
Not yet ingested
- Civics
- —
Market trends
- HPI YoY
- ▼ -178.78%
- Current HPI
- 382.7429
- Rent YoY
- ▲ 9.15%
- Metro
- Albany-Schenectady-Troy, NY
- State GDP YoY
- ▲ 2.60%
- F500 in state
- 92
Industry mix (Fortune 500 HQ in NY)
| Industry | F500 HQs | Revenue |
|---|---|---|
| Financial Services | 10 | $950B |
|
||
| Consumer Goods | 9 | $162B |
|
||
| Insurance | 4 | $225B |
|
||
| Telecommunications | 2 | $144B |
|
||
| Pharmaceuticals | 2 | $112B |
|
||
| Media / Entertainment | 2 | $69B |
|
||
Price history
+238.8% since first listed10 events — show timeline
- 2026-04-14 Pending — Global MLS
- 2026-04-13 Contingent — Global MLS
- 2026-04-10 Listed $324,900 Global MLS
- 2006-08-04 Sold (Public Records) $185,000 Public Records
- 2006-06-23 Sold (MLS) $185,000 Global MLS
- 2006-04-09 Listing Removed — Global MLS
- 2006-03-26 Listed $182,000 Global MLS
- 2000-11-27 Sold (Public Records) $95,900 Public Records
- 2000-11-15 Sold (MLS) $95,900 Global MLS
- 2000-07-30 Listed $95,900 Global MLS
Property tax history
+3.8%/yrLatest (2025): $4,733 · +6.6% YoY. Source: county tax records.
Cash-flow waterfall
monthlySold comps — $/sqft
last 12 mo · ≤1 miLoading sold comps…