 🏗️ New Construction
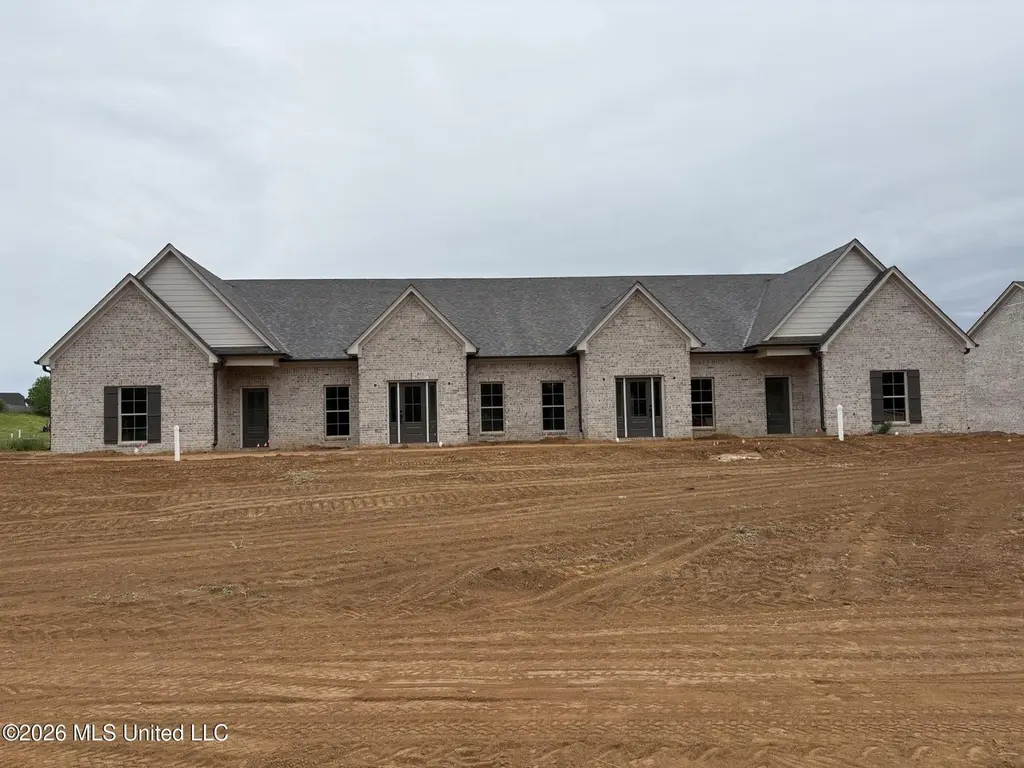
3015 Luna Way · Southaven, MS
Flood risk 1/10 · Minimal
- FEMA flood zone
- X (unshaded)
- Chance of flooding over 30 yrs
- 0.0%
- Est. flood insurance / yr
- $507 – $1,088
Fire risk 5/10 · Moderate
- Est. fire insurance / yr
- $1,241 – $2,305
Heat risk 6/10 · Moderate
- Hot days now (above 109°F)
- 7 days/yr
- Hot days in 30 yrs
- 21 days/yr
Wind risk 4/10 · Minor
- Chance of severe wind over 30 yrs
- 19.0%
Air-quality risk 2/10 · Minimal
- Unhealthy air days now
- 2 days/yr
- Unhealthy air days in 30 yrs
- 2 days/yr
Risk factors via First Street. Map © Google.
Why this score? — see what drove the F grade
The composite is a weighted blend of 9 inputs, each scored 0–100. Each bar is that input's sub-score; the figure is the points it added to the 100-point composite (weight × sub-score).
- ARV discount +7.5/15.0
- Cash flow +6.4/30.0
- Condition / age +5.0/5.0
- Schools +4.0/10.0
- Livability +3.2/5.0
- Rent growth +2.5/5.0
- 1% rule +1.6/10.0
- DSCR +0.7/10.0
- Appreciation +0.0/10.0
$298,500
🖨 Deal sheet (PDF) 📄 Offer letter ✓ Due diligence
Listing remarks
Welcome to this Beautiful New Community in Southaven, a desirable 55+ Community that is conveniently located for all of your needs. Step inside this lovely New Home and you will see a large great room. Also, featuring the eat in kitchen with custom cabinets. The master bath has a walk -in shower. Don't miss the large patio. This one is a must see. Call for showing, today!
Key facts
- 3,484 sq ft lot
- 2 garage spots
- Built 2026
Property features AI
Finance
- HOA & community: Has association; association fees include grounds maintenance
Exterior
- Parking: Attached 2-car garage with garage door opener
- Security: Smoke detectors; Firewalls
- Utilities: Public water; Public sewer; Electricity connected; Natural gas connected
- Home design: Single-family house; One story; New construction
- Construction: Brick and HardiPlank-type siding; Architectural shingle roof; Slab foundation; Built by the builder (new construction)
- Exterior features: Rain gutters; Wood fencing; City lot; Landscaped; Level yard; Lot dimensions approximately 30 x 120
Interior
- Kitchen: Dishwasher; Disposal; Free‑standing electric oven
- Bedrooms: Three bedrooms on the first floor; Plus a first-floor great room
- Flooring: Carpet; Tile
- Bathrooms: 2 full bathrooms
- Heating & cooling: Central heating (natural gas); Central air; Ceiling fan cooling
- Interior features: Ceiling fans; Eat-in kitchen; High ceilings; Insulated windows; Insulated doors
Neighborhood map
What this means for you Summary
Snapshot
- This is a 3-bed/2.0-bath single-family listed at $298k. Condition is rated excellent.
Deal economics
- At list price, monthly cash flow is $-595 ($-7k/yr) — negative.
- To cash-flow at today's rent, offer at most $260k (12.8% below list).
- To meet the 1% rule (rent ≥ 1% of price), the offer needs to be $228k (23.7% below list).
- Recommended offer: $228k (23.7% below list) — sets the bar for 1% rule.
Location & tenants
- Location reads 65/100 on livability (#107 in MS) — a middle-class / working-renter tenant base. Strengths: cost of living A+, housing A+; Watch: amenities F, commute F, health & safety F.
- Desoto County School District (suburban): math 48% / reading 42% proficiency, ranked #20 of 130 in MS (top 15%) — families likely to look elsewhere, expect single-tenant / working-renter base with shorter leases.
- Zoned schools: Desoto Central Primary (876 students, 100% FRL); Desoto Central Middle School (math 62% / reading 48%, grade B-, #15 of 179 statewide, top 8%, 1,468 students, 100% FRL); Desoto Central High School (math 36% / reading 52%, grade F, #40 of 197 statewide, top 20%, 1,995 students, 100% FRL) — zoned schools average 100% FRL vs 43% district-wide (56 pts higher); higher-poverty schools than district average — tighter screening recommended.
- Market conditions: 158 active listings in the ZIP; high-income renter base; 1,155 units permitted in DeSoto County in 2024 (0 in 5+ unit buildings).
Forward outlook
- Local home prices are declining (-3.0%/yr); year-one equity from $2k of loan paydown is wiped out by about $10k of value loss. Plan a longer hold.
- DeSoto County population projected at +33% by 2050 — long-run rental-demand tailwind backs the buy-and-hold thesis.
Negotiation context
- It's been on market 64 days — a 6% lower offer ($281k) is reasonable based on typical stale-listing flexibility.
Risks & watch-outs
- Climate carrying-cost: moderate wildfire risk; extreme-heat days projected 7→21/yr by 2055 (HVAC capex compounding) — expect insurance premiums to compound above CPI over the hold.
Questions for the listing agent
- What do current leases actually rent for vs. the listed asking? Can we see a recent rent roll and the last 12 months of T-12 income?
- It's been on market 64 days. Have you received any prior offers? Is the seller open to a 24% concession, seller financing, or rate buy-down credit?
- Why hasn't it sold? Are there any deal-killer items the seller is aware of (foundation, flood, title, zoning, code violations)?
- Is there a deadline driving the sale (1031 exchange, divorce, estate, relocation)? That informs how much negotiation room exists.
- Schools are D-rated, which usually means shorter tenancies and higher turnover. Who's the typical renter profile here, and what's been the actual vacancy rate?
- The area grade is low — what's the realistic commute time and amenity access for the typical tenant pool here? Any planned neighborhood developments (good or bad) we should know about?
- What's the average days-on-market for RENTAL listings here right now (not sales)? A rising rental-DOM trend means longer vacancies and softer asking-rent achievability than the comps imply.
- What's the recent tenant-quality profile in this submarket — average credit score on applications, eviction rate, late-payment / NSF rate, and stable-employment percentage? A property-management company in the area should have these aggregated.
- How much new for-sale + rental construction is in the pipeline within 1–3 miles? Heavy new supply typically softens prices + rents 12–24 months out; constrained supply supports both.
Investment metrics
- 1% rule
- 0.66% ✗
- Cap rate
- 4.23%
- Cash-on-cash
- -7.36%
- DSCR
- 0.67
- GRM
- 12.7
CMA / ARV
- ARV (median comp)
- $346,425
- List price
- $298,500
- Delta
- -13.83%
- Verdict
- UNDERPRICED
- Comps
- 2 within 1.0 mi
Projected returns pro-forma
-3.0% appreciation · 3.0% rent growth · sell at horizon
- IRR
- -29.1%
- Equity multiple
- 0.03×
- Total profit
- $-94,011
- Equity at exit
- $51,653
- IRR
- -29.3%
- Equity multiple
- -0.35×
- Total profit
- $-130,539
- Equity at exit
- $29,952
Cash invested: $96,999 (down + closing). Projections, not guarantees.
Landlord ↔ Tenant lean methodology
- Overall (STATE)
- 90 Strongly Landlord-Friendly
- State Mississippi
- 90 Strongly Landlord-Friendly · R+11
- County
- — inherits STATE
- City
- — inherits STATE
ZIP-level market 38672
- Home prices YoY
- -13.1%
- Active inventory
- 158
- Price-to-rent
- 10.9×
Monthly cashflow live
- Estimated rent
- $2,277 medium interval (Pro) →
- Mortgage (P&I)
- −$1,817
- Tax est. 1.5%
- −$433 /mo · $5,196/yr
- Insurance
- −$144
- HOA
- −$0
- Vacancy / Maint / Mgmt
- −$478
- Net cashflow
- $-595
Break-even live
Sensitivity live
| Price | -10% $-356 | -5% $-476 | +0% $-595 | +5% $-715 | +10% $-835 |
|---|---|---|---|---|---|
| Rent | -10% $-775 | -5% $-685 | +0% $-595 | +5% $-505 | +10% $-415 |
| Rate | -1.0pp $-421 | -0.5pp $-507 | base $-595 | +0.5pp $-685 | +1.0pp $-776 |
UW: 25.0% down · 7.5% · 30yr · 1.5% tax · 5.0% vac · 8.0% maint · 8.0% mgmt
Financing live
Cash to close
- Down payment
- $86,606
- Closing costs
- $10,393
- Reserves months
- —
- Total cash needed
- —
Loan-product check · same deal, 3 products live
Conventional
25% down · 7.5% · 30yr
- Down + closing
- —
- Monthly P&I
- —
- Monthly cashflow
- —
- DSCR
- —
- Eligible?
- —
Personal DTI + credit; lowest rate.
DSCR
20% down · 8.5% · 30yr
- Down + closing
- —
- Monthly P&I
- —
- Monthly cashflow
- —
- DSCR
- —
- Eligible?
- —
No personal income docs; deal must DSCR.
Hard money
10% down · 12.0% · 12mo
- Down + closing
- —
- Monthly P&I
- —
- Monthly cashflow
- —
- DSCR
- —
- Eligible?
- —
Short-term bridge; refi at stabilization.
Listing history 15 events
-
2026-06-21days on market $298,500 Active 64 DOM
-
2026-06-18days on market $298,500 Active 61 DOM
-
2026-06-17days on market $298,500 Active 60 DOM
-
2026-06-16days on market $298,500 Active 59 DOM
-
2026-06-15days on market $298,500 Active 58 DOM
-
2026-06-13days on market $298,500 Active 56 DOM
-
2026-06-10days on market $298,500 Active 53 DOM
-
2026-06-09days on market $298,500 Active 52 DOM
-
2026-06-08days on market $298,500 Active 51 DOM
-
2026-06-07days on market $298,500 Active 50 DOM
-
2026-06-03days on market $298,500 Active 46 DOM
-
2026-06-02days on market $298,500 Active 45 DOM
-
2026-06-01days on market $298,500 Active 44 DOM
-
2026-05-31days on market $298,500 Active 43 DOM
-
2026-04-17$298,500 Active 374-char remark
ⓘ Source: listings_history table (triggers on properties + properties_extension) + one-shot
backfill from property_details.listing_events for pre-trigger history.
Climate risk First Street
- Flood 1/10 Low FEMA zone X (unshaded) · 0% chance over 30 yrs
- Wildfire 5/10 Major
- Heat 6/10 Major 7 d/yr ≥109°F today · 21 d/yr by 30 yrs out
- Wind 4/10 Moderate 19% chance of damaging wind over 30 yrs
- Air quality 2/10 Low 2 unhealthy d/yr today · 2 by 30 yrs out
Nearby sold comps map
Loading sold comps map…
Walkable amenities ~0.75 mi
Loading nearby amenities…
Taxation est. · year 1
- Rental income
- $27,324
- − Mortgage interest
- −$19,405
- − Property taxes
- −$5,196
- − Insurance
- −$1,732
- − Repairs & maintenance
- −$2,186
- − Management
- −$2,186
- − Depreciation
- −$10,078
- Taxable loss
- −$13,459
- Est. tax savings @ 24.0%
- +$3,230
- After-tax cash flow
- $-3,912/yr
For passive investors: Depreciation is non-cash, so a rental often shows a tax loss while cash-flowing — sheltering income. Rental losses are passive: they offset passive income freely, and up to $25,000/yr can offset ordinary (W-2) income if you actively participate and your MAGI is under $100k (phasing out to $0 by $150k); unused losses carry forward. On sale, claimed depreciation is recaptured at up to 25%, and gains may owe capital-gains tax (a 1031 exchange can defer both). Figures are a year-1 estimate at your 24.0% rate — not tax advice; consult a CPA.
Condition & rehab AI · 11 photos
This new construction home in a desirable 55+ community is move-in ready with excellent condition and high potential for value appreciation.
Value-add opportunities
- Both Landscaping — Enhances curb appeal and adds value
- Both Custom window treatments — Improves aesthetics and energy efficiency
- Both Smart home integration — Enhances convenience and adds value
Renovation cost estimate screening
Value-add ROI direction
- Both Landscaping — Enhances curb appeal and adds value ↑
- Both Custom window treatments — Improves aesthetics and energy efficiency ↑
- Both Smart home integration — Enhances convenience and adds value ↑
ⓘ Cost ranges are severity-bucket heuristics (US national rule-of-thumb). Get contractor quotes + a written scope before underwriting a rehab budget.
Schools (NCES district)
- District
- Desoto County School District
- NCES district ID
- 2801320
- Math proficiency
- 48% ▼ -13.00%
- Reading proficiency
- 42% ▼ -6.00%
- Median HH income
- $59,272
- Composite
- 39.56/100
- National rank
- #3933
- State rank
- #20 of 130 in MS
Livability — Southaven
- Score
- 65/100
- State rank
- #107
- US rank
- #12584
Category grades
Schools grade is shown separately in the Schools card above.
Census & demographics
- Census place
- Southaven, MS
- County
- DeSoto County · 176,513 people
- City population
- 53,755
- Metro
- Memphis, TN-MS-AR
- Population (ZIP)
- 16,436
- Household income
- $116,184
- Rent vs Own
- Severe rent burden
- 44.0
Population outlook (DeSoto County) Hauer SSP2
- Today (2025)
- 203,338 people
- By 2030
- 217,692 · +7.1%
- By 2040
- 245,320 · +20.6%
- By 2050
- 270,133 · +32.8%
- By 2075
- 323,341 · +59.0%
- By 2100
- 348,742 · +71.5%
Race, ethnicity, and origin ACS 2023
- Neighborhood character
- Majority White (60%)
- Race & ethnicity
- White 60% Black 31% Hispanic / Latino 5% Two or more races 4% Asian 3%
- Hispanic origin (detail)
- Mexican 3%
- Common ancestry
- Subsaharan African 2% Italian 2% Serbian 1%
- Foreign-born
- 5% · Canada, China
- Languages at home
- 96% English-only · Spanish 2% Chinese 1% Other Asian/Pacific 1%
Political lean MEDSL · DeSoto
- 2024 margin
- Strong R (+24.1) · D 36.7% · R 60.8% · Other 2.5%
- 2008→2024 swing
- +14.2pp toward D · 2008: -38.2pp · 2024: -24.1pp
- All cycles
- 2024: R+24.1 2020: R+23.9 2016: R+34.8 2012: R+33.5 2008: R+38.2
Not yet ingested
- Civics
- —
Market trends
- HPI YoY
- ▼ -25.90%
- Current HPI
- 172.4771
- Rent YoY
- —
- Metro
- Memphis, TN-MS-AR
- State GDP YoY
- —
- F500 in state
- 0
Price history
1 event — show timeline
- 2026-04-17 Listed $298,500 MLSU
Cash-flow waterfall
monthlySold comps — $/sqft
last 12 mo · ≤1 miLoading sold comps…