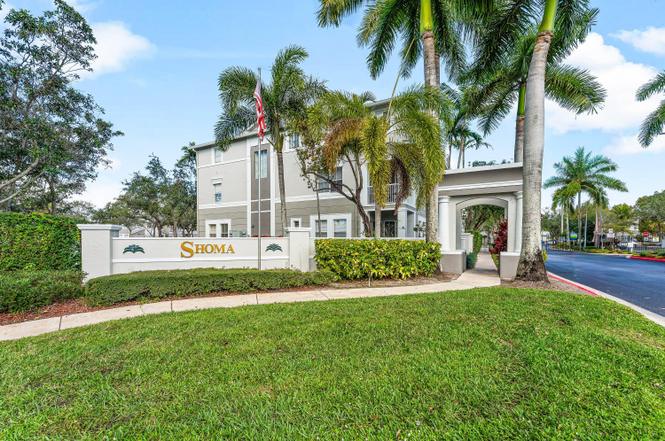
1012 Shoma Dr · Royal Palm Beach, FL
Flood risk 7/10 · Major
- FEMA flood zone
- X (unshaded)
- Chance of flooding over 30 yrs
- 0.99%
- Est. flood insurance / yr
- $507 – $1,088
Fire risk 1/10 · Minimal
- Est. fire insurance / yr
- $947 – $1,759
Heat risk 10/10 · Severe
- Hot days now (above 107°F)
- 7 days/yr
- Hot days in 30 yrs
- 26 days/yr
Wind risk 10/10 · Severe
- Chance of severe wind over 30 yrs
- 99.0%
Air-quality risk 2/10 · Minimal
- Unhealthy air days now
- 0 days/yr
- Unhealthy air days in 30 yrs
- 1 days/yr
Risk factors via First Street. Map © Google.
Why this score? — see what drove the D grade
The composite is a weighted blend of 9 inputs, each scored 0–100. Each bar is that input's sub-score; the figure is the points it added to the 100-point composite (weight × sub-score).
- Cash flow +11.6/30.0
- ARV discount +7.5/15.0
- 1% rule +5.6/10.0
- Schools +4.3/10.0
- Livability +4.0/5.0
- DSCR +3.4/10.0
- Rent growth +3.1/5.0
- Condition / age +2.5/5.0
- Appreciation +0.0/10.0
$297,000
🖨 Deal sheet 📄 Offer letter ✓ Due diligence
Listing remarks
Welcome to this beautifully maintained 3-bedroom, 2-bathroom condo featuring two assigned parking spaces and a thoughtfully updated interior. Enjoy peace of mind with a newer AC and water heater. Located on the second floor with your own landing, this bright and airy residence offers comfortable living in a prime location—just minutes from shopping, dining, entertainment, and everything Wellington and Royal Palm Beach have to offer. Perfect for homeowners or investors seeking convenience, value, and lifestyle.
Key facts
- Newer ac
- Updated interior
- Newer water heater
Tags
Property features AI
Finance
- HOA & community: HOA with a monthly fee of $565; HOA includes security and water; Community pool
Exterior
- Parking: Assigned parking; 2 open parking spaces
- Security: Fire alarm; Gated community (no guard)
- Utilities: Public water; Public sewer; Three-phase electric; Cable available
- Home design: Condominium; Multi/split levels; 2 total stories; East-facing
- Construction: Built with CBS (concrete block and stucco)
- Exterior features: Not waterfront
Interior
- Kitchen: Dishwasher; Electric range; Microwave
- Bedrooms: 3 bedrooms on the main level
- Flooring: Ceramic tile
- Bathrooms: 2 full bathrooms (both on the main level)
- Heating & cooling: Central heating; Central air conditioning
- Interior features: Split bedroom layout; Unfurnished
Neighborhood map
What this means for you Summary
Snapshot
- This is a 3-bed/2.0-bath condo listed at $297k.
Deal economics
- At list price, monthly cash flow is $-159 ($-2k/yr) — negative.
- To cash-flow at today's rent, offer at most $269k (9.5% below list).
- Meets the 1% rule at list price ($3k rent vs $297k).
- Recommended offer: $261k (12.0% below list) — sets the bar for market timing.
Location & tenants
- Location reads 79/100 on livability (#135 in FL, #2,039 nationally) — a middle-class / working-renter tenant base. Strengths: employment A+, housing A+, health & safety A+; Watch: cost of living C-, amenities F, commute F.
- Palm Beach (suburban): math 46% / reading 53% proficiency, ranked #34 of 73 in FL (top 47%) — families likely to look elsewhere, expect single-tenant / working-renter base with shorter leases.
- Market conditions: Rents rising (+2.3%/yr); 616 active listings in the ZIP; 31 comparable units currently listed for rent nearby; rentals at typical pace (median 25d on market — plan ~3-4 weeks tenant-placement turnaround); high-income renter base; 3,974 units permitted in Palm Beach County in 2024 (1,012 in 5+ unit buildings).
- This rent runs 34% of the median local income ($112k/yr) — at the standard rent-burdened threshold; future hikes will face affordability resistance.
Forward outlook
- Local home prices are declining (-3.0%/yr); year-one equity from $2k of loan paydown is wiped out by about $9k of value loss. Plan a longer hold.
- Palm Beach County population projected at +30% by 2050 — long-run rental-demand tailwind backs the buy-and-hold thesis.
Negotiation context
- It's been on market 142 days — a 12% lower offer ($261k) is reasonable based on typical stale-listing flexibility.
- 3 sale attempts since 3y ago; this cycle's ask has dropped $23k (7%) from the opening price — seller is motivated, your offer sets the floor, not the list.
Risks & watch-outs
- Watch-outs: flood insurance adds $66/mo.
- Climate carrying-cost: major flood risk; severe wind risk, 99% chance of damaging wind over 30y; extreme-heat days projected 7→26/yr by 2055 (HVAC capex compounding) — expect insurance premiums to compound above CPI over the hold.
Questions for the listing agent
- What do current leases actually rent for vs. the listed asking? Can we see a recent rent roll and the last 12 months of T-12 income?
- It's been on market 142 days. Have you received any prior offers? Is the seller open to a 12% concession, seller financing, or rate buy-down credit?
- What's the actual annual flood-insurance premium (NFIP or private), and is the property in a SFHA with mandatory coverage?
- What does the HOA fee cover, when was the last increase, and are there any pending special assessments or reserve-fund shortfalls?
- Any open or pending special assessments — roof, HVAC, plumbing, elevator, façade? What's the per-unit balance and payoff schedule, and is the seller paying it off at close or rolling it to the buyer?
- Why hasn't it sold? Are there any deal-killer items the seller is aware of (foundation, flood, title, zoning, code violations)?
- Is there a deadline driving the sale (1031 exchange, divorce, estate, relocation)? That informs how much negotiation room exists.
- Schools are B-rated — typically a magnet for longer-tenancy family renters. What's the average tenant stay here, and is there a school-zone premium baked into asking?
- The area grade is low — what's the realistic commute time and amenity access for the typical tenant pool here? Any planned neighborhood developments (good or bad) we should know about?
- What's the average days-on-market for RENTAL listings here right now (not sales)? A rising rental-DOM trend means longer vacancies and softer asking-rent achievability than the comps imply.
- What's the recent tenant-quality profile in this submarket — average credit score on applications, eviction rate, late-payment / NSF rate, and stable-employment percentage? A property-management company in the area should have these aggregated.
- How much new apartment / multifamily construction is in the pipeline within 1–3 miles? Heavy new supply (>2% of stock underway) typically softens rents 12–24 months out; light construction supports rent growth.
Investment metrics
- 1% rule
- 1.06% ✓
- Cap rate
- 5.92%
- Cash-on-cash
- -1.34%
- DSCR
- 0.94
- GRM
- 7.9
CMA / ARV
No comps found within radius.
Projected returns pro-forma
-3.0% appreciation · 2.31% rent growth · sell at horizon
- IRR
- -20.9%
- Equity multiple
- 0.28×
- Total profit
- $-60,022
- Equity at exit
- $44,284
- IRR
- -16.1%
- Equity multiple
- 0.13×
- Total profit
- $-72,424
- Equity at exit
- $25,679
Cash invested: $83,160 (down + closing). Projections, not guarantees.
Landlord ↔ Tenant lean methodology
- Overall (STATE)
- 87 Strongly Landlord-Friendly
- State Florida
- 87 Strongly Landlord-Friendly · R+3
- County
- — inherits STATE
- City
- — inherits STATE
ZIP-level market 33414
- Home prices YoY
- -30.2%
- Rents YoY
- 2.3%
- Active inventory
- 616
- Price-to-rent
- 7.9×
Monthly cashflow live
- Estimated rent
- $3,141 high interval (Pro) →
- Mortgage (P&I)
- −$1,558
- Tax from tax record
- −$328 /mo · $3,931/yr
- Insurance
- −$124
- Flood insurance flood zone
- −$66 /mo · $798/yr
- HOA
- −$565
- Vacancy / Maint / Mgmt
- −$660
- Net cashflow
- $-159
Break-even live
UW: 25.0% down · 7.5% · 30yr · 1.5% tax · 5.0% vac · 8.0% maint · 8.0% mgmt
Financing live
Cash to close
- Down payment
- $74,250
- Closing costs
- $8,910
- Reserves months
- —
- Total cash needed
- —
Loan-product check · same deal, 3 products live
Conventional
25% down · 7.5% · 30yr
- Down + closing
- —
- Monthly P&I
- —
- Monthly cashflow
- —
- DSCR
- —
- Eligible?
- —
Personal DTI + credit; lowest rate.
DSCR
20% down · 8.5% · 30yr
- Down + closing
- —
- Monthly P&I
- —
- Monthly cashflow
- —
- DSCR
- —
- Eligible?
- —
No personal income docs; deal must DSCR.
Hard money
10% down · 12.0% · 12mo
- Down + closing
- —
- Monthly P&I
- —
- Monthly cashflow
- —
- DSCR
- —
- Eligible?
- —
Short-term bridge; refi at stabilization.
Rent comps 31 comps
| Address | Beds | Baths | Sqft | Rent | $/sqft | DOM | Units | Dist |
|---|---|---|---|---|---|---|---|---|
| 1008 Shoma Dr Unit 394 West Palm Beach, FL | 2.0 | 2.5 | 1282 | $2,400 | $1.87 | 18d | 1 | 0.01mi |
| 570 Christina Dr Royal Palm Beach, FL | 1.0–3.0 | 1.0–2.0 | 1044 | $2,862 | $2.74 | 1d | 10 | 0.13mi |
| 3515 Shoma Dr Unit 3515 West Palm Beach, FL | 3.0 | 3.5 | 1815 | $3,250 | $1.79 | 24d | 1 | 0.14mi |
| 2127 Shoma Dr Royal Palm Beach, FL | 2.0 | 2.5 | 1282 | $2,500 | $1.95 | 24d | 1 | 0.20mi |
| 2108 Shoma Dr Royal Palm Beach, FL | 3.0 | 2.0 | 1457 | $2,400 | $1.65 | 24d | 1 | 0.20mi |
| 137 Canterbury Pl Royal Palm Beach, FL | 3.0 | 2.5 | 1856 | $3,500 | $1.89 | 24d | 1 | 0.37mi |
| 640 Pioneer Way Unit 640 Royal Palm Beach, FL | 3.0 | 2.5 | 1557 | $3,100 | $1.99 | 24d | 1 | 0.46mi |
| 220 Pioneer Way Royal Palm Beach, FL | 3.0 | 2.5 | 1557 | $3,200 | $2.06 | 7d | 1 | 0.52mi |
| 11260 Channing Way Unit 212 Royal Palm Beach, FL | 3.0 | 2.0 | 1417 | $3,174 | $2.24 | 24d | 1 | 0.55mi |
| 1090 Quaye Lake Cir Wellington, FL | 3.0 | 3.0 | 1719 | $3,513 | $2.04 | 15d | 1 | 0.56mi |
| 1090 Quaye Lake Cir Wellington, FL | 2.0 | 3.0 | 1429 | $2,761 | $1.93 | 24d | 1 | 0.56mi |
| 1090 Quaye Lake Cir Wellington, FL | 2.0 | 3.0 | 1501 | $2,695 | $1.80 | 14d | 1 | 0.56mi |
| 11200 Nicole Dr Wellington, FL | 1.0–4.0 | 1.0–3.5 | 1404 | $3,799 | $2.71 | 2d | 33 | 0.66mi |
| 11020 Town Cir Wellington, FL | 1.0–3.0 | 1.0–2.0 | 1013 | $3,143 | $3.10 | 1d | 14 | 0.86mi |
| 1592 Carriage Brooke Dr Wellington, FL | 3.0 | 2.0 | 1662 | $3,000 | $1.81 | 24d | 1 | 1.00mi |
| 10793 Oak Bend Way Wellington, FL | 4.0 | 2.5 | 1852 | $4,000 | $2.16 | 11d | 1 | 1.15mi |
| 1664 Oak Berry Cir Wellington, FL | 3.0 | 2.0 | 1325 | $3,650 | $2.75 | 24d | 1 | 1.17mi |
| 10709 Pelican Dr Wellington, FL | 2.0 | 2.0 | 1244 | $2,900 | $2.33 | 7d | 1 | 1.20mi |
| 699 Belle Grove Ln Royal Palm Beach, FL | 3.0 | 2.0 | 1849 | $3,500 | $1.89 | 24d | 1 | 1.23mi |
| 10726 Pelican Dr Wellington, FL | 3.0 | 2.0 | 1482 | $3,500 | $2.36 | 24d | 1 | 1.24mi |
| 10569 Pelican Dr Wellington, FL | 4.0 | 3.5 | 1843 | $3,450 | $1.87 | 14d | 1 | 1.26mi |
| 1950 Polo Lake Blvd Wellington, FL | 1.0–3.0 | 1.0–2.0 | 1174 | $3,449 | $2.94 | 2d | 19 | 1.27mi |
| 11297 Pine Valley Dr Wellington, FL | 3.0 | 2.0 | 1705 | $3,500 | $2.05 | 24d | 1 | 1.28mi |
| 1104 Jackpine St Unit (off-season) Wellington, FL | 3.0 | 2.0 | 1760 | $3,500 | $1.99 | 24d | 1 | 1.30mi |
| 1104 Jackpine St Wellington, FL | 3.0 | 2.0 | 1760 | $6,700 | $3.81 | 24d | 1 | 1.30mi |
| 10614 Lake Shore Dr Wellington, FL | 3.0 | 2.0 | 1550 | $3,200 | $2.06 | 24d | 1 | 1.35mi |
| 10667 Lake Shore Dr Wellington, FL | 3.0 | 2.5 | 1853 | $2,600 | $1.40 | 24d | 1 | 1.37mi |
| 502 Rambling Drive Cir Unit 2 Wellington, FL | 2.0 | 1.0 | 1413 | $2,400 | $1.70 | 24d | 1 | 1.37mi |
| 1313 Pinetta Cir Wellington, FL | 3.0 | 2.0 | 1469 | $3,700 | $2.52 | 15d | 1 | 1.39mi |
| 1891 Oak Berry Cir Wellington, FL | 3.0 | 2.0 | 1358 | $4,850 | $3.57 | 18d | 1 | 1.40mi |
| 1379 Pinetta Cir Wellington, FL | 3.0 | 2.0 | 1452 | $3,350 | $2.31 | 24d | 1 | 1.43mi |
HOA detail condo
- Monthly dues
- $565 · $6,780/yr
- Likely covers
- waterparking
- Assessments
- None detected in remarks — confirm with the listing agent.
Listing history 22 events
-
2026-06-18days on market $297,000 Active 142 DOM
-
2026-06-17days on market $297,000 Active 141 DOM
-
2026-06-16days on market $297,000 Active 140 DOM
-
2026-06-15days on market $297,000 Active 139 DOM
-
2026-06-13days on market $297,000 Active 137 DOM
-
2026-06-09days on market $297,000 Active 133 DOM
-
2026-06-07days on market $297,000 Active 131 DOM
-
2026-06-04days on market $297,000 Active 128 DOM
-
2026-06-03days on market $297,000 Active 127 DOM
-
2026-06-01days on market $297,000 Active 125 DOM
-
2026-05-31days on market $297,000 Active 124 DOM
-
2026-02-20price $297,000
-
2026-01-27$320,000 Active
-
2023-08-11soldstatus $290,000
-
2023-06-01historical
-
2023-05-02price $290,000
-
2023-03-30price $295,000
-
2023-03-10status Active
-
2023-02-04historical
-
2023-01-01$304,900 Active
-
2019-12-18soldstatus $172,500
-
2005-07-01soldstatus $225,500
ⓘ Source: listings_history table (triggers on properties + properties_extension) + one-shot
backfill from property_details.listing_events for pre-trigger history.
Tax reassessment forecast FL · Resets to sale price
- Current annual tax
- $3,931 · $328/mo
- Projected year-2 tax
- $3,931 · $328/mo
- Expected delta
- $0/yr ($0/mo · 0.0%)
ⓘ Screening estimate from a state-policy table — verify with the county assessor before closing.
Climate risk First Street
- Flood 7/10 Severe FEMA zone X (unshaded) · 99% chance over 30 yrs
- Wildfire 1/10 Low
- Heat 10/10 Extreme 7 d/yr ≥107°F today · 26 d/yr by 30 yrs out
- Wind 10/10 Extreme 99% chance of damaging wind over 30 yrs
- Air quality 2/10 Low 0 unhealthy d/yr today · 1 by 30 yrs out
Nearby sold comps map
Loading sold comps map…
Walkable amenities ~0.75 mi
Loading nearby amenities…
Taxation est. · year 1
- Rental income
- $37,688
- − Mortgage interest
- −$16,637
- − Property taxes
- −$3,931
- − Insurance
- −$2,282
- − Repairs & maintenance
- −$3,015
- − Management
- −$3,015
- − HOA
- −$6,780
- − Depreciation
- −$8,640
- Taxable loss
- −$6,612
- Est. tax savings @ 24.0%
- +$1,587
- After-tax cash flow
- $-323/yr
For passive investors: Depreciation is non-cash, so a rental often shows a tax loss while cash-flowing — sheltering income. Rental losses are passive: they offset passive income freely, and up to $25,000/yr can offset ordinary (W-2) income if you actively participate and your MAGI is under $100k (phasing out to $0 by $150k); unused losses carry forward. On sale, claimed depreciation is recaptured at up to 25%, and gains may owe capital-gains tax (a 1031 exchange can defer both). Figures are a year-1 estimate at your 24.0% rate — not tax advice; consult a CPA.
Schools (NCES district)
- District
- Palm Beach
- NCES district ID
- 1201500
- Math proficiency
- 46% ▼ -16.00%
- Reading proficiency
- 53% ▼ -4.00%
- Median HH income
- $53,943
- Composite
- 42.72/100
- National rank
- #3160
- State rank
- #34 of 73 in FL
Livability — Royal Palm Beach
- Score
- 79/100
- State rank
- #135
- US rank
- #2039
Category grades
Schools grade is shown separately in the Schools card above.
Census & demographics
- Census place
- Royal Palm Beach, FL
- County
- Palm Beach County · 1,438,312 people
- City population
- 75,299
- Metro
- Miami-Fort Lauderdale-Pompano Beach, FL
- Population (ZIP)
- 60,184
- Household income
- $112,241
- Rent vs Own
- Severe rent burden
- 1566.0
Population outlook (Palm Beach County) Hauer SSP2
- Today (2025)
- 1,637,487 people
- By 2030
- 1,743,255 · +6.5%
- By 2040
- 1,948,712 · +19.0%
- By 2050
- 2,132,979 · +30.3%
- By 2075
- 2,530,027 · +54.5%
- By 2100
- 2,706,979 · +65.3%
Race, ethnicity, and origin ACS 2023
- Neighborhood character
- Diverse neighborhood (Simpson 0.67)
- Race & ethnicity
- White 47% Hispanic / Latino 29% Two or more races 20% Black 13% Asian 6%
- Hispanic origin (detail)
- Mexican 4% Puerto Rican 5% Cuban 6% Dominican 1% Salvadoran 1%
- Common ancestry
- Hispanic 4% Romanian 3% Lithuanian 2%
- Foreign-born
- 26% · Canada, Jamaica, China
- Languages at home
- 67% English-only · Spanish 23% French/Haitian/Cajun 3% Other Indo-European 3%
Political lean MEDSL · Palm Beach
- 2024 margin
- Toss-up / Even · D 50.0% · R 49.2%
- 2008→2024 swing
- -22.1pp toward R · 2008: 22.9pp · 2024: 0.8pp
- All cycles
- 2024: D+0.8 2020: D+12.8 2016: D+15.3 2012: D+17.0 2008: D+22.9
Not yet ingested
- Civics
- —
Market trends
- HPI YoY
- ▼ -152.58%
- Current HPI
- 352.9366
- Rent YoY
- ▲ 2.31%
- Metro
- Miami-Fort Lauderdale-Pompano Beach, FL
- State GDP YoY
- ▲ 3.28%
- F500 in state
- 36
Industry mix (Fortune 500 HQ in FL)
| Industry | F500 HQs | Revenue |
|---|---|---|
| Industrial Technology | 2 | $29B |
|
||
| Insurance | 2 | $17B |
|
||
| Retail | 1 | $60B |
|
||
| Technology Distribution | 1 | $58B |
|
||
| Homebuilding | 1 | $35B |
|
||
| Technology Manufacturing | 1 | $35B |
|
||
Price history
+31.7% since first listed11 events — show timeline
- 2026-02-20 Price Changed $297,000 Beaches MLS
- 2026-01-27 Listed $320,000 Beaches MLS
- 2023-08-11 Sold (Public Records) $290,000 Public Records
- 2023-06-01 Listing Removed — Beaches MLS
- 2023-05-02 Price Changed $290,000 Beaches MLS
- 2023-03-30 Price Changed $295,000 Beaches MLS
- 2023-03-10 Relisted — Beaches MLS
- 2023-02-04 Listing Removed — Beaches MLS
- 2023-01-01 Listed $304,900 Beaches MLS
- 2019-12-18 Sold (Public Records) $172,500 Public Records
- 2005-07-01 Sold (Public Records) $225,500 Public Records
Property tax history
+13.1%/yrLatest (2025): $3,931 · +3.3% YoY. Source: county tax records.
Cash-flow waterfall
monthlySold comps — $/sqft
last 12 mo · ≤1 miLoading sold comps…