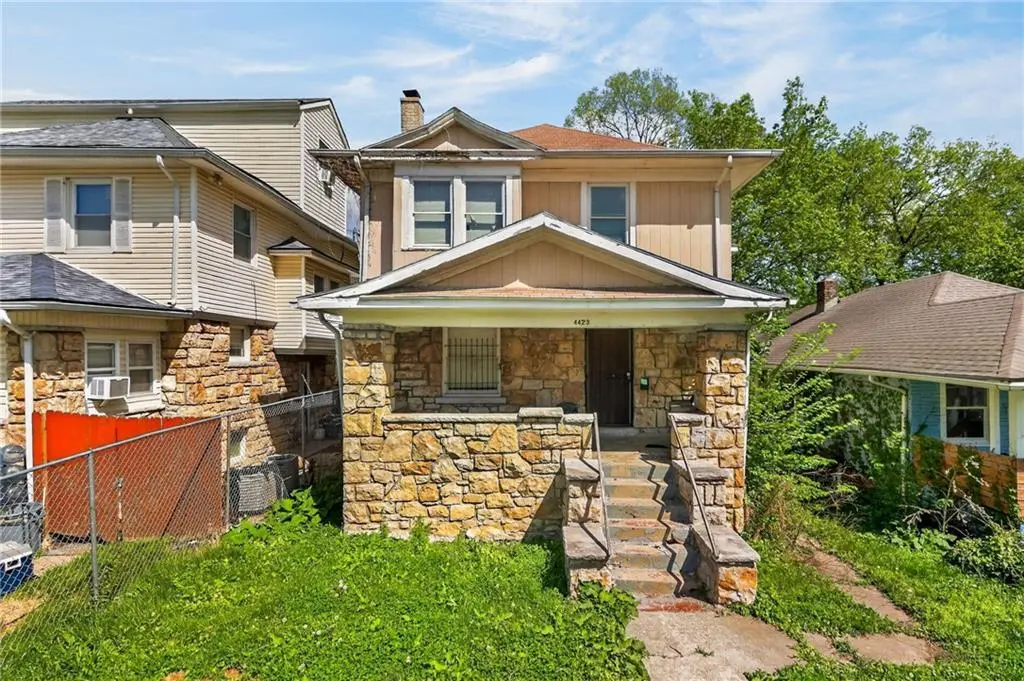
4423 Flora Ave · Kansas City, MO
Flood risk 1/10 · Minimal
- FEMA flood zone
- X (unshaded)
- Chance of flooding over 30 yrs
- 0.0%
- Est. flood insurance / yr
- $473 – $860
Fire risk 1/10 · Minimal
- Est. fire insurance / yr
- $1,054 – $1,958
Heat risk 4/10 · Minor
- Hot days now (above 106°F)
- 7 days/yr
- Hot days in 30 yrs
- 17 days/yr
Wind risk 2/10 · Minimal
- Chance of severe wind over 30 yrs
- —
Air-quality risk 3/10 · Minor
- Unhealthy air days now
- 2 days/yr
- Unhealthy air days in 30 yrs
- 4 days/yr
Risk factors via First Street. Map © Google.
Why this score? — see what drove the B grade
The composite is a weighted blend of 9 inputs, each scored 0–100. Each bar is that input's sub-score; the figure is the points it added to the 100-point composite (weight × sub-score).
- Cash flow +30.0/30.0
- ARV discount +15.0/15.0
- DSCR +10.0/10.0
- 1% rule +7.7/10.0
- Livability +3.9/5.0
- Rent growth +3.5/5.0
- Condition / age +2.5/5.0
- Schools +1.5/10.0
- Appreciation +0.0/10.0
$140,000
🖨 Deal sheet (PDF) 📄 Offer letter ✓ Due diligence
Listing remarks MLS
Opportunity knocks! This spacious 4-bedroom, 2-bath home is a true fixer-upper with strong potential for the right buyer. Featuring a classic front porch, stone exterior accents, and a traditional layout, this property is ready for a full transformation. Inside, you’ll find generous room sizes, multiple bedrooms, and the opportunity to reimagine the space from top to bottom. Whether you’re an investor looking for your next renovation project or a homeowner ready to build sweat equity, this home offers the canvas to create something special. Situated on an elevated lot with established neighboring homes, the property provides solid bones and a footprint that supports modern updates. Bring your contractor, your creativity, and your vision—this one is priced with condition in mind and ready for a fresh start.
Key facts
- 4,792 sq ft lot
- Built 1913
- Listed 43 days
Neighborhood map
What this means for you Summary
Snapshot
- This is a 3-bed/1.0-bath single-family listed at $140k.
Deal economics
- At list price, monthly cash flow is $540 ($6k/yr) — positive.
- The deal already cash-flows at list — no discount required.
- Meets the 1% rule at list price ($2k rent vs $140k).
- Recommended offer: $136k (3.0% below list) — sets the bar for market timing.
- Cap rate 10.9% vs local median 3.9% in Kansas City — top-decile yield for the area; either an underpriced asset or a hidden risk that comps aren't pricing in. Stress-test before assuming the spread holds.
Location & tenants
- Location reads 78/100 on livability (#28 in MO, #2,671 nationally) — a middle-class / working-renter tenant base. Strengths: amenities A+, commute A+, cost of living A+; Watch: schools C-, crime F.
- Kansas City 33 (urban): math 12% / reading 24% proficiency, ranked #308 of 324 in MO (top 95%) — low school quality limits family demand, transient renter base, plan for 1-2y turnover; 75% free/reduced lunch — lower-income household profile, screen leases tightly.
- Market conditions: Rents rising (+4.0%/yr); tight market (median 1 DOM); 125 active listings in the ZIP; 40 comparable units currently listed for rent nearby; rentals at typical pace (median 24d on market — plan ~3-4 weeks tenant-placement turnaround); 4,002 units permitted in Jackson County in 2024 (2,271 in 5+ unit buildings).
- This rent runs 34% of the median local income ($63k/yr) — at the standard rent-burdened threshold; future hikes will face affordability resistance.
Forward outlook
- Local home prices are declining (-3.0%/yr); year-one equity from $968 of loan paydown is wiped out by about $4k of value loss. Plan a longer hold.
- Jackson County population projected at +4% by 2050 — modest demand growth; plan on rents tracking national, not racing it.
- At projected returns (-3.0% appreciation + 4.0% rent growth), your $39k cash investment doubles in ~7 years — after that, you're playing with house money.
Negotiation context
- It's been on market 43 days — a 3% lower offer ($136k) is reasonable based on typical stale-listing flexibility.
- 3 sale attempts since 14y ago; this cycle's ask has dropped $10k (7%) from the opening price — seller is motivated, your offer sets the floor, not the list.
Risks & watch-outs
- Watch-outs: built in 1913 — expect roof / HVAC / electrical / plumbing capex.
Questions for the listing agent
- It's been on market 43 days. Have you received any prior offers? Is the seller open to a 3% concession, seller financing, or rate buy-down credit?
- Built in 1913 — when were the roof, HVAC, electrical panel, plumbing, and water heater last replaced?
- Is there a deadline driving the sale (1031 exchange, divorce, estate, relocation)? That informs how much negotiation room exists.
- Crime grade is F in this area — have there been break-ins, vandalism, or insurance claims at this property in the last 3 years? What carrier currently insures it and at what premium?
- What's the average days-on-market for RENTAL listings here right now (not sales)? A rising rental-DOM trend means longer vacancies and softer asking-rent achievability than the comps imply.
- What's the recent tenant-quality profile in this submarket — average credit score on applications, eviction rate, late-payment / NSF rate, and stable-employment percentage? A property-management company in the area should have these aggregated.
- How much new for-sale + rental construction is in the pipeline within 1–3 miles? Heavy new supply typically softens prices + rents 12–24 months out; constrained supply supports both.
Investment metrics
- 1% rule
- 1.27% ✓
- Cap rate
- 10.92%
- Cash-on-cash
- 16.52%
- DSCR
- 1.74
- GRM
- 6.6
CMA / ARV
- ARV (median comp)
- $269,162
- List price
- $140,000
- Delta
- -47.99%
- Verdict
- UNDERPRICED
- Comps
- 20 within 1.0 mi
Show comp detail 12 sales within ~0.75 mi
| Address | Dist | Beds/Ba | Sqft | Sold | Price | $/sf | Match |
|---|---|---|---|---|---|---|---|
| 4423 Flora Ave | 0.00mi | 4/2.0 (+1) | 1,636 (-3%) | 1mo | $140,000 | $86 | 86 |
| 4239 Tracy Ave | 0.28mi | 3/2.5 | 1,602 (-5%) | 1mo | $425,000 | $265 | 72 |
| 4436 Tracy Ave | 0.20mi | 3/2.5 | 1,797 (+7%) | 2mo | $429,900 | $239 | 72 |
| 4214 Campbell St | 0.54mi | 3/2.0 | 1,756 (+4%) | 2mo | $325,000 | $185 | 62 |
| 4128 Forest Ave | 0.45mi | 2/1.0 (-1) | 1,754 (+4%) | 6mo | $170,000 | $97 | 61 |
| 3920 Paseo Blvd | 0.63mi | 4/1.5 (+1) | 1,630 (-3%) | 2mo | $190,000 | $117 | 57 |
| 3905 Highland Ave | 0.67mi | 4/2.0 (+1) | 1,700 (+1%) | 2mo | $267,500 | $157 | 56 |
| 4102 Charlotte St | 0.68mi | 3/2.5 | 1,622 (-4%) | 1mo | $189,000 | $117 | 56 |
| 4955 Troostwood Rd | 0.72mi | 2/1.5 (-1) | 1,599 (-5%) | 0mo | $300,000 | $188 | 51 |
| 4226 Charlotte St | 0.58mi | 3/1.5 | 1,876 (+12%) | 1mo | $315,000 | $168 | 51 |
| 1429 E 49th St | 0.58mi | 3/2.0 | 1,484 (-12%) | 6mo | $224,900 | $152 | 44 |
| 3937 Highland Ave | 0.60mi | 4/2.5 (+1) | 1,850 (+10%) | 1mo | $282,500 | $153 | 44 |
Match score weights: distance 35% · size 25% · config 20% · recency 20%. Top-matched comps best support the ARV.
Projected returns pro-forma
-3.0% appreciation · 3.95% rent growth · sell at horizon
- IRR
- 8.6%
- Equity multiple
- 1.34×
- Total profit
- $13,358
- Equity at exit
- $20,874
- IRR
- 18.5%
- Equity multiple
- 2.60×
- Total profit
- $62,890
- Equity at exit
- $12,105
Cash invested: $39,200 (down + closing). Projections, not guarantees.
Landlord ↔ Tenant lean methodology
- Overall (STATE)
- 81 Strongly Landlord-Friendly
- State Missouri
- 81 Strongly Landlord-Friendly · R+10
- County
- — inherits STATE
- City
- — inherits STATE
ZIP-level market 64110
- Rents YoY
- 4.0%
- Median DOM (111 sales)
- 1 d
- Active inventory
- 125
- Price-to-rent
- 6.6×
Monthly cashflow live
- Estimated rent
- $1,773 high interval (Pro) →
- Mortgage (P&I)
- −$734
- Tax from tax record
- −$68 /mo · $822/yr
- Insurance
- −$58
- HOA
- −$0
- Vacancy / Maint / Mgmt
- −$372
- Net cashflow
- $540
Break-even live
Sensitivity live
| Price | -10% $619 | -5% $579 | +0% $540 | +5% $500 | +10% $460 |
|---|---|---|---|---|---|
| Rent | -10% $400 | -5% $470 | +0% $540 | +5% $610 | +10% $680 |
| Rate | -1.0pp $610 | -0.5pp $575 | base $540 | +0.5pp $503 | +1.0pp $466 |
UW: 25.0% down · 7.5% · 30yr · 1.5% tax · 5.0% vac · 8.0% maint · 8.0% mgmt
Financing live
Cash to close
- Down payment
- $35,000
- Closing costs
- $4,200
- Reserves months
- —
- Total cash needed
- —
Loan-product check · same deal, 3 products live
Conventional
25% down · 7.5% · 30yr
- Down + closing
- —
- Monthly P&I
- —
- Monthly cashflow
- —
- DSCR
- —
- Eligible?
- —
Personal DTI + credit; lowest rate.
DSCR
20% down · 8.5% · 30yr
- Down + closing
- —
- Monthly P&I
- —
- Monthly cashflow
- —
- DSCR
- —
- Eligible?
- —
No personal income docs; deal must DSCR.
Hard money
10% down · 12.0% · 12mo
- Down + closing
- —
- Monthly P&I
- —
- Monthly cashflow
- —
- DSCR
- —
- Eligible?
- —
Short-term bridge; refi at stabilization.
Rent comps 40 comps
| Address | Beds | Baths | Sqft | Rent | $/sqft | DOM | Units | Dist |
|---|---|---|---|---|---|---|---|---|
| 4232 Virginia Ave Unit 3 Kansas City, MO | 3.0 | 1.0 | 1296 | $1,100 | $0.85 | 13d | 1 | 0.27mi |
| 4228 Virginia Ave Kansas City, MO | 3.0 | 1.0 | 1200 | $1,250 | $1.04 | 11d | 1 | 0.27mi |
| 4219 Woodland Ave Kansas City, MO | 4.0 | 2.0 | 1566 | $1,900 | $1.21 | 2d | 1 | 0.30mi |
| 4211 Woodland Ave Kansas City, MO | 4.0 | 2.5 | 1926 | $2,010 | $1.04 | 17d | 1 | 0.33mi |
| 4610 Forest Ave Kansas City, MO | 3.0 | 2.0 | 1365 | $2,450 | $1.79 | 44d | 1 | 0.34mi |
| 4614 Forest Ave Kansas City, MO | 2.0 | 2.0 | 1265 | $1,995 | $1.58 | 17d | 1 | 0.35mi |
| 4117 Forest Ave Kansas City, MO | 2.0 | 2.0 | 1300 | $1,390 | $1.07 | 24d | 1 | 0.45mi |
| 4220 Harrison St Unit 1S Kansas City, MO | 3.0 | 2.0 | 1200 | $1,795 | $1.50 | 8d | 1 | 0.46mi |
| 4154 Harrison St Kansas City, MO | 2.0 | 1.0 | 1100 | $1,395 | $1.27 | 44d | 1 | 0.50mi |
| 4511 Park Ave Kansas City, MO | 4.0 | 2.5 | 1915 | $1,982 | $1.03 | 24d | 1 | 0.53mi |
| 4112 Park Ave Kansas City, MO | 4.0 | 2.0 | 1700 | $1,800 | $1.06 | 15d | 1 | 0.63mi |
| 4031 Campbell St Kansas City, MO | 4.0 | 1.5 | 2074 | $2,500 | $1.21 | 17d | 1 | 0.64mi |
| 4910 Michigan Ave Kansas City, MO | 3.0 | 1.5 | 1199 | $1,400 | $1.17 | 8d | 1 | 0.64mi |
| 4014 Park Ave Kansas City, MO | 3.0 | 2.0 | 1271 | $1,273 | $1.00 | 44d | 1 | 0.72mi |
| 4107 Olive St Kansas City, MO | 3.0 | 1.5 | 1271 | $1,578 | $1.24 | 8d | 1 | 0.72mi |
| 918 E 39th St Kansas City, MO | 2.0 | 1.0 | 1050 | $1,175 | $1.12 | 44d | 1 | 0.79mi |
| 4333 Oak St Kansas City, MO | 2.0 | 2.0 | 1250 | $1,295 | $1.04 | 44d | 1 | 0.80mi |
| 406 E 43rd St Unit 3E Kansas City, MO | 2.0 | 1.0 | 1100 | $1,675 | $1.52 | 44d | 1 | 0.83mi |
| 4138 Locust St Kansas City, MO | 4.0 | 2.0 | 1763 | $2,600 | $1.47 | 8d | 1 | 0.83mi |
| 319 E 43rd St Unit 1 Kansas City, MO | 2.0 | 1.0 | 1100 | $1,470 | $1.34 | 15d | 1 | 0.84mi |
| 4018 Prospect Ave Kansas City, MO | 4.0 | 1.5 | 1900 | $1,695 | $0.89 | 44d | 1 | 0.85mi |
| 3933 Kenwood Ave Kansas City, MO | 2.0 | 2.0 | 1050 | $2,295 | $2.19 | 4d | 1 | 0.85mi |
| 5120 The Paseo Apt 1 Kansas City, MO | 2.0 | 1.0 | 1500 | $1,550 | $1.03 | 44d | 1 | 0.86mi |
| 5122 Paseo Blvd Kansas City, MO | 3.0 | 1.0 | 1573 | $1,595 | $1.01 | 11d | 1 | 0.87mi |
| 5115 Woodland Ave Kansas City, MO | 4.0 | 1.0 | 1136 | $1,700 | $1.50 | 44d | 1 | 0.88mi |
| 4105 Oak St Kansas City, MO | 2.0 | 1.0 | 1200 | $1,250 | $1.04 | 44d | 1 | 0.90mi |
| 404 E 41st St Kansas City, MO | 4.0 | 3.0 | 1711 | $2,650 | $1.55 | 20d | 1 | 0.91mi |
| 3902 Wabash Ave Kansas City, MO | 4.0 | 2.0 | 1400 | $1,850 | $1.32 | 44d | 1 | 0.91mi |
| 1330 Rockhurst Rd Kansas City, MO | 4.0 | 2.0 | 1984 | $2,500 | $1.26 | 44d | 1 | 0.92mi |
| 4800 Oak St Kansas City, MO | 1.0–3.0 | 1.0–2.0 | 967 | $2,604 | $2.69 | 2d | 18 | 0.93mi |
| 5114 Brooklyn Ave Kansas City, MO | 3.0 | 1.5 | 1116 | $1,300 | $1.16 | 8d | 1 | 0.95mi |
| 4427 Agnes Ave Kansas City, MO | 3.0 | 1.0 | 1100 | $1,350 | $1.23 | 17d | 1 | 0.96mi |
| 4119 S Benton Ave Kansas City, MO | 4.0 | 2.0 | 1700 | $1,800 | $1.06 | 44d | 1 | 0.97mi |
| 2420 E 51st St Kansas City, MO | 3.0 | 2.0 | 1460 | $1,350 | $0.92 | 24d | 1 | 1.01mi |
| 133 E 46th St Kansas City, MO | 2.0 | 1.0 | 1300 | $1,295 | $1.00 | 8d | 1 | 1.02mi |
| 3609 Wayne Ave Kansas City, MO | 3.0 | 1.5 | 1118 | $1,900 | $1.70 | 24d | 1 | 1.03mi |
| 127 E 46th St Kansas City, MO | 2.0 | 1.0 | 1300 | $1,295 | $1.00 | 4d | 1 | 1.04mi |
| 4116 Bellefontaine Ave Kansas City, MO | 3.0 | 1.0 | 1234 | $1,000 | $0.81 | 24d | 1 | 1.06mi |
| 4116 Walnut St Kansas City, MO | 2.0 | 2.0 | 1367 | $1,950 | $1.43 | 44d | 1 | 1.06mi |
| 5241 Brookwood Ave Kansas City, MO | 3.0 | 2.0 | 1431 | $1,550 | $1.08 | 44d | 1 | 1.07mi |
Listing history 11 events
-
2026-05-07price $140,000 835-char remark
Show marketing remark (835 chars)
Opportunity knocks! This spacious 4-bedroom, 2-bath home is a true fixer-upper with strong potential for the right buyer. Featuring a classic front porch, stone exterior accents, and a traditional layout, this property is ready for a full transformation. Inside, you’ll find generous room sizes, multiple bedrooms, and the opportunity to reimagine the space from top to bottom. Whether you’re an investor looking for your next renovation project or a homeowner ready to build sweat equity, this home offers the canvas to create something special. Situated on an elevated lot with established neighboring homes, the property provides solid bones and a footprint that supports modern updates. Bring your contractor, your creativity, and your vision—this one is priced with condition in mind and ready for a fresh start.
-
2026-04-18$150,000 Active 835-char remark
Show marketing remark (835 chars)
Opportunity knocks! This spacious 4-bedroom, 2-bath home is a true fixer-upper with strong potential for the right buyer. Featuring a classic front porch, stone exterior accents, and a traditional layout, this property is ready for a full transformation. Inside, you’ll find generous room sizes, multiple bedrooms, and the opportunity to reimagine the space from top to bottom. Whether you’re an investor looking for your next renovation project or a homeowner ready to build sweat equity, this home offers the canvas to create something special. Situated on an elevated lot with established neighboring homes, the property provides solid bones and a footprint that supports modern updates. Bring your contractor, your creativity, and your vision—this one is priced with condition in mind and ready for a fresh start.
-
2025-12-29historical $150,000 835-char remark
Show marketing remark (835 chars)
Opportunity knocks! This spacious 4-bedroom, 2-bath home is a true fixer-upper with strong potential for the right buyer. Featuring a classic front porch, stone exterior accents, and a traditional layout, this property is ready for a full transformation. Inside, you’ll find generous room sizes, multiple bedrooms, and the opportunity to reimagine the space from top to bottom. Whether you’re an investor looking for your next renovation project or a homeowner ready to build sweat equity, this home offers the canvas to create something special. Situated on an elevated lot with established neighboring homes, the property provides solid bones and a footprint that supports modern updates. Bring your contractor, your creativity, and your vision—this one is priced with condition in mind and ready for a fresh start.
-
2023-12-19historical $950
-
2023-11-28price $950
-
2023-10-20price $1,400
-
2023-09-03$1,495
-
2013-01-14soldstatus
-
2012-12-07historical
-
2012-08-16$25,000
-
2008-07-25soldstatus
ⓘ Source: listings_history table (triggers on properties + properties_extension) + one-shot
backfill from property_details.listing_events for pre-trigger history.
Tax reassessment forecast MO · Resets to sale price
- Current annual tax
- $822 · $68/mo
- Projected year-2 tax
- $1,358 · $113/mo
- Expected delta
- +$536/yr (+$45/mo · 65.2%)
ⓘ Screening estimate from a state-policy table — verify with the county assessor before closing.
Climate risk First Street
- Flood 1/10 Low FEMA zone X (unshaded) · 0% chance over 30 yrs
- Wildfire 1/10 Low
- Heat 4/10 Moderate 7 d/yr ≥106°F today · 17 d/yr by 30 yrs out
- Wind 2/10 Low
- Air quality 3/10 Moderate 2 unhealthy d/yr today · 4 by 30 yrs out
Nearby sold comps map
Loading sold comps map…
Walkable amenities ~0.75 mi
Loading nearby amenities…
Taxation est. · year 1
- Rental income
- $21,276
- − Mortgage interest
- −$7,842
- − Property taxes
- −$822
- − Insurance
- −$700
- − Repairs & maintenance
- −$1,702
- − Management
- −$1,702
- − Depreciation
- −$4,073
- Taxable income
- $4,435
- Est. tax owed @ 24.0%
- −$1,064
- After-tax cash flow
- $5,412/yr
For passive investors: Depreciation is non-cash, so a rental often shows a tax loss while cash-flowing — sheltering income. Rental losses are passive: they offset passive income freely, and up to $25,000/yr can offset ordinary (W-2) income if you actively participate and your MAGI is under $100k (phasing out to $0 by $150k); unused losses carry forward. On sale, claimed depreciation is recaptured at up to 25%, and gains may owe capital-gains tax (a 1031 exchange can defer both). Figures are a year-1 estimate at your 24.0% rate — not tax advice; consult a CPA.
Schools (NCES district)
- District
- Kansas City 33
- NCES district ID
- 2916400
- Math proficiency
- 12% ▼ -8.00%
- Reading proficiency
- 24% ▬ 0.00%
- Median HH income
- $35,227
- Composite
- 14.8/100
- National rank
- #9387
- State rank
- #308 of 324 in MO
Livability — Kansas City
- Score
- 78/100
- State rank
- #28
- US rank
- #2671
Category grades
Schools grade is shown separately in the Schools card above.
Census & demographics
- Census place
- Kansas City, MO
- County
- Jackson County · 687,798 people
- City population
- 439,467
- Metro
- Kansas City, MO-KS
- Population (ZIP)
- 16,878
- Household income
- $63,044
- Rent vs Own
- Severe rent burden
- 962.0
Population outlook (Jackson County) Hauer SSP2
- Today (2025)
- 719,589 people
- By 2030
- 731,456 · +1.6%
- By 2040
- 746,689 · +3.8%
- By 2050
- 749,289 · +4.1%
- By 2075
- 736,227 · +2.3%
- By 2100
- 668,210 · -7.1%
Race, ethnicity, and origin ACS 2023
- Neighborhood character
- Diverse neighborhood (Simpson 0.63)
- Race & ethnicity
- White 49% Black 34% Two or more races 10% Hispanic / Latino 9% Asian 2%
- Hispanic origin (detail)
- Mexican 6%
- Common ancestry
- Romanian 2% Lithuanian 2% Italian 2%
- Foreign-born
- 4% · Canada
- Languages at home
- 92% English-only · Spanish 6% French/Haitian/Cajun 1% Other Indo-European 1%
Political lean MEDSL · Jackson
- 2024 margin
- D (+19.3) · D 58.9% · R 39.5% · Other 1.6%
- 2008→2024 swing
- -6.1pp toward R · 2008: 25.4pp · 2024: 19.3pp
- All cycles
- 2024: D+19.3 2020: D+22.0 2016: D+16.6 2012: D+19.0 2008: D+25.4
Not yet ingested
- Civics
- —
Market trends
- HPI YoY
- ▼ -514.37%
- Current HPI
- 371.8501
- Rent YoY
- ▲ 3.95%
- Metro
- Kansas City, MO-KS
- State GDP YoY
- ▲ 1.84%
- F500 in state
- 20
Industry mix (Fortune 500 HQ in MO)
| Industry | F500 HQs | Revenue |
|---|---|---|
| Healthcare | 1 | $163B |
|
||
| Insurance | 1 | $21B |
|
||
| Industrial Technology | 1 | $17B |
|
||
| Retail | 1 | $16B |
|
||
| Industrial Distribution | 1 | $10B |
|
||
| Utilities | 1 | $9B |
|
||
Price history
+460.0% since first listed11 events — show timeline
- 2026-05-07 Price Changed $140,000 Heartland MLS as Distributed by MLS Grid
- 2026-04-18 Listed $150,000 Heartland MLS as Distributed by MLS Grid
- 2025-12-29 Coming Soon $150,000 Heartland MLS as Distributed by MLS Grid
- 2023-12-19 Rental Removed $950 PROPERTYWARE
- 2023-11-28 Price Changed $950 PROPERTYWARE
- 2023-10-20 Price Changed $1,400 PROPERTYWARE
- 2023-09-03 Listed for Rent $1,495 PROPERTYWARE
- 2013-01-14 Sold (Public Records) — Public Records
- 2012-12-07 Listing Removed — Heartland MLS as Distributed by MLS Grid
- 2012-08-16 Listed $25,000 Heartland MLS as Distributed by MLS Grid
- 2008-07-25 Sold (Public Records) — Public Records
Property tax history
+6.3%/yrLatest (2025): $822 · -45.7% YoY. Source: county tax records.
Cash-flow waterfall
monthlySold comps — $/sqft
last 12 mo · ≤1 miLoading sold comps…