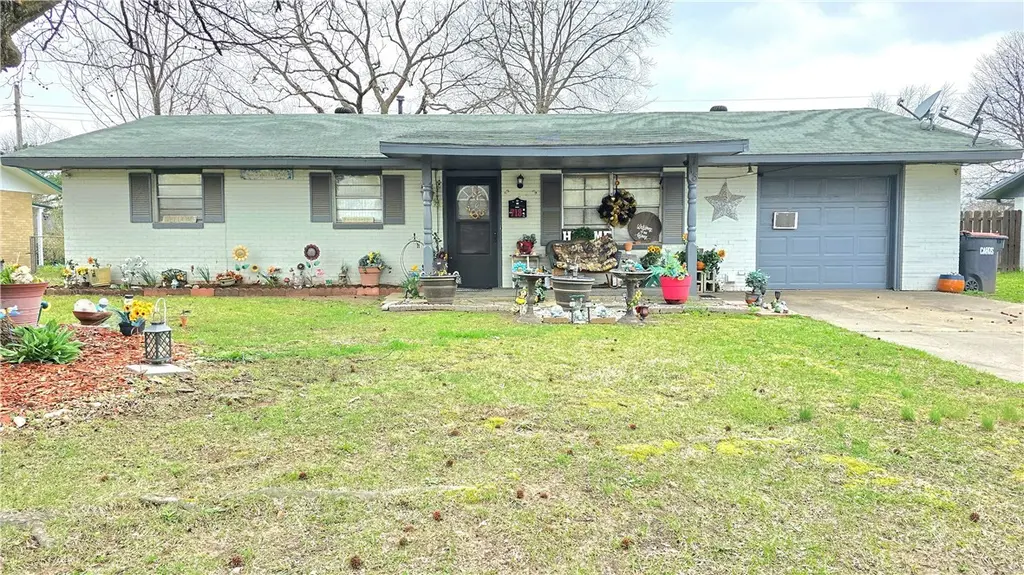
718 Morrison Pl · Springdale, AR
Flood risk 1/10 · Minimal
- FEMA flood zone
- X (unshaded)
- Chance of flooding over 30 yrs
- 0.0%
- Est. flood insurance / yr
- $507 – $1,088
Fire risk 4/10 · Minor
- Est. fire insurance / yr
- $1,499 – $2,785
Heat risk 5/10 · Moderate
- Hot days now (above 104°F)
- 7 days/yr
- Hot days in 30 yrs
- 20 days/yr
Wind risk 2/10 · Minimal
- Chance of severe wind over 30 yrs
- 2.0%
Air-quality risk 1/10 · Minimal
- Unhealthy air days now
- 0 days/yr
- Unhealthy air days in 30 yrs
- 0 days/yr
Risk factors via First Street. Map © Google.
Why this score? — see what drove the C- grade
The composite is a weighted blend of 9 inputs, each scored 0–100. Each bar is that input's sub-score; the figure is the points it added to the 100-point composite (weight × sub-score).
- Cash flow +17.8/30.0
- ARV discount +13.3/15.0
- DSCR +5.6/10.0
- 1% rule +3.8/10.0
- Livability +3.5/5.0
- Rent growth +3.2/5.0
- Schools +3.1/10.0
- Condition / age +2.5/5.0
- Appreciation +0.0/10.0
$234,900
🖨 Deal sheet (PDF) 📄 Offer letter ✓ Due diligence
Listing remarks MLS
Looking for space, comfort, and convenience? This inviting 4-bedroom home offers 1,473 sq. ft. of living space in a great location. Step inside to find tile flooring throughout, making maintenance easy and giving the home a clean feel. The kitchen provides plenty of storage, while the bedrooms offer flexibility for family, guests, or a home office. Start your mornings on the covered front porch and unwind in the evenings on the large covered back patio—perfect for rainy days or beautiful sunsets. Conveniently located just minutes from Interstate 49, schools, shopping, and JB Hunt Park, this home offers easy access to everything you need. Opportunities like this don’t last long—schedule your private showing today! Home is being sold AS IS.
Key facts
- Covered front porch
- Tile flooring
- 9,474 sq ft lot
Tags
Neighborhood map
What this means for you Summary
Snapshot
- This is a 4-bed/1.0-bath single-family listed at $235k.
Deal economics
- At list price, monthly cash flow is $194 ($2k/yr) — positive.
- The deal already cash-flows at list — no discount required.
- To meet the 1% rule (rent ≥ 1% of price), the offer needs to be $207k (11.8% below list).
- Recommended offer: $207k (11.8% below list) — sets the bar for 1% rule.
- Cap rate 7.3% vs local median 3.2% in Springdale — top-decile yield for the area; either an underpriced asset or a hidden risk that comps aren't pricing in. Stress-test before assuming the spread holds.
Location & tenants
- Location reads 70/100 on livability (#48 in AR) — a middle-class / working-renter tenant base. Strengths: cost of living A+, housing A+, health & safety A+; Watch: commute D+, employment D+, crime D-.
- Springdale School District (urban): math 38% / reading 35% proficiency, ranked #100 of 238 in AR (top 42%) — families likely to look elsewhere, expect single-tenant / working-renter base with shorter leases.
- Zoned schools: Elmdale Elementary School (math 38% / reading 23%, grade F, #298 of 454 statewide, top 67%, 547 students, 88% FRL); Hellstern Middle School (math 57% / reading 56%, grade B, #17 of 201 statewide, top 8%, 781 students, 43% FRL); Har-Ber High School (math 25% / reading 41%, grade F, #115 of 292 statewide, top 40%, 2,274 students, 53% FRL) — zoned schools at 61% FRL track the district average.
- Market conditions: Rents rising (+2.7%/yr); 705 active listings in the ZIP; 6 comparable units currently listed for rent nearby; rentals at typical pace (median 25d on market — plan ~3-4 weeks tenant-placement turnaround); solid renter incomes; 3,494 units permitted in Washington County in 2024 (1,497 in 5+ unit buildings).
- This rent runs 30% of the median local income ($82k/yr) — at the standard rent-burdened threshold; future hikes will face affordability resistance.
Forward outlook
- Local home prices are declining (-3.0%/yr); year-one equity from $2k of loan paydown is wiped out by about $7k of value loss. Plan a longer hold.
- Washington County population projected at +47% by 2050 — long-run rental-demand tailwind backs the buy-and-hold thesis.
Negotiation context
- It's been on market 101 days — a 9% lower offer ($214k) is reasonable based on typical stale-listing flexibility.
- 2 sale attempts since 15y ago; this cycle's ask has dropped $20k (8%) from the opening price — seller is motivated, your offer sets the floor, not the list.
- Current owner paid $37k; list at $235k implies a 535% gain — meaningful room to come down on a strong offer.
Risks & watch-outs
- Climate carrying-cost: extreme-heat days projected 7→20/yr by 2055 (HVAC capex compounding) — expect insurance premiums to compound above CPI over the hold.
Questions for the listing agent
- It's been on market 101 days. Have you received any prior offers? Is the seller open to a 12% concession, seller financing, or rate buy-down credit?
- Built in 1965 — when were the roof, HVAC, electrical panel, plumbing, and water heater last replaced?
- Why hasn't it sold? Are there any deal-killer items the seller is aware of (foundation, flood, title, zoning, code violations)?
- Is there a deadline driving the sale (1031 exchange, divorce, estate, relocation)? That informs how much negotiation room exists.
- Schools are D-rated, which usually means shorter tenancies and higher turnover. Who's the typical renter profile here, and what's been the actual vacancy rate?
- Crime grade is D in this area — have there been break-ins, vandalism, or insurance claims at this property in the last 3 years? What carrier currently insures it and at what premium?
- What's the average days-on-market for RENTAL listings here right now (not sales)? A rising rental-DOM trend means longer vacancies and softer asking-rent achievability than the comps imply.
- What's the recent tenant-quality profile in this submarket — average credit score on applications, eviction rate, late-payment / NSF rate, and stable-employment percentage? A property-management company in the area should have these aggregated.
- How much new for-sale + rental construction is in the pipeline within 1–3 miles? Heavy new supply typically softens prices + rents 12–24 months out; constrained supply supports both.
Investment metrics
- 1% rule
- 0.88% ✗
- Cap rate
- 7.28%
- Cash-on-cash
- 3.54%
- DSCR
- 1.16
- GRM
- 9.4
CMA / ARV
- ARV (median comp)
- $269,975
- List price
- $234,900
- Delta
- -12.99%
- Verdict
- UNDERPRICED
- Comps
- 20 within 1.0 mi
Show comp detail 12 sales within ~0.75 mi
| Address | Dist | Beds/Ba | Sqft | Sold | Price | $/sf | Match |
|---|---|---|---|---|---|---|---|
| 1713 Shelby Ave | 0.33mi | 3/1.0 (-1) | 1,511 (+3%) | 2mo | $245,000 | $162 | 74 |
| 1809 Taylor Ave | 0.32mi | 3/1.5 (-1) | 1,428 (-3%) | 6mo | $245,000 | $172 | 68 |
| 811 Hinshaw Dr | 0.12mi | 3/2.0 (-1) | 1,328 (-10%) | 5mo | $264,950 | $200 | 65 |
| 1706 Lawrence Ave | 0.30mi | 3/2.0 (-1) | 1,587 (+8%) | 0mo | $286,000 | $180 | 64 |
| 706 Buford St | 0.33mi | 3/2.0 (-1) | 1,316 (-11%) | 1mo | $289,000 | $220 | 57 |
| 1115 Cheyenne Trl | 0.49mi | 3/2.0 (-1) | 1,363 (-8%) | 3mo | $265,000 | $194 | 53 |
| 1138 N West End St | 0.55mi | 4/2.0 | 1,320 (-10%) | 1mo | $271,000 | $205 | 52 |
| 1409 N Crawford Ave | 0.53mi | 3/1.0 (-1) | 1,360 (-8%) | 7mo | $218,000 | $160 | 52 |
| 659 Westbury St | 0.69mi | 4/2.0 | 1,605 (+9%) | 1mo | $348,500 | $217 | 48 |
| 1409 Backus Ave | 0.63mi | 3/1.0 (-1) | 1,660 (+13%) | 1mo | $175,000 | $105 | 44 |
| 1708 Theodore Dr | 0.56mi | 3/2.0 (-1) | 1,661 (+13%) | 8mo | $239,000 | $144 | 37 |
| 746 Westbury St | 0.70mi | 3/2.0 (-1) | 1,650 (+12%) | 7mo | $350,000 | $212 | 33 |
Match score weights: distance 35% · size 25% · config 20% · recency 20%. Top-matched comps best support the ARV.
Projected returns pro-forma
-3.0% appreciation · 2.7% rent growth · sell at horizon
- IRR
- -11.1%
- Equity multiple
- 0.60×
- Total profit
- $-26,413
- Equity at exit
- $35,024
- IRR
- -2.3%
- Equity multiple
- 0.85×
- Total profit
- $-9,958
- Equity at exit
- $20,310
Cash invested: $65,772 (down + closing). Projections, not guarantees.
Landlord ↔ Tenant lean methodology
- Overall (STATE)
- 92 Strongly Landlord-Friendly
- State Arkansas
- 92 Strongly Landlord-Friendly · R+14
- County
- — inherits STATE
- City
- — inherits STATE
ZIP-level market 72762
- Rents YoY
- 2.7%
- Active inventory
- 705
- Price-to-rent
- 9.4×
Monthly cashflow live
- Estimated rent
- $2,072 high interval (Pro) →
- Mortgage (P&I)
- −$1,232
- Tax from tax record
- −$113 /mo · $1,359/yr
- Insurance
- −$98
- HOA
- −$0
- Vacancy / Maint / Mgmt
- −$435
- Net cashflow
- $194
Break-even live
Sensitivity live
| Price | -10% $327 | -5% $260 | +0% $194 | +5% $127 | +10% $61 |
|---|---|---|---|---|---|
| Rent | -10% $30 | -5% $112 | +0% $194 | +5% $276 | +10% $358 |
| Rate | -1.0pp $312 | -0.5pp $254 | base $194 | +0.5pp $133 | +1.0pp $71 |
UW: 25.0% down · 7.5% · 30yr · 1.5% tax · 5.0% vac · 8.0% maint · 8.0% mgmt
Financing live
Cash to close
- Down payment
- $58,725
- Closing costs
- $7,047
- Reserves months
- —
- Total cash needed
- —
Loan-product check · same deal, 3 products live
Conventional
25% down · 7.5% · 30yr
- Down + closing
- —
- Monthly P&I
- —
- Monthly cashflow
- —
- DSCR
- —
- Eligible?
- —
Personal DTI + credit; lowest rate.
DSCR
20% down · 8.5% · 30yr
- Down + closing
- —
- Monthly P&I
- —
- Monthly cashflow
- —
- DSCR
- —
- Eligible?
- —
No personal income docs; deal must DSCR.
Hard money
10% down · 12.0% · 12mo
- Down + closing
- —
- Monthly P&I
- —
- Monthly cashflow
- —
- DSCR
- —
- Eligible?
- —
Short-term bridge; refi at stabilization.
Rent comps 6 comps
| Address | Beds | Baths | Sqft | Rent | $/sqft | DOM | Units | Dist |
|---|---|---|---|---|---|---|---|---|
| 1707 Phillips Dr Springdale, AR | 3.0 | 2.0 | 1519 | $1,745 | $1.15 | 25d | 1 | 0.45mi |
| 3006 Scott Ln Springdale, AR | 3.0 | 2.0 | 1736 | $2,100 | $1.21 | 25d | 1 | 0.61mi |
| 574 Westford St Springdale, AR | 3.0 | 2.0 | 1656 | $1,850 | $1.12 | 45d | 1 | 0.84mi |
| 303 Harve St Springdale, AR | 3.0 | 1.0 | 1312 | $1,550 | $1.18 | 25d | 1 | 0.93mi |
| 1760 Pine Woods Rd Springdale, AR | 3.0 | 1.0 | 960 | $2,000 | $2.08 | 25d | 1 | 1.34mi |
| 1489 Bridgeboro Ave Springdale, AR | 4.0 | 2.0 | 1738 | $2,150 | $1.24 | 45d | 1 | 1.36mi |
Listing history 24 events
-
2026-06-22days on market $234,900 Active 101 DOM
-
2026-06-18days on market $234,900 Active 98 DOM
-
2026-06-17days on market $234,900 Active 97 DOM
-
2026-06-16days on market $234,900 Active 96 DOM
-
2026-06-15days on market $234,900 Active 95 DOM
-
2026-06-14days on market $234,900 Active 93 DOM
-
2026-06-10days on market $234,900 Active 90 DOM
-
2026-06-09days on market $234,900 Active 89 DOM
-
2026-06-08days on market $234,900 Active 88 DOM
-
2026-06-07days on market $234,900 Active 87 DOM
-
2026-06-05days on market $234,900 Active 84 DOM
-
2026-06-03days on market $234,900 Active 83 DOM
-
2026-06-02days on market $234,900 Active 82 DOM
-
2026-06-01days on market $234,900 Active 81 DOM
-
2026-05-31days on market $234,900 Active 80 DOM
-
2026-05-31days on market $234,900 Active 79 DOM
-
2026-05-03price $234,900 766-char remark
Show marketing remark (766 chars)
Looking for space, comfort, and convenience? This inviting 4-bedroom home offers 1,473 sq. ft. of living space in a great location. Step inside to find tile flooring throughout, making maintenance easy and giving the home a clean feel. The kitchen provides plenty of storage, while the bedrooms offer flexibility for family, guests, or a home office. Start your mornings on the covered front porch and unwind in the evenings on the large covered back patio—perfect for rainy days or beautiful sunsets. Conveniently located just minutes from Interstate 49, schools, shopping, and JB Hunt Park, this home offers easy access to everything you need. Opportunities like this don’t last long—schedule your private showing today! Home is being sold AS IS.
-
2026-03-12$254,999 Active 766-char remark
Show marketing remark (766 chars)
Looking for space, comfort, and convenience? This inviting 4-bedroom home offers 1,473 sq. ft. of living space in a great location. Step inside to find tile flooring throughout, making maintenance easy and giving the home a clean feel. The kitchen provides plenty of storage, while the bedrooms offer flexibility for family, guests, or a home office. Start your mornings on the covered front porch and unwind in the evenings on the large covered back patio—perfect for rainy days or beautiful sunsets. Conveniently located just minutes from Interstate 49, schools, shopping, and JB Hunt Park, this home offers easy access to everything you need. Opportunities like this don’t last long—schedule your private showing today! Home is being sold AS IS.
-
2012-03-08soldstatus $37,000 52-char remark
Show marketing remark (52 chars)
Good condition house, 3 bed, 1 bath, great location!
-
2011-02-09$37,800 52-char remark
Show marketing remark (52 chars)
Good condition house, 3 bed, 1 bath, great location!
-
2006-08-31soldstatus $112,000
-
2005-04-08soldstatus $97,000
-
2002-11-08soldstatus $81,000
-
1993-06-25soldstatus $51,000
ⓘ Source: listings_history table (triggers on properties + properties_extension) + one-shot
backfill from property_details.listing_events for pre-trigger history.
Tax reassessment forecast AR · Resets to sale price
- Current annual tax
- $1,359 · $113/mo
- Projected year-2 tax
- $1,503 · $125/mo
- Expected delta
- +$145/yr (+$12/mo · 10.7%)
ⓘ Screening estimate from a state-policy table — verify with the county assessor before closing.
Climate risk First Street
- Flood 1/10 Low FEMA zone X (unshaded) · 0% chance over 30 yrs
- Wildfire 4/10 Moderate
- Heat 5/10 Major 7 d/yr ≥104°F today · 20 d/yr by 30 yrs out
- Wind 2/10 Low 2% chance of damaging wind over 30 yrs
- Air quality 1/10 Low 0 unhealthy d/yr today · 0 by 30 yrs out
Nearby sold comps map
Loading sold comps map…
Walkable amenities ~0.75 mi
Loading nearby amenities…
Taxation est. · year 1
- Rental income
- $24,864
- − Mortgage interest
- −$13,158
- − Property taxes
- −$1,359
- − Insurance
- −$1,174
- − Repairs & maintenance
- −$1,989
- − Management
- −$1,989
- − Depreciation
- −$6,833
- Taxable loss
- −$1,639
- Est. tax savings @ 24.0%
- +$393
- After-tax cash flow
- $2,721/yr
For passive investors: Depreciation is non-cash, so a rental often shows a tax loss while cash-flowing — sheltering income. Rental losses are passive: they offset passive income freely, and up to $25,000/yr can offset ordinary (W-2) income if you actively participate and your MAGI is under $100k (phasing out to $0 by $150k); unused losses carry forward. On sale, claimed depreciation is recaptured at up to 25%, and gains may owe capital-gains tax (a 1031 exchange can defer both). Figures are a year-1 estimate at your 24.0% rate — not tax advice; consult a CPA.
Schools (NCES district)
- District
- Springdale School District
- NCES district ID
- 0512660
- Math proficiency
- 38% ▼ -11.00%
- Reading proficiency
- 35% ▼ -6.00%
- Median HH income
- $45,469
- Composite
- 31.18/100
- National rank
- #6046
- State rank
- #100 of 238 in AR
Livability — Springdale
- Score
- 70/100
- State rank
- #48
- US rank
- #7326
Category grades
Schools grade is shown separately in the Schools card above.
Census & demographics
- Census place
- Springdale, AR
- County
- Washington County · 252,056 people
- City population
- 104,811
- Metro
- Fayetteville-Springdale-Rogers, AR
- Population (ZIP)
- 46,092
- Household income
- $82,228
- Rent vs Own
- Severe rent burden
- 719.0
Population outlook (Washington County) Hauer SSP2
- Today (2025)
- 271,748 people
- By 2030
- 296,414 · +9.1%
- By 2040
- 346,874 · +27.6%
- By 2050
- 398,552 · +46.7%
- By 2075
- 523,309 · +92.6%
- By 2100
- 615,280 · +126.4%
Race, ethnicity, and origin ACS 2023
- Neighborhood character
- Diverse neighborhood (Simpson 0.62)
- Race & ethnicity
- White 55% Hispanic / Latino 27% Two or more races 23% Pacific Islander 3% Asian 2% Black 1%
- Hispanic origin (detail)
- Mexican 21%
- Common ancestry
- Italian 3% Slovak 2% Lithuanian 1%
- Foreign-born
- 15% · Canada, Jamaica
- Languages at home
- 75% English-only · Spanish 21% Other Asian/Pacific 3%
Political lean MEDSL · Washington
- 2024 margin
- Lean R (+6.7) · D 45.1% · R 51.7% · Other 3.2%
- 2008→2024 swing
- +6.4pp toward D · 2008: -13.1pp · 2024: -6.7pp
- All cycles
- 2024: R+6.7 2020: R+3.9 2016: R+10.4 2012: R+16.3 2008: R+13.1
Not yet ingested
- Civics
- —
Market trends
- HPI YoY
- ▼ -258.50%
- Current HPI
- 291.4661
- Rent YoY
- ▲ 2.70%
- Metro
- Fayetteville-Springdale-Rogers, AR
- State GDP YoY
- ▲ 3.80%
- F500 in state
- 10
Industry mix (Fortune 500 HQ in AR)
| Industry | F500 HQs | Revenue |
|---|---|---|
| Retail | 1 | $681B |
|
||
| Food / Agriculture | 1 | $53B |
|
||
| Retail / Energy | 1 | $22B |
|
||
| Transportation / Logistics | 1 | $12B |
|
||
| Energy | 1 | $4B |
|
||
Price history
+360.6% since first listed8 events — show timeline
- 2026-05-03 Price Changed $234,900 NWARMLS
- 2026-03-12 Listed $254,999 NWARMLS
- 2012-03-08 Sold (MLS) $37,000 NWARMLS
- 2011-02-09 Listed $37,800 NWARMLS
- 2006-08-31 Sold (Public Records) $112,000 Public Records
- 2005-04-08 Sold (Public Records) $97,000 Public Records
- 2002-11-08 Sold (Public Records) $81,000 Public Records
- 1993-06-25 Sold (Public Records) $51,000 Public Records
Property tax history
+2.9%/yrLatest (2025): $1,359 · -6.6% YoY. Source: county tax records.
Cash-flow waterfall
monthlySold comps — $/sqft
last 12 mo · ≤1 miLoading sold comps…