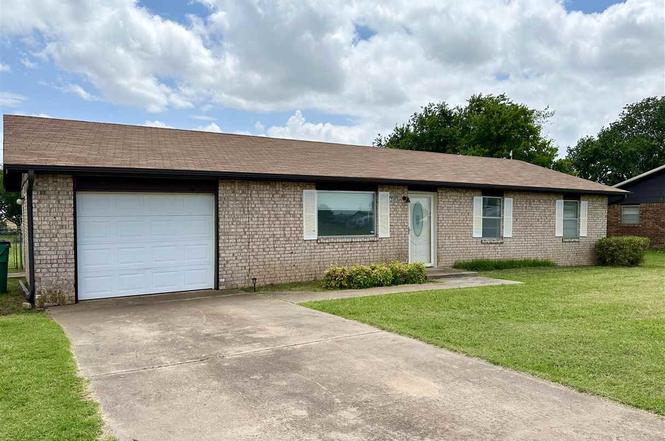
209 E Lake Dr · Temple, OK
Flood risk 1/10 · Minimal
- FEMA flood zone
- X
- Chance of flooding over 30 yrs
- 0.0%
- Est. flood insurance / yr
- $507 – $1,088
Fire risk 5/10 · Moderate
- Est. fire insurance / yr
- $2,463 – $4,575
Heat risk 7/10 · Major
- Hot days now (above 110°F)
- 7 days/yr
- Hot days in 30 yrs
- 20 days/yr
Wind risk 3/10 · Minor
- Chance of severe wind over 30 yrs
- 9.0%
Air-quality risk 2/10 · Minimal
- Unhealthy air days now
- 0 days/yr
- Unhealthy air days in 30 yrs
- 1 days/yr
Risk factors via First Street. Map © Google.
Why this score? — see what drove the A- grade
The composite is a weighted blend of 9 inputs, each scored 0–100. Each bar is that input's sub-score; the figure is the points it added to the 100-point composite (weight × sub-score).
- Cash flow +30.0/30.0
- ARV discount +15.0/15.0
- 1% rule +10.0/10.0
- DSCR +10.0/10.0
- Appreciation +6.5/10.0
- Rent growth +2.5/5.0
- Livability +2.5/5.0
- Condition / age +2.5/5.0
- Schools +2.2/10.0
$58,900
🖨 Deal sheet 📄 Offer letter ✓ Due diligence
Listing remarks
Come out and take a look at this quaint home in Temple, OK! If you are looking to get away from the rush and traffic of big cities, then this home might be right for you. This 3 bedroom, 1 bathroom home offers 1,272 square feet of cozy living space, a spacious fenced in backyard, and just a short walk away to the public school! Home is being sold as is. Call James Shea at (580) 512-7501 to schedule a showing today. Price has been adjusted to reflect the needed foundation repair per foundation contractor quotes.
Key facts
- 0.25 acre lot
- Garage
- Built 1973
Tags
Property features AI
Exterior
- Parking: Detached garage with 1 covered parking space (1 total parking space)
- Utilities: Public water; Public sewer; Propane service
- Home design: Single-family residence; One level
- Construction: Brick veneer construction; Slab foundation; Built with composition roofing
- Exterior features: Chain link fence; Composition roof; Public maintained road frontage on a city street; Lot dimensions approximately 120 x 90 (about 0.25 acre)
Interior
- Flooring: Carpet
- Bathrooms: 1 full bathroom
- Heating & cooling: Central heating (electric); Central air conditioning; Ceiling fans
- Interior features: Electric water heater; No fireplace
- Laundry & utility: Washer hookup
Neighborhood map
What this means for you Summary
Snapshot
- This is a 3-bed/1.0-bath single-family listed at $59k.
Deal economics
- At list price, monthly cash flow is $454 ($5k/yr) — positive.
- The deal already cash-flows at list — no discount required.
- Meets the 1% rule at list price ($1k rent vs $59k).
- Recommended offer: $52k (12.0% below list) — sets the bar for market timing.
Location & tenants
- Location reads 49/100 on livability (#683 in OK) — a working-class tenant base; expect higher turnover. Strengths: cost of living A+; Watch: schools D-, crime F, amenities F.
- Temple (rural): math 25% / reading 20% proficiency, ranked #384 of 513 in OK (top 75%) — low school quality limits family demand, transient renter base, plan for 1-2y turnover; 67% free/reduced lunch — lower-income household profile, screen leases tightly.
- Market conditions: 2 active listings in the ZIP.
Forward outlook
- In year one you build about $2k of equity ($407 loan paydown + $2k appreciation (3.1% local appreciation)).
- Cotton County population projected to shrink 5% by 2050 — rents likely to lag national; underwrite the cash flow, not the appreciation.
- At projected returns (3.1% appreciation + 3.0% rent growth), your $16k cash investment doubles in ~3 years — after that, you're playing with house money.
Negotiation context
- It's been on market 147 days — a 12% lower offer ($52k) is reasonable based on typical stale-listing flexibility.
- 3 sale attempts; this cycle's ask has dropped $11k (16%) from the opening price — seller is motivated, your offer sets the floor, not the list.
Risks & watch-outs
- Climate carrying-cost: moderate wildfire risk; extreme-heat days projected 7→20/yr by 2055 (HVAC capex compounding) — expect insurance premiums to compound above CPI over the hold.
Questions for the listing agent
- It's been on market 147 days. Have you received any prior offers? Is the seller open to a 12% concession, seller financing, or rate buy-down credit?
- Built in 1973 — when were the roof, HVAC, electrical panel, plumbing, and water heater last replaced?
- Why hasn't it sold? Are there any deal-killer items the seller is aware of (foundation, flood, title, zoning, code violations)?
- Is there a deadline driving the sale (1031 exchange, divorce, estate, relocation)? That informs how much negotiation room exists.
- Schools are D-rated, which usually means shorter tenancies and higher turnover. Who's the typical renter profile here, and what's been the actual vacancy rate?
- Crime grade is F in this area — have there been break-ins, vandalism, or insurance claims at this property in the last 3 years? What carrier currently insures it and at what premium?
- What's the average days-on-market for RENTAL listings here right now (not sales)? A rising rental-DOM trend means longer vacancies and softer asking-rent achievability than the comps imply.
- What's the recent tenant-quality profile in this submarket — average credit score on applications, eviction rate, late-payment / NSF rate, and stable-employment percentage? A property-management company in the area should have these aggregated.
- How much new for-sale + rental construction is in the pipeline within 1–3 miles? Heavy new supply typically softens prices + rents 12–24 months out; constrained supply supports both.
Investment metrics
- 1% rule
- 1.77% ✓
- Cap rate
- 15.53%
- Cash-on-cash
- 33.00%
- DSCR
- 2.47
- GRM
- 4.7
CMA / ARV
- ARV (on-the-fly)
- $72,504
- Comps found
- 1
Show comp detail 1 sale within ~0.75 mi
| Address | Dist | Beds/Ba | Sqft | Sold | Price | $/sf | Match |
|---|---|---|---|---|---|---|---|
| 900 SE Boundary St | 0.46mi | 3/1.5 | 1,400 (+10%) | 14mo | $80,000 | $57 | 48 |
Match score weights: distance 35% · size 25% · config 20% · recency 20%. Top-matched comps best support the ARV.
Projected returns pro-forma
3.09% appreciation · 3.0% rent growth · sell at horizon
- IRR
- 38.9%
- Equity multiple
- 3.20×
- Total profit
- $36,249
- Equity at exit
- $26,775
- IRR
- 38.8%
- Equity multiple
- 6.35×
- Total profit
- $88,221
- Equity at exit
- $41,490
Cash invested: $16,492 (down + closing). Projections, not guarantees.
Landlord ↔ Tenant lean methodology
- Overall (STATE)
- 83 Strongly Landlord-Friendly
- State Oklahoma
- 83 Strongly Landlord-Friendly · R+20
- County
- — inherits STATE
- City
- — inherits STATE
ZIP-level market 73568
- Home prices YoY
- 2.5%
- Active inventory
- 2
- Price-to-rent
- 4.7×
Monthly cashflow live
- Estimated rent
- $1,043 medium interval (Pro) →
- Mortgage (P&I)
- −$309
- Tax from tax record
- −$37 /mo · $447/yr
- Insurance
- −$25
- HOA
- −$0
- Vacancy / Maint / Mgmt
- −$219
- Net cashflow
- $454
Break-even live
UW: 25.0% down · 7.5% · 30yr · 1.5% tax · 5.0% vac · 8.0% maint · 8.0% mgmt
Financing live
Cash to close
- Down payment
- $14,725
- Closing costs
- $1,767
- Reserves months
- —
- Total cash needed
- —
Loan-product check · same deal, 3 products live
Conventional
25% down · 7.5% · 30yr
- Down + closing
- —
- Monthly P&I
- —
- Monthly cashflow
- —
- DSCR
- —
- Eligible?
- —
Personal DTI + credit; lowest rate.
DSCR
20% down · 8.5% · 30yr
- Down + closing
- —
- Monthly P&I
- —
- Monthly cashflow
- —
- DSCR
- —
- Eligible?
- —
No personal income docs; deal must DSCR.
Hard money
10% down · 12.0% · 12mo
- Down + closing
- —
- Monthly P&I
- —
- Monthly cashflow
- —
- DSCR
- —
- Eligible?
- —
Short-term bridge; refi at stabilization.
Listing history 20 events
-
2026-06-18days on market $58,900 Active 147 DOM
-
2026-06-17days on market $58,900 Active 146 DOM
-
2026-06-16days on market $58,900 Active 145 DOM
-
2026-06-15days on market $58,900 Active 144 DOM
-
2026-06-13days on market $58,900 Active 142 DOM
-
2026-06-12days on market $58,900 Active 141 DOM
-
2026-06-09days on market $58,900 Active 138 DOM
-
2026-06-08days on market $58,900 Active 137 DOM
-
2026-06-08days on market $58,900 Active 136 DOM
-
2026-06-05days on market $58,900 Active 134 DOM
-
2026-06-04days on market $58,900 Active 132 DOM
-
2026-06-02days on market $58,900 Active 131 DOM
-
2026-06-01days on market $58,900 Active 130 DOM
-
2026-05-31days on market $58,900 Active 129 DOM
-
2026-04-15price $58,900
-
2026-01-21$69,900 Active
-
2025-07-17price $69,900
-
2025-06-17status Active
-
2025-06-13historical Active Under Contract
-
2025-06-03$79,900 Active
ⓘ Source: listings_history table (triggers on properties + properties_extension) + one-shot
backfill from property_details.listing_events for pre-trigger history.
Tax reassessment forecast OK · Resets to sale price
- Current annual tax
- $447 · $37/mo
- Projected year-2 tax
- $530 · $44/mo
- Expected delta
- +$83/yr (+$7/mo · 18.6%)
ⓘ Screening estimate from a state-policy table — verify with the county assessor before closing.
Climate risk First Street
- Flood 1/10 Low FEMA zone X · 0% chance over 30 yrs
- Wildfire 5/10 Major
- Heat 7/10 Severe 7 d/yr ≥110°F today · 20 d/yr by 30 yrs out
- Wind 3/10 Moderate 9% chance of damaging wind over 30 yrs
- Air quality 2/10 Low 0 unhealthy d/yr today · 1 by 30 yrs out
Nearby sold comps map
Loading sold comps map…
Walkable amenities ~0.75 mi
Loading nearby amenities…
Taxation est. · year 1
- Rental income
- $12,520
- − Mortgage interest
- −$3,299
- − Property taxes
- −$447
- − Insurance
- −$294
- − Repairs & maintenance
- −$1,002
- − Management
- −$1,002
- − Depreciation
- −$1,713
- Taxable income
- $4,762
- Est. tax owed @ 24.0%
- −$1,143
- After-tax cash flow
- $4,300/yr
For passive investors: Depreciation is non-cash, so a rental often shows a tax loss while cash-flowing — sheltering income. Rental losses are passive: they offset passive income freely, and up to $25,000/yr can offset ordinary (W-2) income if you actively participate and your MAGI is under $100k (phasing out to $0 by $150k); unused losses carry forward. On sale, claimed depreciation is recaptured at up to 25%, and gains may owe capital-gains tax (a 1031 exchange can defer both). Figures are a year-1 estimate at your 24.0% rate — not tax advice; consult a CPA.
Schools (NCES district)
- District
- Temple
- NCES district ID
- 4029640
- Math proficiency
- 25% ▬ 0.00%
- Reading proficiency
- 20% ▼ -5.00%
- Median HH income
- $36,928
- Composite
- 21.89/100
- National rank
- #13561
- State rank
- #384 of 513 in OK
Livability — Temple
- Score
- 49/100
- State rank
- #683
- US rank
- #25948
Category grades
Schools grade is shown separately in the Schools card above.
Census & demographics
- Census place
- Temple, OK
- Population (ZIP)
- 931
Population outlook (Cotton County) Hauer SSP2
- Today (2025)
- 5,847 people
- By 2030
- 5,759 · -1.5%
- By 2040
- 5,619 · -3.9%
- By 2050
- 5,550 · -5.1%
- By 2075
- 5,839 · -0.1%
- By 2100
- 6,503 · +11.2%
Race, ethnicity, and origin ACS 2023
- Neighborhood character
- Predominantly White (81%)
- Race & ethnicity
- White 81% Hispanic / Latino 5% Two or more races 5% Black 5% Native American 3%
- Hispanic origin (detail)
- Mexican 5%
- Common ancestry
- Slovak 3% Iranian 2% Romanian 2%
- Foreign-born
- 1% · Canada
- Languages at home
- 96% English-only · Spanish 3% German/W. Germanic 1%
Political lean MEDSL · Cotton
- 2024 margin
- Solid R (+66.8) · D 15.6% · R 82.5% · Other 1.9%
- 2008→2024 swing
- -22.4pp toward R · 2008: -44.4pp · 2024: -66.8pp
- All cycles
- 2024: R+66.8 2020: R+67.0 2016: R+62.6 2012: R+46.4 2008: R+44.4
Not yet ingested
- Civics
- —
Market trends
- HPI YoY
- ▲ 3.09%
- Current HPI
- 127.537
- Rent YoY
- —
- Metro
- —
- State GDP YoY
- ▲ 1.55%
- F500 in state
- 6
Industry mix (Fortune 500 HQ in OK)
| Industry | F500 HQs | Revenue |
|---|---|---|
| Energy | 3 | $48B |
|
||
Price history
-26.3% since first listed6 events — show timeline
- 2026-04-15 Price Changed $58,900 LBRMLS
- 2026-01-21 Listed $69,900 LBRMLS
- 2025-07-17 Price Changed $69,900 LBRMLS
- 2025-06-17 Relisted — LBRMLS
- 2025-06-13 Contingent — LBRMLS
- 2025-06-03 Listed $79,900 LBRMLS
Property tax history
+2.6%/yrLatest (2025): $447 · +3.7% YoY. Source: county tax records.
Cash-flow waterfall
monthlySold comps — $/sqft
last 12 mo · ≤1 miLoading sold comps…