5819 Howard Ln · Punta Gorda, FL
Flood risk 6/10 · Moderate
- FEMA flood zone
- X (unshaded)
- Chance of flooding over 30 yrs
- 0.56%
- Est. flood insurance / yr
- $507 – $1,088
Fire risk 2/10 · Minimal
- Est. fire insurance / yr
- $947 – $1,759
Heat risk 10/10 · Severe
- Hot days now (above 108°F)
- 7 days/yr
- Hot days in 30 yrs
- 28 days/yr
Wind risk 10/10 · Severe
- Chance of severe wind over 30 yrs
- 99.0%
Air-quality risk 3/10 · Minor
- Unhealthy air days now
- 2 days/yr
- Unhealthy air days in 30 yrs
- 2 days/yr
Risk factors via First Street. Map © Google.
Why this score? — see what drove the B grade
The composite is a weighted blend of 9 inputs, each scored 0–100. Each bar is that input's sub-score; the figure is the points it added to the 100-point composite (weight × sub-score).
- Cash flow +30.0/30.0
- 1% rule +10.0/10.0
- DSCR +10.0/10.0
- ARV discount +7.5/15.0
- Schools +4.6/10.0
- Livability +3.8/5.0
- Rent growth +2.5/5.0
- Condition / age +2.5/5.0
- Appreciation +0.0/10.0
$100,000
🖨 Deal sheet 📄 Offer letter ✓ Due diligence
Listing remarks
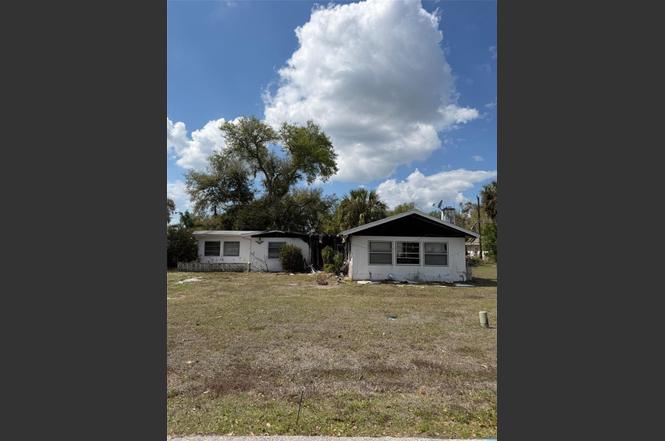
Attention investors, flippers, and builders—this is the value-add opportunity you’ve been waiting for. Situated on over ½ acre in Punta Gorda, this cash-only property offers incredible upside in a highly desirable and growing area. This 3-bedroom home has experienced partial fire damage (with additional smoke impact) and is being sold as-is, making it ideal for a full renovation, rebuild, or investment project. The structure offers a starting point, but the real value lies in the oversized lot, location, and flexibility. X Flood Zone – No flood insurance required. No HOA or CDD – bring your toys, boats, or RVs. Partially fenced yard already in place. Room to e
Key facts
- Over half an acre
- No cdd
- Ready for renovation
Tags
Property features AI
Finance
- Other: Homestead-exempt status; Property zoned RSF5; Total living area approximately 1,510 sq ft (public records); Building area total approximately 1,710 sq ft; Lot roughly 0.57 acres (about 50 x 100)
- HOA & community: No association required
Exterior
- Parking: Paved parking
- Utilities: Public water; Public sewer; Electricity available; Cable available; Broadband/high-speed internet available; Sewer connected; Water connected
- Home design: Single-family residence; Residential property in fixer condition; One-story; North-facing
- Construction: Frame construction; Shingle roof; Slab foundation; Built on one level
- Exterior features: Enclosed, screened rear porch; Rain gutters; Chain-link fence; Mature landscaping; Landscaped, level and oversized lot; Paved areas; Concrete road access
Interior
- Kitchen: Dishwasher; Microwave; Refrigerator
- Bedrooms: 3 bedrooms
- Flooring: Carpet; Tile
- Bathrooms: 1 full bathroom
- Heating & cooling: Central heating; Central air conditioning
- Interior features: Wood-burning fireplace; Inside utility room
- Laundry & utility: Inside laundry with electric dryer hookup
Neighborhood map
What this means for you Summary
Snapshot
- This is a 3-bed/1.0-bath single-family listed at $100k.
Deal economics
- At list price, monthly cash flow is $960 ($12k/yr) — positive.
- The deal already cash-flows at list — no discount required.
- Meets the 1% rule at list price ($2k rent vs $100k).
- Recommended offer: $91k (9.0% below list) — sets the bar for market timing.
- Cap rate 17.8% vs local median 2.8% in Punta Gorda — top-decile yield for the area; either an underpriced asset or a hidden risk that comps aren't pricing in. Stress-test before assuming the spread holds.
Location & tenants
- Location reads 76/100 on livability (#225 in FL, #3,567 nationally) — a middle-class / working-renter tenant base. Strengths: crime A+, health & safety A+, housing B; Watch: cost of living D+, amenities D-, commute F.
- Charlotte (suburban): math 54% / reading 54% proficiency, ranked #22 of 73 in FL (top 30%) — acceptable for families but not a draw, mixed tenant base, ~2y average lease.
- Zoned schools: East Elementary School (math 67% / reading 68%, grade B+, #435 of 2,144 statewide, top 21%, 761 students, 52% FRL); Port Charlotte High School (math 23% / reading 38%, grade F, #434 of 667 statewide, top 66%, 1,649 students, 43% FRL).
- Market conditions: Rents soft (-0.1%/yr); 999 active listings in the ZIP; 11 comparable units currently listed for rent nearby; rentals at typical pace (median 21d on market — plan ~3-4 weeks tenant-placement turnaround); solid renter incomes; 4,585 units permitted in Charlotte County in 2024 (703 in 5+ unit buildings).
- This rent runs 37% of the median local income ($76k/yr) — at the standard rent-burdened threshold; future hikes will face affordability resistance.
Forward outlook
- Local home prices are declining (-3.0%/yr); year-one equity from $691 of loan paydown is wiped out by about $3k of value loss. Plan a longer hold.
- Charlotte County population projected at +24% by 2050 — long-run rental-demand tailwind backs the buy-and-hold thesis.
- At projected returns (-3.0% appreciation + 0.0% rent growth), your $28k cash investment doubles in ~4 years — after that, you're playing with house money.
Negotiation context
- It's been on market 104 days — a 9% lower offer ($91k) is reasonable based on typical stale-listing flexibility.
- Current owner paid $35k; list at $100k implies a 186% gain — meaningful room to come down on a strong offer.
Risks & watch-outs
- Watch-outs: property tax is 3.9% of price; built in 1959 — expect roof / HVAC / electrical / plumbing capex.
- Climate carrying-cost: major flood risk; severe wind risk, 99% chance of damaging wind over 30y; extreme-heat days projected 7→28/yr by 2055 (HVAC capex compounding) — expect insurance premiums to compound above CPI over the hold.
Questions for the listing agent
- It's been on market 104 days. Have you received any prior offers? Is the seller open to a 9% concession, seller financing, or rate buy-down credit?
- Built in 1959 — when were the roof, HVAC, electrical panel, plumbing, and water heater last replaced?
- Property tax is high relative to price — has the assessment been appealed recently, and will the sale trigger a re-assessment?
- Why hasn't it sold? Are there any deal-killer items the seller is aware of (foundation, flood, title, zoning, code violations)?
- Is there a deadline driving the sale (1031 exchange, divorce, estate, relocation)? That informs how much negotiation room exists.
- Schools are A-rated — typically a magnet for longer-tenancy family renters. What's the average tenant stay here, and is there a school-zone premium baked into asking?
- What's the average days-on-market for RENTAL listings here right now (not sales)? A rising rental-DOM trend means longer vacancies and softer asking-rent achievability than the comps imply.
- What's the recent tenant-quality profile in this submarket — average credit score on applications, eviction rate, late-payment / NSF rate, and stable-employment percentage? A property-management company in the area should have these aggregated.
- How much new for-sale + rental construction is in the pipeline within 1–3 miles? Heavy new supply typically softens prices + rents 12–24 months out; constrained supply supports both.
Investment metrics
- 1% rule
- 2.35% ✓
- Cap rate
- 17.82%
- Cash-on-cash
- 41.15%
- DSCR
- 2.83
- GRM
- 3.5
CMA / ARV
- ARV (on-the-fly)
- $297,470
- Comps found
- 6
Show comp detail 6 sales within ~0.75 mi
| Address | Dist | Beds/Ba | Sqft | Sold | Price | $/sf | Match |
|---|---|---|---|---|---|---|---|
| 5910 Oakview Ln | 0.13mi | 3/2.0 | 1,416 (-6%) | 3mo | $195,000 | $138 | 77 |
| 26138 Stillwater Cir | 0.62mi | 3/2.0 | 1,675 (+11%) | 5mo | $275,000 | $164 | 45 |
| 9534 Turtle Grass Cir | 0.45mi | 3/2.0 | 1,672 (+11%) | 16mo | $328,999 | $197 | 44 |
| 9584 Turtle Grass Cir | 0.53mi | 3/2.0 | 1,672 (+11%) | 14mo | $322,999 | $193 | 42 |
| 9983 Bishop Creek Way | 0.57mi | 3/2.0 | 1,326 (-12%) | 22mo | $290,000 | $219 | 31 |
| 26276 Stillwater Cir | 0.61mi | 2/2.0 (-1) | 1,378 (-9%) | 21mo | $300,000 | $218 | 30 |
Match score weights: distance 35% · size 25% · config 20% · recency 20%. Top-matched comps best support the ARV.
Projected returns pro-forma
-3.0% appreciation · 0.0% rent growth · sell at horizon
- IRR
- 33.9%
- Equity multiple
- 2.37×
- Total profit
- $38,232
- Equity at exit
- $14,910
- IRR
- 39.0%
- Equity multiple
- 4.08×
- Total profit
- $86,104
- Equity at exit
- $8,646
Cash invested: $28,000 (down + closing). Projections, not guarantees.
Landlord ↔ Tenant lean methodology
- Overall (STATE)
- 87 Strongly Landlord-Friendly
- State Florida
- 87 Strongly Landlord-Friendly · R+3
- County
- — inherits STATE
- City
- — inherits STATE
ZIP-level market 33950
- Home prices YoY
- -29.9%
- Rents YoY
- -0.1%
- Active inventory
- 999
- Price-to-rent
- 3.5×
Monthly cashflow live
- Estimated rent
- $2,348 high interval (Pro) →
- Mortgage (P&I)
- −$524
- Tax from tax record
- −$328 /mo · $3,939/yr
- Insurance
- −$42
- HOA
- −$0
- Vacancy / Maint / Mgmt
- −$493
- Net cashflow
- $960
Break-even live
UW: 25.0% down · 7.5% · 30yr · 1.5% tax · 5.0% vac · 8.0% maint · 8.0% mgmt
Financing live
Cash to close
- Down payment
- $25,000
- Closing costs
- $3,000
- Reserves months
- —
- Total cash needed
- —
Loan-product check · same deal, 3 products live
Conventional
25% down · 7.5% · 30yr
- Down + closing
- —
- Monthly P&I
- —
- Monthly cashflow
- —
- DSCR
- —
- Eligible?
- —
Personal DTI + credit; lowest rate.
DSCR
20% down · 8.5% · 30yr
- Down + closing
- —
- Monthly P&I
- —
- Monthly cashflow
- —
- DSCR
- —
- Eligible?
- —
No personal income docs; deal must DSCR.
Hard money
10% down · 12.0% · 12mo
- Down + closing
- —
- Monthly P&I
- —
- Monthly cashflow
- —
- DSCR
- —
- Eligible?
- —
Short-term bridge; refi at stabilization.
Rent comps 11 comps
| Address | Beds | Baths | Sqft | Rent | $/sqft | DOM | Units | Dist |
|---|---|---|---|---|---|---|---|---|
| 9489 Turtle Grass Cir Punta Gorda, FL | 4.0 | 2.0 | 1828 | $2,500 | $1.37 | 13d | 1 | 0.42mi |
| 9975 Bishop Creek Way Punta Gorda, FL | 3.0 | 2.0 | 1899 | $2,300 | $1.21 | 21d | 1 | 0.60mi |
| 26162 Stillwater Cir Punta Gorda, FL | 2.0 | 2.0 | 1266 | $2,000 | $1.58 | 21d | 1 | 0.63mi |
| 9984 Spring Gulch Ln Punta Gorda, FL | 3.0 | 2.0 | 1507 | $1,849 | $1.23 | 21d | 1 | 0.65mi |
| 9996 Spring Gulch Ln Punta Gorda, FL | 4.0 | 2.0 | 1950 | $1,895 | $0.97 | 21d | 1 | 0.65mi |
| 26120 Jones Loop Rd Punta Gorda, FL | 3.0 | 1.0–2.0 | 1105 | $2,275 | $2.06 | 13d | 27 | 0.94mi |
| 7361 S Plum Tree Punta Gorda, FL | 3.0 | 2.0 | 1373 | $1,900 | $1.38 | 21d | 1 | 1.00mi |
| 3845 Albacete Cir #50 Punta Gorda, FL | 2.0 | 2.0 | 1451 | $2,200 | $1.52 | 21d | 1 | 1.06mi |
| 449 Royal Poinciana #221 Punta Gorda, FL | 2.0 | 2.0 | 1164 | $1,750 | $1.50 | 21d | 1 | 1.08mi |
| 3800 Tripoli Blvd #35 Punta Gorda, FL | 2.0 | 2.0 | 1451 | $4,200 | $2.89 | 21d | 1 | 1.12mi |
| 3701 Albacete Cir #98 Punta Gorda, FL | 2.0 | 2.0 | 1451 | $3,250 | $2.24 | 21d | 1 | 1.38mi |
Listing history 20 events
-
2026-06-18days on market $100,000 Active 104 DOM
-
2026-06-17days on market $100,000 Active 103 DOM
-
2026-06-16days on market $100,000 Active 102 DOM
-
2026-06-15days on market $100,000 Active 101 DOM
-
2026-06-14days on market $100,000 Active 99 DOM
-
2026-06-13days on market $100,000 Active 98 DOM
-
2026-06-10days on market $100,000 Active 96 DOM
-
2026-06-09days on market $100,000 Active 95 DOM
-
2026-06-08days on market $100,000 Active 94 DOM
-
2026-06-07days on market $100,000 Active 93 DOM
-
2026-06-05days on market $100,000 Active 90 DOM
-
2026-06-03days on market $100,000 Active 89 DOM
-
2026-06-02days on market $100,000 Active 88 DOM
-
2026-06-01days on market $100,000 Active 87 DOM
-
2026-05-31days on market $100,000 Active 86 DOM
-
2026-05-30days on market $100,000 Active 85 DOM
-
2026-04-29price $100,000
-
2026-03-19price $105,000
-
2026-03-06$115,000 Active
-
1994-03-02soldstatus $35,000
ⓘ Source: listings_history table (triggers on properties + properties_extension) + one-shot
backfill from property_details.listing_events for pre-trigger history.
Tax reassessment forecast FL · Resets to sale price
- Current annual tax
- $3,939 · $328/mo
- Projected year-2 tax
- $3,939 · $328/mo
- Expected delta
- $0/yr ($0/mo · 0.0%)
ⓘ Screening estimate from a state-policy table — verify with the county assessor before closing.
Climate risk First Street
- Flood 6/10 Major FEMA zone X (unshaded) · 56% chance over 30 yrs
- Wildfire 2/10 Low
- Heat 10/10 Extreme 7 d/yr ≥108°F today · 28 d/yr by 30 yrs out
- Wind 10/10 Extreme 99% chance of damaging wind over 30 yrs
- Air quality 3/10 Moderate 2 unhealthy d/yr today · 2 by 30 yrs out
Nearby sold comps map
Loading sold comps map…
Walkable amenities ~0.75 mi
Loading nearby amenities…
Taxation est. · year 1
- Rental income
- $28,171
- − Mortgage interest
- −$5,602
- − Property taxes
- −$3,939
- − Insurance
- −$500
- − Repairs & maintenance
- −$2,254
- − Management
- −$2,254
- − Depreciation
- −$2,909
- Taxable income
- $10,713
- Est. tax owed @ 24.0%
- −$2,571
- After-tax cash flow
- $8,951/yr
For passive investors: Depreciation is non-cash, so a rental often shows a tax loss while cash-flowing — sheltering income. Rental losses are passive: they offset passive income freely, and up to $25,000/yr can offset ordinary (W-2) income if you actively participate and your MAGI is under $100k (phasing out to $0 by $150k); unused losses carry forward. On sale, claimed depreciation is recaptured at up to 25%, and gains may owe capital-gains tax (a 1031 exchange can defer both). Figures are a year-1 estimate at your 24.0% rate — not tax advice; consult a CPA.
Schools (NCES district)
- District
- Charlotte
- NCES district ID
- 1200240
- Math proficiency
- 54% ▼ -6.00%
- Reading proficiency
- 54% ▼ -1.00%
- Median HH income
- $44,864
- Composite
- 45.62/100
- National rank
- #2586
- State rank
- #22 of 73 in FL
Livability — Punta Gorda
- Score
- 76/100
- State rank
- #225
- US rank
- #3567
Category grades
Schools grade is shown separately in the Schools card above.
Census & demographics
- County
- Charlotte County · 196,994 people
- City population
- 68,831
- Metro
- Punta Gorda, FL
- Population (ZIP)
- 24,955
- Household income
- $76,369
- Rent vs Own
- Severe rent burden
- 608.0
Population outlook (Charlotte County) Hauer SSP2
- Today (2025)
- 198,646 people
- By 2030
- 210,507 · +6.0%
- By 2040
- 230,857 · +16.2%
- By 2050
- 247,148 · +24.4%
- By 2075
- 281,777 · +41.8%
- By 2100
- 293,609 · +47.8%
Race, ethnicity, and origin ACS 2023
- Neighborhood character
- Predominantly White (86%)
- Race & ethnicity
- White 86% Two or more races 5% Black 5% Hispanic / Latino 4% Asian 1%
- Common ancestry
- Lithuanian 5% Romanian 4% Italian 2%
- Foreign-born
- 7% · Canada
- Languages at home
- 95% English-only · Spanish 3% Other Indo-European 1% German/W. Germanic 1%
Political lean MEDSL · Charlotte
- 2024 margin
- Solid R (+34.0) · D 32.7% · R 66.7%
- 2008→2024 swing
- -26.7pp toward R · 2008: -7.2pp · 2024: -34.0pp
- All cycles
- 2024: R+34.0 2020: R+26.6 2016: R+27.8 2012: R+14.3 2008: R+7.2
Not yet ingested
- Civics
- —
Market trends
- HPI YoY
- ▼ -111.73%
- Current HPI
- 261.6573
- Rent YoY
- ▼ -0.06%
- Metro
- Punta Gorda, FL
- State GDP YoY
- ▲ 3.28%
- F500 in state
- 36
Industry mix (Fortune 500 HQ in FL)
| Industry | F500 HQs | Revenue |
|---|---|---|
| Industrial Technology | 2 | $29B |
|
||
| Insurance | 2 | $17B |
|
||
| Retail | 1 | $60B |
|
||
| Technology Distribution | 1 | $58B |
|
||
| Homebuilding | 1 | $35B |
|
||
| Technology Manufacturing | 1 | $35B |
|
||
Price history
+185.7% since first listed4 events — show timeline
- 2026-04-29 Price Changed $100,000 Stellar MLS as Distributed by MLS Grid
- 2026-03-19 Price Changed $105,000 Stellar MLS as Distributed by MLS Grid
- 2026-03-06 Listed $115,000 Stellar MLS as Distributed by MLS Grid
- 1994-03-02 Sold (Public Records) $35,000 Public Records
Property tax history
+12.6%/yrLatest (2025): $3,939 · -11.3% YoY. Source: county tax records.
Cash-flow waterfall
monthlySold comps — $/sqft
last 12 mo · ≤1 miLoading sold comps…