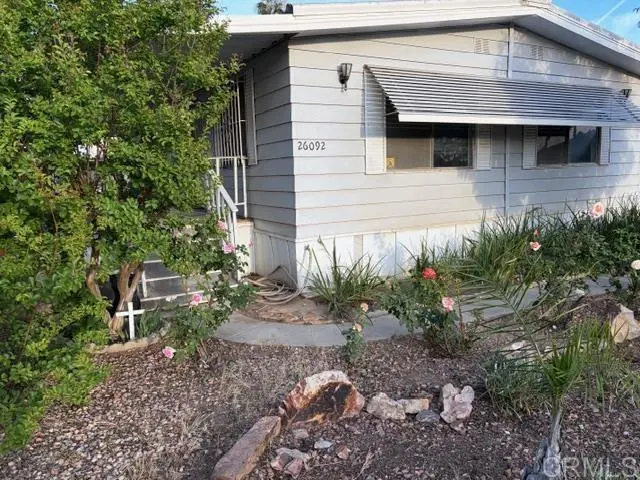
26092 Bamboo Palm · Homeland, CA
Flood risk 1/10 · Minimal
- FEMA flood zone
- X (unshaded)
- Chance of flooding over 30 yrs
- 0.0%
- Est. flood insurance / yr
- $507 – $1,088
Fire risk 8/10 · Major
- Est. fire insurance / yr
- $659 – $1,223
Heat risk 7/10 · Major
- Hot days now (above 103°F)
- 6 days/yr
- Hot days in 30 yrs
- 16 days/yr
Wind risk 1/10 · Minimal
- Chance of severe wind over 30 yrs
- —
Air-quality risk 6/10 · Moderate
- Unhealthy air days now
- 10 days/yr
- Unhealthy air days in 30 yrs
- 14 days/yr
Risk factors via First Street. Map © Google.
Why this score? — see what drove the B grade
The composite is a weighted blend of 9 inputs, each scored 0–100. Each bar is that input's sub-score; the figure is the points it added to the 100-point composite (weight × sub-score).
- Cash flow +23.1/30.0
- ARV discount +14.0/15.0
- Appreciation +10.0/10.0
- DSCR +7.4/10.0
- 1% rule +5.5/10.0
- Schools +3.7/10.0
- Rent growth +2.5/5.0
- Condition / age +2.5/5.0
- Livability +2.2/5.0
$199,000
🖨 Deal sheet 📄 Offer letter ✓ Due diligence
Listing remarks
This home is ready for you! Located in the sought after Highland Palms Senior Community offering free golf, free RV parking, pickleball, exercise room, billiard room, library, and so much more! New flooring, new light fixtures, newer AC, and fresh paint in kitchen and bathrooms means all you need to do is place your furniture and enjoy the active living style! The lot is owned and the monthly HOA is only $135. This home is a must see!
Key facts
- Pickleball
- Exercise room
- Free golf
Tags
Property features AI
Finance
- Other: Community of approximately 530 units; Located near golf course
- HOA & community: Part of Highland Palms Senior association; Monthly HOA fee of $135; Senior community; Community amenities include: pool, spa, heated pool, sauna, clubhouse, billiard room, card room, gym/exercise room, recreational/multipurpose room, barbecue, picnic area, pickleball, golf, common RV parking, pet rules (pets permitted)
Exterior
- Parking: 3 parking spaces; 3 carport spaces
- Utilities: Public sewer
- Home design: No common walls (detached); Single-story; Entry on main level (up a few stairs); Residential zoning
- Construction: Total of 1 story
- Exterior features: Close to clubhouse; In-ground community pool (heated)
Interior
- Kitchen: Kitchen (appliances not specified)
- Bedrooms: 2 bedrooms on the main level
- Flooring: Vinyl flooring; Carpet flooring
- Bathrooms: 2 full bathrooms on the main level
- Heating & cooling: Central cooling
- Interior features: Single-level home; Entry is up a few stairs; Main floor primary bedroom; Family room; Living room
- Laundry & utility: In-closet laundry with washer included; Dryer included
Neighborhood map
What this means for you Summary
Snapshot
- This is a 2-bed/2.0-bath manufactured listed at $199k.
Deal economics
- At list price, monthly cash flow is $355 ($4k/yr) — positive.
- The deal already cash-flows at list — no discount required.
- Meets the 1% rule at list price ($2k rent vs $199k).
- Recommended offer: $193k (3.0% below list) — sets the bar for market timing.
- Cap rate 8.4% vs local median 5.9% in Homeland — top-decile yield for the area; either an underpriced asset or a hidden risk that comps aren't pricing in. Stress-test before assuming the spread holds.
Location & tenants
- Location reads 45/100 on livability (#1,297 in CA) — a working-class tenant base; expect higher turnover. Strengths: housing A+; Watch: cost of living C-, health & safety C-, employment D.
- Romoland Elementary (suburban): math 35% / reading 44% proficiency, ranked #699 of 1,400 in CA (top 50%) — families likely to look elsewhere, expect single-tenant / working-renter base with shorter leases.
- Market conditions: 53 active listings in the ZIP; 1 comparable units currently listed for rent nearby; 9,195 units permitted in Riverside County in 2024 (1,512 in 5+ unit buildings).
Forward outlook
- In year one you build about $21k of equity ($1k loan paydown + $20k appreciation (10.0% local appreciation)).
- Riverside County population projected at +22% by 2050 — long-run rental-demand tailwind backs the buy-and-hold thesis.
- At projected returns (10.0% appreciation + 3.0% rent growth), your $56k cash investment doubles in ~3 years — after that, you're playing with house money.
- By year 2, paydown + projected appreciation supports a ~$34k cash-out refi (75% LTV) — recoverable capital for the next deal without selling this one.
Negotiation context
- It's been on market 32 days — a 3% lower offer ($193k) is reasonable based on typical stale-listing flexibility.
- 3 sale attempts with the ask held roughly flat each time — persistent listings suggest the price (not the market) is what's stuck; bring a comps-based counter.
- Current owner paid $35k; list at $199k implies a 469% gain — meaningful room to come down on a strong offer.
Risks & watch-outs
- Climate carrying-cost: severe wildfire risk; extreme-heat days projected 6→16/yr by 2055 (HVAC capex compounding) — expect insurance premiums to compound above CPI over the hold.
Questions for the listing agent
- It's been on market 32 days. Have you received any prior offers? Is the seller open to a 3% concession, seller financing, or rate buy-down credit?
- Built in 1975 — when were the roof, HVAC, electrical panel, plumbing, and water heater last replaced?
- What does the HOA fee cover, when was the last increase, and are there any pending special assessments or reserve-fund shortfalls?
- Is there a deadline driving the sale (1031 exchange, divorce, estate, relocation)? That informs how much negotiation room exists.
- Schools are F-rated, which usually means shorter tenancies and higher turnover. Who's the typical renter profile here, and what's been the actual vacancy rate?
- Crime grade is F in this area — have there been break-ins, vandalism, or insurance claims at this property in the last 3 years? What carrier currently insures it and at what premium?
- What's the average days-on-market for RENTAL listings here right now (not sales)? A rising rental-DOM trend means longer vacancies and softer asking-rent achievability than the comps imply.
- What's the recent tenant-quality profile in this submarket — average credit score on applications, eviction rate, late-payment / NSF rate, and stable-employment percentage? A property-management company in the area should have these aggregated.
- How much new for-sale + rental construction is in the pipeline within 1–3 miles? Heavy new supply typically softens prices + rents 12–24 months out; constrained supply supports both.
Investment metrics
- 1% rule
- 1.05% ✓
- Cap rate
- 8.44%
- Cash-on-cash
- 7.65%
- DSCR
- 1.34
- GRM
- 7.9
CMA / ARV
- ARV (on-the-fly)
- $232,704
- Comps found
- 12
Show comp detail 12 sales within ~0.75 mi
| Address | Dist | Beds/Ba | Sqft | Sold | Price | $/sf | Match |
|---|---|---|---|---|---|---|---|
| 26076 Butterfly Palm Dr | 0.13mi | 2/2.0 | 1,152 (0%) | 8mo | $233,000 | $202 | 88 |
| 30674 Arenga Palm Dr | 0.12mi | 2/2.0 | 1,152 (0%) | 12mo | $220,000 | $191 | 84 |
| 26068 Fountain Palm Dr | 0.09mi | 2/2.0 | 1,200 (+4%) | 9mo | $220,000 | $183 | 81 |
| 26078 Sago Palm | 0.09mi | 2/2.0 | 1,248 (+8%) | 1mo | $239,900 | $192 | 81 |
| 26056 Butterfly Palm Dr | 0.13mi | 2/2.0 | 1,152 (0%) | 18mo | $210,000 | $182 | 78 |
| 26018 Fountain Palm Dr | 0.13mi | 2/2.0 | 1,176 (+2%) | 17mo | $272,000 | $231 | 76 |
| 26097 Fountain Palm Dr | 0.11mi | 2/2.0 | 1,008 (-12%) | 1mo | $160,000 | $159 | 73 |
| 31271 Terand Ave | 0.53mi | 3/2.0 (+1) | 1,120 (-3%) | 1mo | $140,000 | $125 | 65 |
| 31051 Neer St | 0.29mi | 3/2.0 (+1) | 1,250 (+8%) | 12mo | $430,000 | $344 | 58 |
| 31031 Fretwell Ave | 0.35mi | 2/2.0 | 1,050 (-9%) | 14mo | $282,000 | $269 | 57 |
| 25781 Homeland Ave | 0.66mi | 2/2.0 | 1,200 (+4%) | 17mo | $310,000 | $258 | 48 |
| 25761 Homeland Ave | 0.68mi | 2/2.0 | 1,200 (+4%) | 19mo | $310,000 | $258 | 46 |
Match score weights: distance 35% · size 25% · config 20% · recency 20%. Top-matched comps best support the ARV.
Projected returns pro-forma
10.0% appreciation · 3.0% rent growth · sell at horizon
- IRR
- 29.8%
- Equity multiple
- 3.35×
- Total profit
- $130,999
- Equity at exit
- $179,275
- IRR
- 25.9%
- Equity multiple
- 7.60×
- Total profit
- $367,943
- Equity at exit
- $386,613
Cash invested: $55,720 (down + closing). Projections, not guarantees.
Landlord ↔ Tenant lean methodology
- Overall (STATE)
- 18 Strongly Tenant-Friendly
- State California
- 18 Strongly Tenant-Friendly · D+13
- County
- — inherits STATE
- City
- — inherits STATE
ZIP-level market 92548
- Home prices YoY
- 16.7%
- Active inventory
- 53
- Price-to-rent
- 7.9×
Monthly cashflow live
- Estimated rent
- $2,095 medium interval (Pro) →
- Mortgage (P&I)
- −$1,044
- Tax from tax record
- −$38 /mo · $458/yr
- Insurance
- −$83
- HOA
- −$135
- Vacancy / Maint / Mgmt
- −$440
- Net cashflow
- $355
Break-even live
UW: 25.0% down · 7.5% · 30yr · 1.5% tax · 5.0% vac · 8.0% maint · 8.0% mgmt
Financing live
Cash to close
- Down payment
- $49,750
- Closing costs
- $5,970
- Reserves months
- —
- Total cash needed
- —
Loan-product check · same deal, 3 products live
Conventional
25% down · 7.5% · 30yr
- Down + closing
- —
- Monthly P&I
- —
- Monthly cashflow
- —
- DSCR
- —
- Eligible?
- —
Personal DTI + credit; lowest rate.
DSCR
20% down · 8.5% · 30yr
- Down + closing
- —
- Monthly P&I
- —
- Monthly cashflow
- —
- DSCR
- —
- Eligible?
- —
No personal income docs; deal must DSCR.
Hard money
10% down · 12.0% · 12mo
- Down + closing
- —
- Monthly P&I
- —
- Monthly cashflow
- —
- DSCR
- —
- Eligible?
- —
Short-term bridge; refi at stabilization.
Rent comps 1 comps
| Address | Beds | Baths | Sqft | Rent | $/sqft | DOM | Units | Dist |
|---|---|---|---|---|---|---|---|---|
| 25806 Creag Ave Homeland, CA | 2.0 | 2.0 | 792 | $2,095 | $2.65 | 24d | 1 | 1.00mi |
HOA detail
- Monthly dues
- $135 · $1,620/yr
Listing history 21 events
-
2026-06-18days on market $199,000 Active 32 DOM
-
2026-06-17days on market $199,000 Active 31 DOM
-
2026-06-16days on market $199,000 Active 30 DOM
-
2026-06-15days on market $199,000 Active 29 DOM
-
2026-06-13days on market $199,000 Active 27 DOM
-
2026-06-09days on market $199,000 Active 23 DOM
-
2026-06-08days on market $199,000 Active 22 DOM
-
2026-06-07days on market $199,000 Active 21 DOM
-
2026-06-04days on market $199,000 Active 18 DOM
-
2026-06-03days on market $199,000 Active 17 DOM
-
2026-06-02days on market $199,000 Active 16 DOM
-
2026-06-01days on market $199,000 Active 15 DOM
-
2026-05-31days on market $199,000 Active 14 DOM
-
2026-05-17$199,000 Active
-
2026-05-17historical
-
2025-12-10price $210,000
-
2025-11-22historical
-
2025-11-19$225,000 Active
-
2025-11-15$225,000 Active
-
2025-11-05historical
-
1989-11-07soldstatus $35,000
ⓘ Source: listings_history table (triggers on properties + properties_extension) + one-shot
backfill from property_details.listing_events for pre-trigger history.
Tax reassessment forecast CA · Resets to sale price
- Current annual tax
- $458 · $38/mo
- Projected year-2 tax
- $1,512 · $126/mo
- Expected delta
- +$1,054/yr (+$88/mo · 230.0%)
ⓘ Screening estimate from a state-policy table — verify with the county assessor before closing.
Climate risk First Street
- Flood 1/10 Low FEMA zone X (unshaded) · 0% chance over 30 yrs
- Wildfire 8/10 Severe
- Heat 7/10 Severe 6 d/yr ≥103°F today · 16 d/yr by 30 yrs out
- Wind 1/10 Low
- Air quality 6/10 Major 10 unhealthy d/yr today · 14 by 30 yrs out
Nearby sold comps map
Loading sold comps map…
Walkable amenities ~0.75 mi
Loading nearby amenities…
Taxation est. · year 1
- Rental income
- $25,140
- − Mortgage interest
- −$11,147
- − Property taxes
- −$458
- − Insurance
- −$995
- − Repairs & maintenance
- −$2,011
- − Management
- −$2,011
- − HOA
- −$1,620
- − Depreciation
- −$5,789
- Taxable income
- $1,108
- Est. tax owed @ 24.0%
- −$266
- After-tax cash flow
- $3,998/yr
For passive investors: Depreciation is non-cash, so a rental often shows a tax loss while cash-flowing — sheltering income. Rental losses are passive: they offset passive income freely, and up to $25,000/yr can offset ordinary (W-2) income if you actively participate and your MAGI is under $100k (phasing out to $0 by $150k); unused losses carry forward. On sale, claimed depreciation is recaptured at up to 25%, and gains may owe capital-gains tax (a 1031 exchange can defer both). Figures are a year-1 estimate at your 24.0% rate — not tax advice; consult a CPA.
Schools (NCES district)
- District
- Romoland Elementary
- NCES district ID
- 0633390
- Math proficiency
- 35% ▲ 2.00%
- Reading proficiency
- 44% ▲ 1.00%
- Median HH income
- $58,935
- Composite
- 37.36/100
- National rank
- #8931
- State rank
- #699 of 1400 in CA
Livability — Homeland
- Score
- 45/100
- State rank
- #1297
- US rank
- #26584
Category grades
Schools grade is shown separately in the Schools card above.
Census & demographics
- Census place
- Homeland, CA
- Population (ZIP)
- 6,435
Population outlook (Riverside County) Hauer SSP2
- Today (2025)
- 2,664,475 people
- By 2030
- 2,802,692 · +5.2%
- By 2040
- 3,050,904 · +14.5%
- By 2050
- 3,256,783 · +22.2%
- By 2075
- 3,655,058 · +37.2%
- By 2100
- 3,766,594 · +41.4%
Race, ethnicity, and origin ACS 2023
- Neighborhood character
- Predominantly Hispanic (65%)
- Race & ethnicity
- Hispanic / Latino 65% White 30% Two or more races 9% Native American 3% Asian 3%
- Hispanic origin (detail)
- Mexican 59% Puerto Rican 2%
- Common ancestry
- Italian 2% Lithuanian 1% Serbian 1%
- Foreign-born
- 20% · Canada, South Korea
- Languages at home
- 54% English-only · Spanish 44% Korean 1% Vietnamese 1%
Political lean MEDSL · Riverside
- 2024 margin
- Toss-up / Even · D 48.0% · R 49.3% · Other 2.6%
- 2008→2024 swing
- -3.6pp toward R · 2008: 2.3pp · 2024: -1.3pp
- All cycles
- 2024: R+1.3 2020: D+8.0 2016: D+4.3 2012: R+0.4 2008: D+2.3
Not yet ingested
- Civics
- —
Market trends
- HPI YoY
- ▲ 62.36%
- Current HPI
- 435.0222
- Rent YoY
- —
- Metro
- —
- State GDP YoY
- ▲ 3.21%
- F500 in state
- 116
Industry mix (Fortune 500 HQ in CA)
| Industry | F500 HQs | Revenue |
|---|---|---|
| Technology | 27 | $1,492B |
|
||
| Financial Services | 3 | $174B |
|
||
| Retail | 3 | $44B |
|
||
| Insurance | 3 | $26B |
|
||
| Media / Entertainment | 2 | $115B |
|
||
| Pharmaceuticals / Biotech | 2 | $62B |
|
||
Price history
+468.6% since first listed8 events — show timeline
- 2026-05-17 Listing Removed — CRMLS
- 2026-05-17 Listed $199,000 CRMLS
- 2025-12-10 Price Changed $210,000 CRMLS
- 2025-11-22 Listing Removed — CRMLS
- 2025-11-19 Listed $225,000 CRMLS
- 2025-11-15 Listed $225,000 CRMLS
- 2025-11-05 Coming Soon — CRMLS
- 1989-11-07 Sold (Public Records) $35,000 Public Records
Property tax history
-0.1%/yrLatest (2025): $458 · +0.3% YoY. Source: county tax records.
Cash-flow waterfall
monthlySold comps — $/sqft
last 12 mo · ≤1 miLoading sold comps…